Market Turning Points


Current position of the market
SPX: Very Long-term trend – The very-long-term cycles are in their down phases, and if they make their lows when expected (after this bull market is over), there will be another steep decline into late 2014. However, the Fed policy of keeping interest rates low has severely curtailed the full downward pressure potential of the 40-yr and 120-yr cycles.
Intermediate trend – Trying to overcome resistance at the high.
Analysis of the short-term trend is done on a daily basis with the help of hourly charts. It is an important adjunct to the analysis of daily and weekly charts which discusses the course of longer market trends.
TESTING RESISTANCE AT FORMER HIGH
Market Overview
Once again, the market failed to reach its downside correction potential. Although the Point & Figure distribution pattern called for a possible decline to about 1820, the SPX found buyers at 1850 and rallied strongly from that level. After a short pause at the 1874 resistance, it punched through on Friday morning and went on to test its all-time high which was breached fractionally before the bears were able to muster enough selling to send the index into a retreat to 1864 by the end of the day.
The rally to the high started when selling dried up around the 1840 level and formed enough of a base to take it back to about the 1880 level. This is not only a volatile market but it is a strong market which has repeatedly frustrated the bears by keeping declines in check and surpassing what should have been valid upside projections. The current short-term uptrend started at the 1840 level and has reached the former highs in a choppy manner that has all the earmarks of an ending diagonal. The pattern looks as if it needs one more near-term uptrend to be complete. If the analysis is correct, this could take the SPX a few points beyond Friday’s high, but not much more. Then, another retreat is likely into the early part of April when a weekly Kress cycle is due to make its low.
This essentially trendless volatility may be in the process of establishing an important zone of distribution which is normally a precursor to a serious reversal. Heaven knows that a sizeable correction is long overdue and, if the long-term cycles bottoming at the end of the year get into the act, it may even turn into something more serious.
The likely scenario will be another limited retracement into the first week in April, followed by another two weeks of rally which may either make a new high or fall short of doing so. The dangerous period for bulls could start at mid-month.
Chart Analysis
SPX has found repeated resistance at the top of two important channels which have consistently stopped the attempts at extending the long-term uptrend which started in October 2011. This is obvious on the chart! The long-term channel (purple) starts on that date and is providing a lid for prices around 1880. But there is another intermediate (green) channel which is assisting. This one starts in June 2013 at 1560. The bottom line of that channel has proven itself by lining up three lows exactly. The zone of resistance that is forming around these highs should not be underestimated, especially since they are reinforced by the top channel line of the bull market.
Here, a little speculation is in order. The fact that the SPX has repeatedly risen to these combined top channel lines means that it is a strong market. Corrections have been brief and shallow in the past 9 months. This tells me that although I expect an important top to form in this general area, possibly during the next 3 weeks, it may not be the end of the bull market, even though it is already 5 years old. The longer for the important cycles bottoming around October delay taking hold, the least important will be the resulting decline. Consequently, what we may witness is a severe enough retracement into that time period, but once they have bottomed, these cycles could easily take the market to a new high in 2015 or 2016. This is only a rough road map which will need adjustments as it is traveled by the market, and we shall revisit it time and again as we move forward.
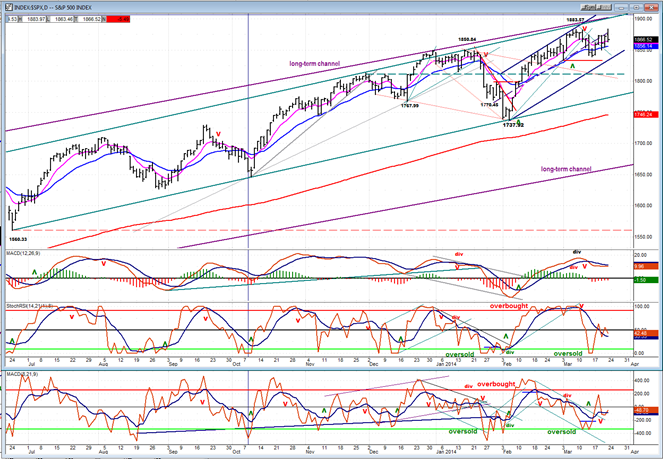
A quick look at the oscillators shows the SPX to be in a neutral position. The two lower indicators are having difficulty penetrating the zero line, as well as making a decisive bullish cross. The price MACD is saying pretty much the same thing, also being unable to make a bullish cross, but remaining in positive territory. If the diagnosis of an ending diagonal is correct, the overall pattern will show little change over the next couple of days.
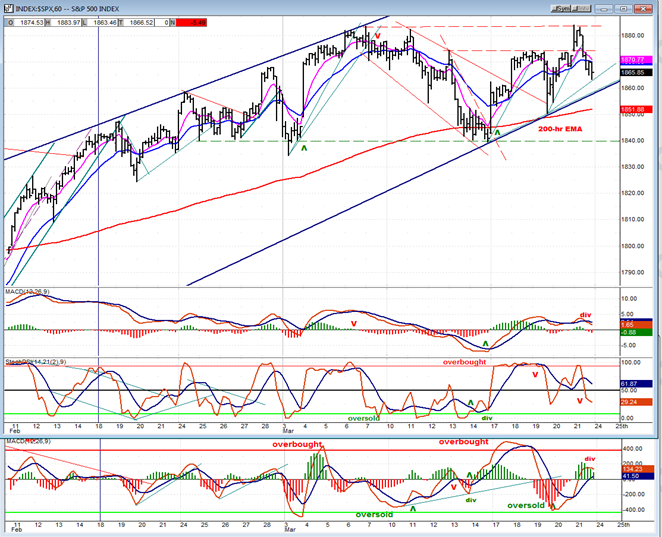
The hourly chart shows more clearly the short-term uptrend from 1840 as part of the overall trend from 1738. The move which challenged the former top and was repulsed was a second wave of the uptrend from 1840 which had a sudden reversal at 1843. Some negative divergence did show up in the A/D (lower) oscillator, but the price and middle oscillator made and inverted “v” top, with hardly any near-term distribution.
If that was wave 3 of an ending diagonal, and the pull-back is wave 4, then we should get one more try at the high, possibly surpassing Friday’s price by a few points and thus completing wave 5. The converging trend lines from the 1738 low appear to confirm the pattern by producing an upward slanting wedge. This would then be followed by a down move into the first week of April which would retrace a portion of the 150-point move.
The A/D oscillator is showing significant divergence. Even if it manages to go a little higher on the next near-term up-move, it should remain well below its previous overbought high. The other two oscillators should also form a top formation. But the greatest negative divergence will show up in daily oscillators -- unless this is not a terminal pattern and the former highs are exceeded by a decisive advance.
Cycles
Re-iterating what was said earlier, the most dominant short-term cycle should produce a low in the first week of April.
Breadth
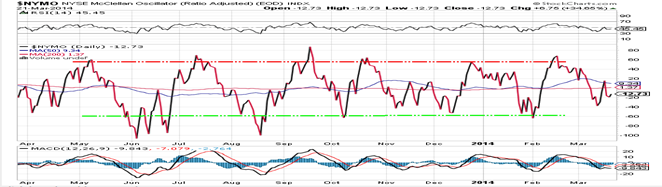
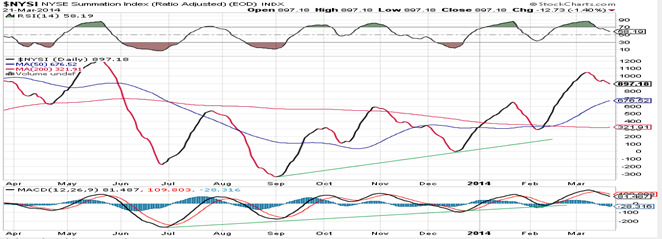
Charts of the McClellan Oscillator and Summation Index appear below (courtesy of StockCharts.com).
One glance at the McClellan Oscillator tells us that a market which goes beyond its former all-time high with this kind of a pattern is going to be in trouble! I have not checked closely, but I don’t think that there has been this kind of negative divergence in the past year.
As for the Summation Index, it has started to decline and shows compound negative divergence with the weekly SPX chart as well as with itself. Note also that its RSI has not even dropped half-way from its overbought condition and appears to have further to go before it becomes oversold. This can only be accomplished with a down market!
 Sentiment Indicators
The SentimenTrader (courtesy of same) long-term and short-term indicators have now remained at the same values for five consecutive Fridays.
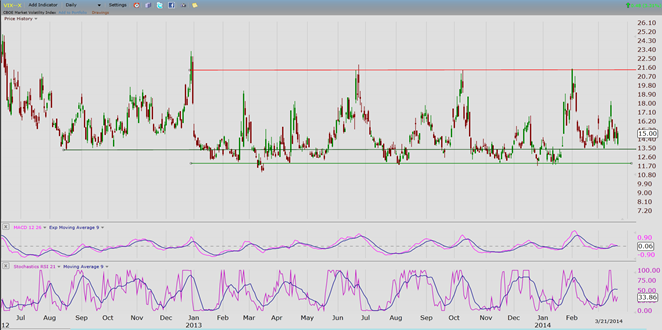
VIX (Velocity Index)
Since the end of 2012, VIX has made a consistent pattern of highs and lows within a defined range. All peaks (which correspond to correction lows in the market) have had nearly the same amplitude while the lows (which mark the top of each consecutive high in the market) established the limits of the trading range. The pattern remained very regular until about a month ago when a change occurred. The lows refused to go to the bottom of the previous range and, instead, started to form a base at the level of the lows established in the last half of 2012.
I believe that this is telling us that a change is about to take place in the market trend. The new VIX pattern corresponds roughly with SPX meeting resistance at the top channel lines. At some point in the near future, the index will get tired of bumping its head against a seemingly impenetrable ceiling and will begin a corrective move. At that time, VIX will most likely challenge the top of its range and pierce through.
QQQ (Powershares QQQ Trust)
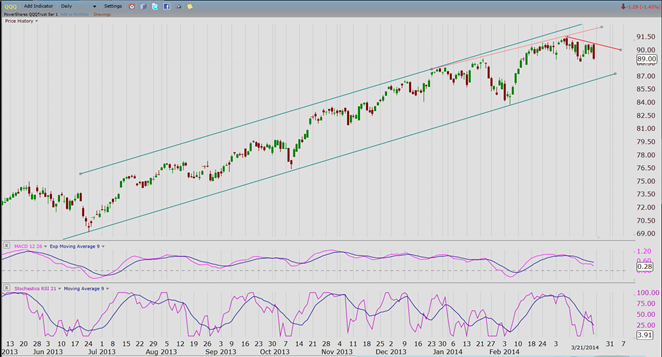
This week, I have replaced XLF with QQQ because I believe that QQQ is turning out to be the next leading index, after the DOW, to show relative weakness to the SPX. Just like VIX, QQQ is giving us an advance warning that a market top is in the making. The channel drawn around QQQ is similar to the intermediate SPX channel.
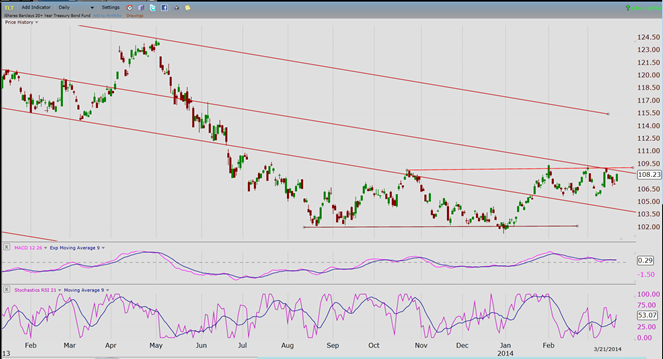
TLT (Barclays 20+ year Treasury bond fund)
TLT has made multiple attempts at overcoming the resistance imposed by a former high and a parallel to the long-term down trend line. The third try was not charm, but the fourth could be. The index would then be expected to reach its 114/115 target.
GLD (ETF for gold)
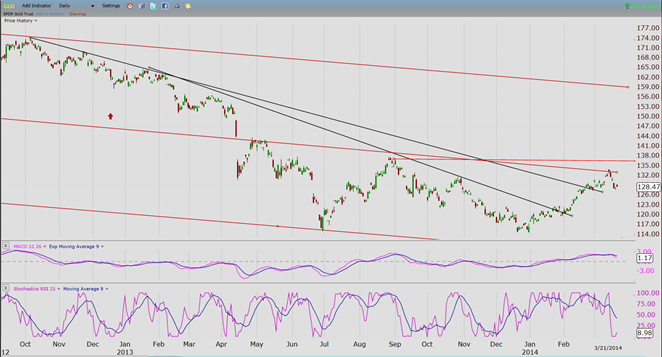
About 10 weeks ago, GLD started an uptrend which, so far, has overcome two important down trend lines. It is now taking a breather after unsuccessfully challenging the mid-channel line of its long-term corrective channel. GLD has also essentially reached its minimum target of 134. So far, it is not giving us any reason to believe that this is anything more than a short consolidation period, after which it should resume its uptrend. If this happens, it would have a good chance of making it to the 140 level before ending its rally.
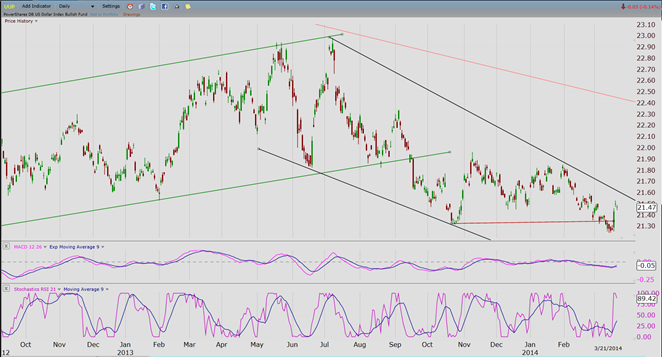
UUP (dollar ETF)
There are signs that UUP has gottten tired of drifting lower and last week saw a sharp bounce off its low. We will now wait to see if it is capable of overcoming the top of its descending channel. If it is, it would next have to surpass the 22.00 level to show that it is in the process of starting a significant uptrend.
USO (United States Oil Fund)
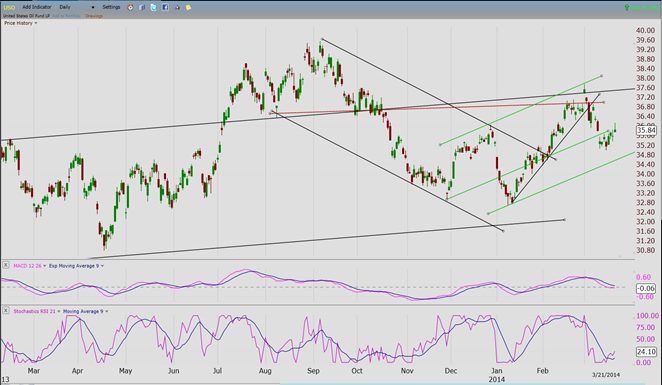
USO looks as if it has established a downtrend which will take it to the bottom of its green channel. If it holds, that would keep it in an uptrend but, unless it shows that it can develop some good upside momentum, the pattern that it has made since January may turn out to be only the mid-point of a decline which started last September.
Summary
Last week, SPX re-tested its 1883 high but was only able to surpass it by a fraction before being pushed back. Another attempt is likely this week if the pattern it is making is correctly being analyzed as an ending diagonal. This should be followed by another short-term correction into the first week of April.
On a longer time frame, it appears that the index has started undergoing a process of distribution which will result in a significant decline sooner rather than later.
++++++++
FREE TRIAL SUBSCRIPTON
Market Turning Points is an uncommonly dependable, reasonably priced service providing intra-day market updates, a daily Market Summary, and detailed weekend reports. It is ideally suited to traders, but it can also be valuable to investors since highly accurate longer-term price projections are provided using Point & Figure analysis. Best-time reversal estimates are obtained from cycle analysis.
For a FREE 4-week trial, send an email to: [email protected]
For further subscription options, payment plans, weekly newsletters, and for general information, I encourage you to visit my website at www.marketurningpoints.com. By clicking on “Free Newsletter” you can get a preview of the latest newsletter which is normally posted on Sunday afternoon (unless it happens to be a 3-day weekend in which case it could be posted on Monday).
The above comments and those made in the daily updates and the Market Summary about the financial markets are based purely on what I consider to be sound technical analysis principles. They represent my own opinion and are not meant to be construed as trading or investment advice, but are offered as an analytical point of view which might be of interest to those who follow stock market cycles and technical analysis.

When Andre Gratian was a stock broker years ago, a friend introduced him to technical analysis of the market. Consequently, it is not an exaggeration to say that Andre fell in love with this approach! Ever since then, it has become an increasingly important part of his professional life. Gratian has studied the works of Wyckoff, Edwards & Magee, Edward J. Dewey (cycles) and many others. However, one of my most profitable undertaking has probably been to study Point & Figure charting, which he finds invaluable in analyzing stocks and indices. If he were restricted to one methodology, this is the one that he would choose. This well-rounded background has given him what he feels to be a special insight into the stock market, facilitating the recognition of meaningful patterns and the ‘turning points’ in all trends, whether they be short or long term. Andre feels very comfortable discussing the stock market and passing on meaningful information to others. His subscribers include individuals and money managers throughout the world. Moreover, his Newsletters are currently published on several financial sites, here and abroad.


