Market Update


After two weeks of trying, the Dow Jones now finds itself above its high of last April, and recorded it first BEV Zero in the Bear's Eye View chart below since 29 April 2011.
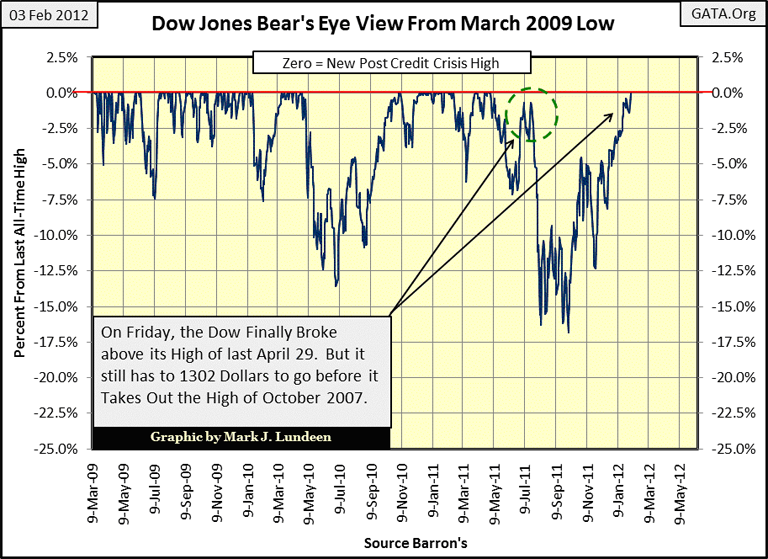
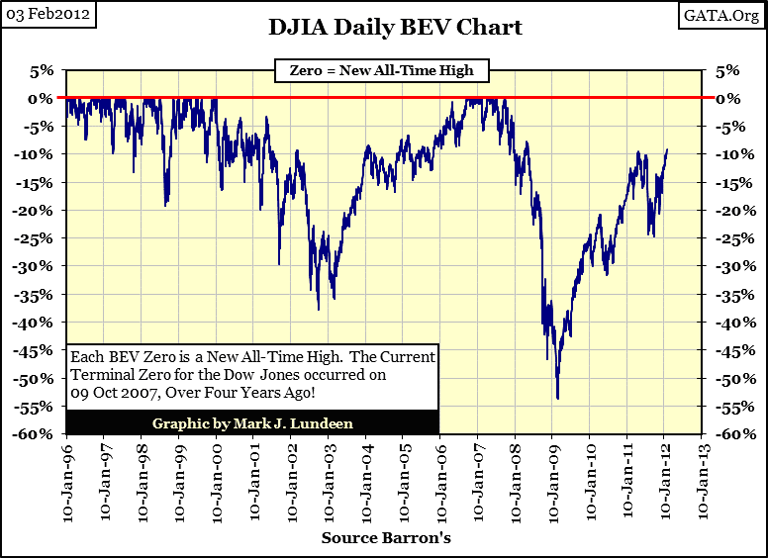
For the bulls, having the Dow Jones breaking above the high of last year is a good sign, a necessary first step if the stock market is to move above its last all-time high of October 2007. To advance to a new all-time high (BEV Zero in the BEV chart below) the Dow Jones must increase another 1,303 dollars, or 9.19 BEV points from Friday's high. Gaining 10% in a few months is no big problem, if we are in a bull market.
So, are we in a bull market? Well, according to Kevin M. Warsh: Former Federal Reserve Governor in his comments made to the Stanford University Institute for Economic Policy Research, 25 Jan 2012 (see above). There are good reasons to suspect that the Dow Jones and most other financial asset prices are only going up because central banks are interfering with the price discovery mechanism of the markets. Or as Mr. Warsh put it: "Central banks are now so heavily influencing asset prices that investors are unable to ascertain market values." Whether or not the Dow Jones is in a bull market is really a mote-point as far as I'm concerned; as the market's legitimate supply and demand forces have been, and will be suspended until further notice, or until Mr Bear gets really, really mad! Let's just call the current rise in the Dow Jones a BS Market.
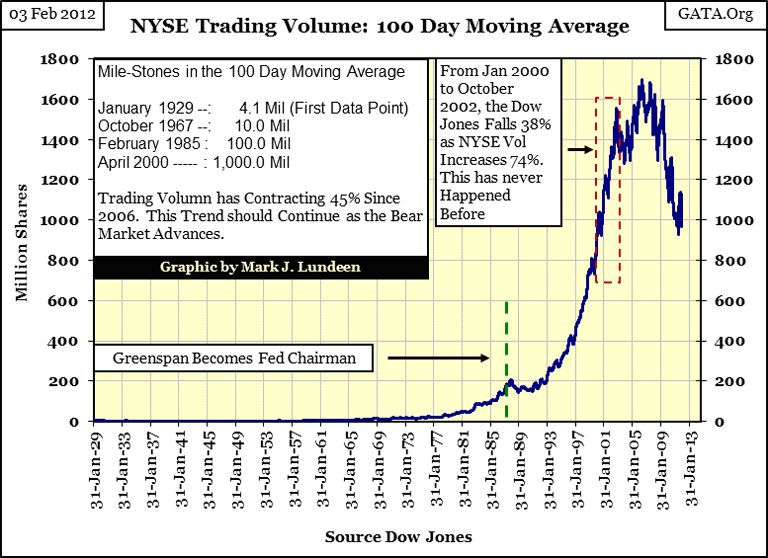
Well it is! Since 2000, trading volume has been out-of-whack; we need to look at the relationship between volume and the Dow Jones from 1929 to 1933 to see how things were before Chairman Greenspan inflated the High-Tech bubble. During the 1920s bull market, volume increased briskly, and then spiked in October - November 1929 when panic gripped the bulls in a rush to exit the market during the crash of 1929. But after the crash, as Mr Bear began grinding down what was left of the Dow's valuation for the next two and a half years, daily trading volume declined by 89%.
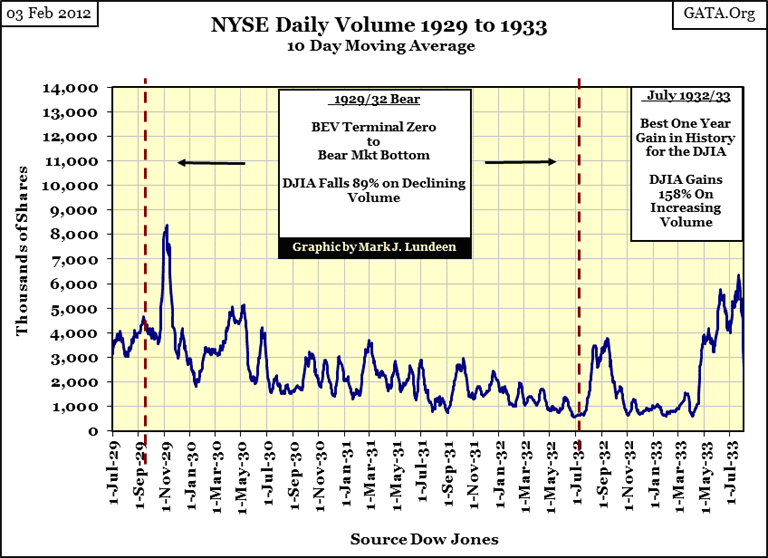
Then, beginning in July 1932, at the bottom of an 89% bear market decline in the Dow Jones, the Dow Jones began its best year in history, a 52 week, 158% gain as trading volume exploded. This fantastic gain in the blue-chips came in two pulses of daily trading volume. The first was a relief rally off the Dow's July 1932 bottom, which was spent by November, but the Dow Jones itself was up nicely from its July bottom. Incredibly, the second pulse in trading volume was ignited only weeks after President Roosevelt declared a bank holiday - it's true!
Now look at what trading volume has done since 2000. The first fly-in-the-ointment was seeing the Dow Jones decline 38% as trading volume exploded 74% from January 2000 to October 2002. Since 1900, nothing similar has ever happened. Then, from the traumatic bottom of the second deepest bear market the Dow has seen since 1900 (March 2009), we now find the Dow Jones less than 10% from taking out the high of October 2007, as daily trading volume has been collapsing for the past three years.
These are not the natural market price movements and volume trends found in a functioning stock market. We are observing a market being manipulated at the highest levels of government and finance. This is going to end in tears.
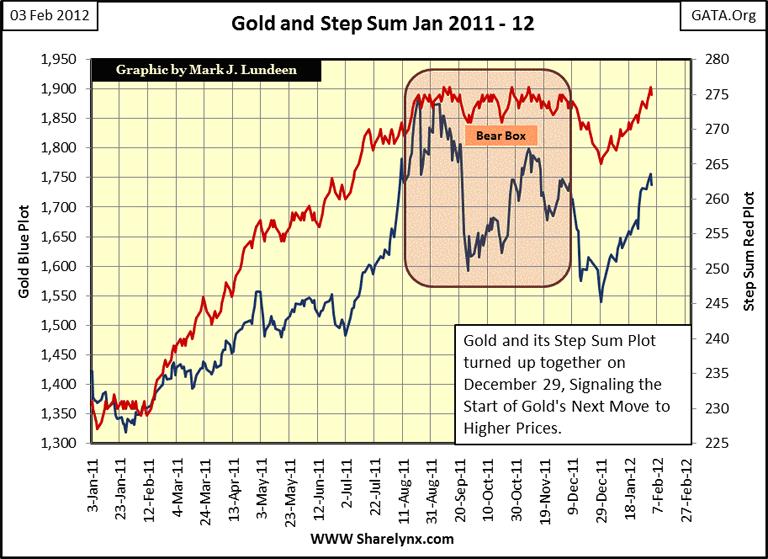
Gold bugs were bugged by what happened today (Friday); gold and silver were whacked again. But the precious metals still look good. Nothing really changed in my gold and its step sum chart, both are still rising nicely.
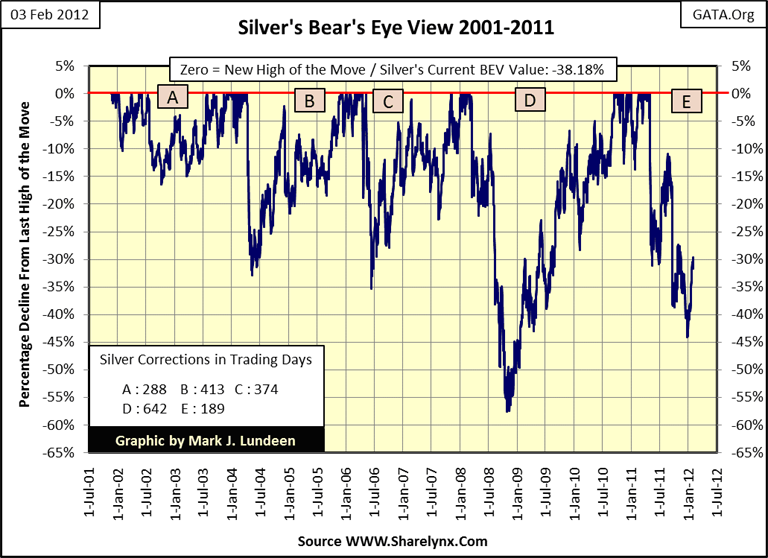
Silver looks good too, just a tad below its BEV -30% line, and on track to move to higher prices.
What can I say; the entire global financial system is out-of-whack. So what are we to do? Well Doctor Bernanke would tell you to take two aspirins in the morning as you buy more of those cheap financial stocks, AAA rated US Treasuries, and stop bothering him with those pesky phone calls asking him when to sell! But I expect those words-of-wisdom will prove to be yet another example of the past bad advice he is becoming famous for. Personally I recommend listening closely to the good doctor, and then do the opposite; like buying and hold gold and silver, and dumping the financials and Treasury Debt.
Mark J. Lundeen
[email protected]
[email protected]
More from Gold-Eagle


