Market Update for August 8th


Things came up late in the week, that diverted my attention from my article. So, as is usual, innocent people (my readers) are the ones to suffer.
It couldn’t be helped. Still, I can do a quick, down, and dirty weekly update, which includes the monumental-market news, that this week the gold and silver miners in the XAU saw two new all-time highs. Something not seen since April 2011. But first, let’s look at the Dow Jones’ BEV chart below.
The Dow Jones, since late June, has daily closed within scoring position; within 5% of its last all-time high of December 4th 2024. It has come really close to breaking into market history, by closing above last December’s 45,014.04. But as of this week, it’s been eight months of coming close, but somehow just doesn’t do what is supposed to happen in all bull market advances; make a new all-time high.
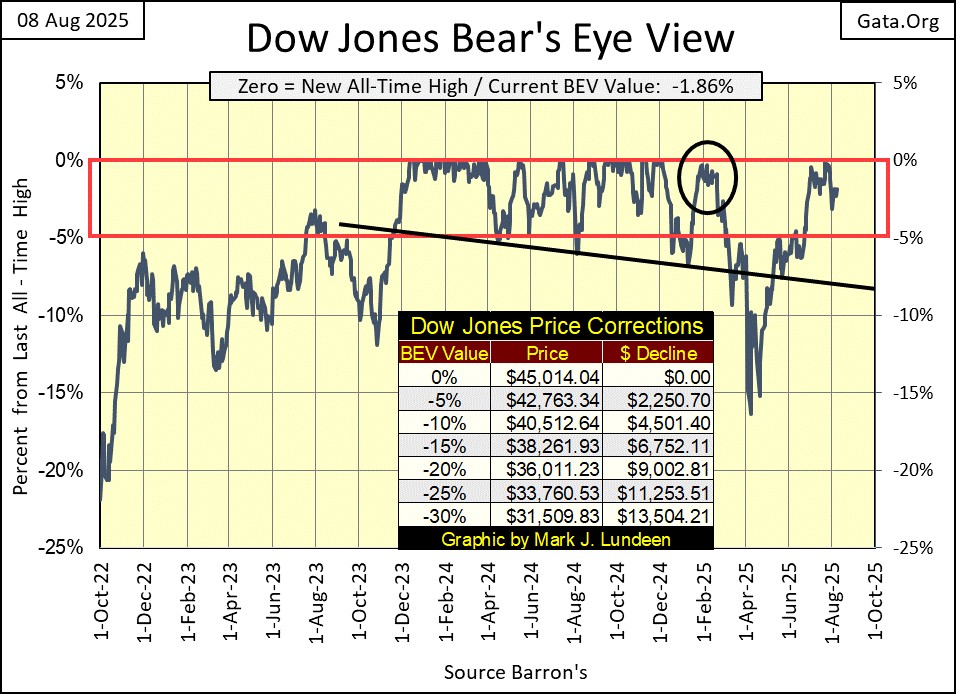
This isn’t going to go on forever. The day is coming when the Dow Jones will once again begin making new all-time highs (0.0% = BEV Zeros) in its BEV chart above, or it will once again break below scoring position (below its BEV -5% line above), and keep going down to levels investors today, don’t believe are possible.
Which will it be? I don’t know. And I don’t care to guess, as every time I do, I usually get it wrong. But one thing I am not afraid to state as fact is; if it isn’t already there, the stock market is very close to a historic market top. And market tops are where risks to invested funds increase to maximum, while the potential for gaining a profit from exposing funds to market risks approach Zero.
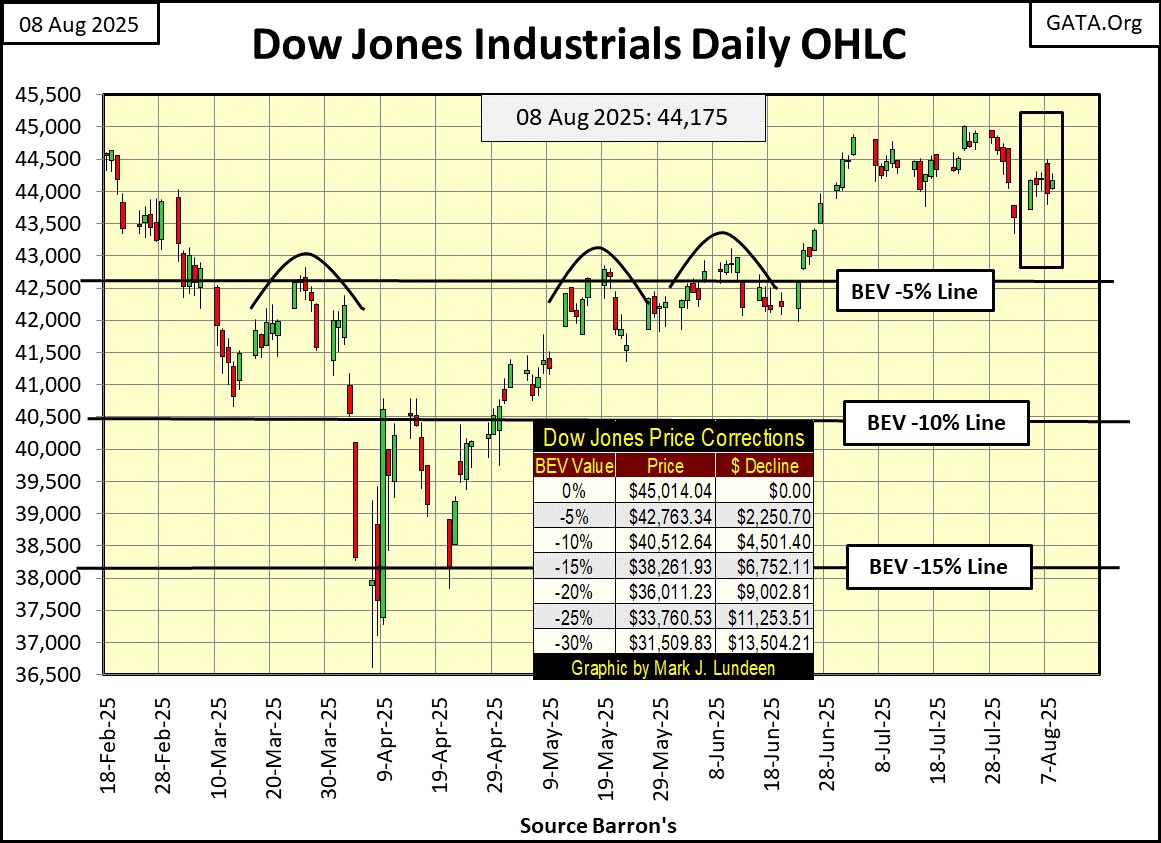
In its daily bar chart below, the Dow Jones struggled this week trying to recover some of its losses from last week. Just looking at this chart, I get the feeling that the bulls are having problems. If the Dow Jones closes below its BEV -5% line, it may see a repeat of last March, where it soon slipped below its BEV -15% line fairly quickly. But, only time will tell us what is to be.
The Dow Jones may not be able to generate new BEV Zeros. But in the table listing the major-market indexes I follow below, that isn’t true for all of the indexes I track. * AND * look at #3 below, the XAU saw not one, but two new BEV Zeros this week, new all-time highs on Thursday and Friday. That is something we’ve not seen since April 2011.
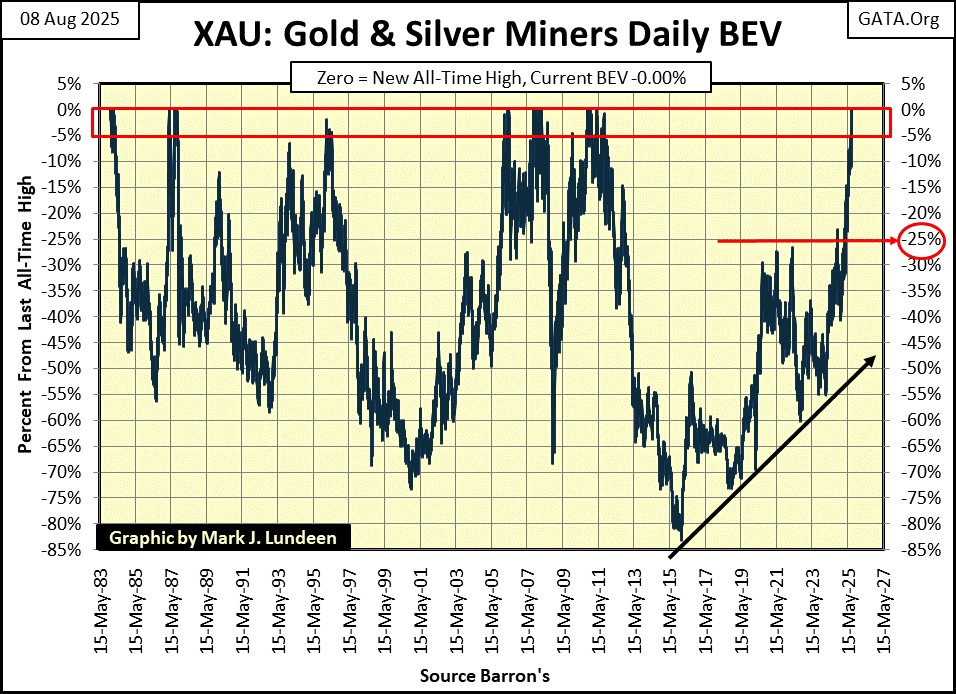
Here is the BEV chart for the XAU. Bear’s Eye View (BEV) charts take market data published in dollars, and convert these dollar values into percentages that range from 0.0% (new all-time highs) down to -100%, a total wipeout in valuation. It’s not a normal display of market data, but the Bear’s Eye View provides a very useful historical perspective of a market, from the stand point of new all-time highs, and market claw-backs from those all-time highs.
Look at that massive bear market bottom from January 2016, an 83% bear market decline from its last all-time high in April 2011.
But the XAU only goes back to 1983, while the Barron’s Gold Mining Index (BGMI) can be traced back to 1920. As seen in the BGMI’s BEV chart below, the bear market bottom of January 2016, was the deepest bear-market bottom the gold and silver miners have seen in the past 105 years.
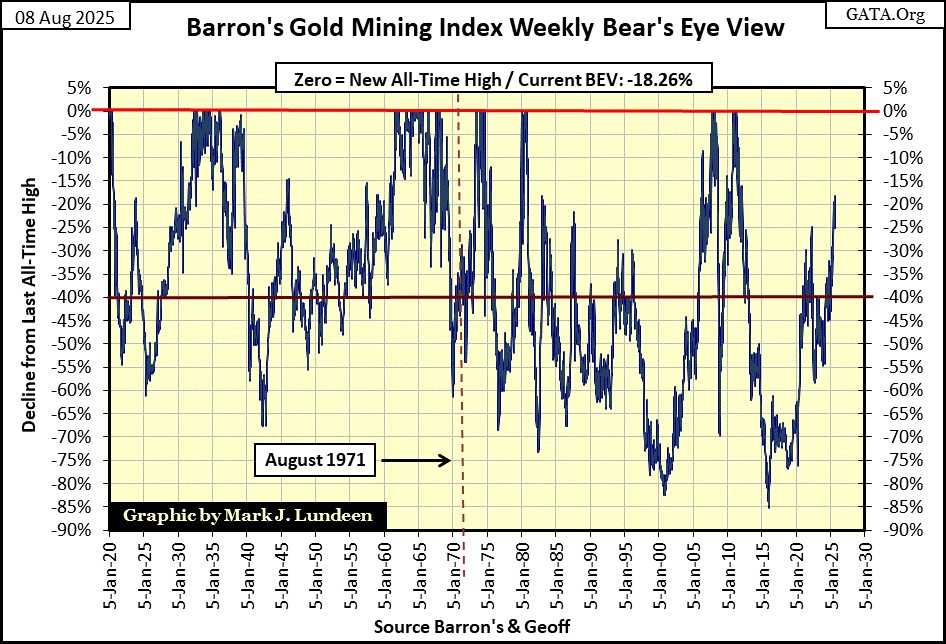
This is a very important point to keep in mind, because; managed money, and the investment public lost all interest in the gold and silver miners since that massive bottom. Even though the XAU closed the week with a BEV Zero, and the BGMI closed the week with a BEV of -18.26%, August 2025 is one of the very rare points in time, where average people can enter a major bull market in something, currently in the precious metal miners, before the crowd arrives.
One of these days, trillions-of-dollars are going to attempt to buy these gold and silver miners, because the stock and bond markets will then be deflating. I can’t say when, but that day is coming, and now is the time to buy.
Looking at the major-market indexes BEV values below, Friday’s close saw four of them at a new all-time high (0.0%), and the next twelve market indexes closing in scoring position, above their BEV -5% lines. The Average for these indexes (#15) close the week with a BEV of -3.66%.
To see the average of 21 of these indexes, close with a BEV of -3.66%, is a statement of market strength. This looks very good. But then, this is how all market tops look like.
But the fact is, the best time to be a buyer in the market, is when everything looks horrible! In the Major Market Indexes BEV Average chart below, the most profitable entry point was in March 2009, when this average broke below its BEV -60% line.
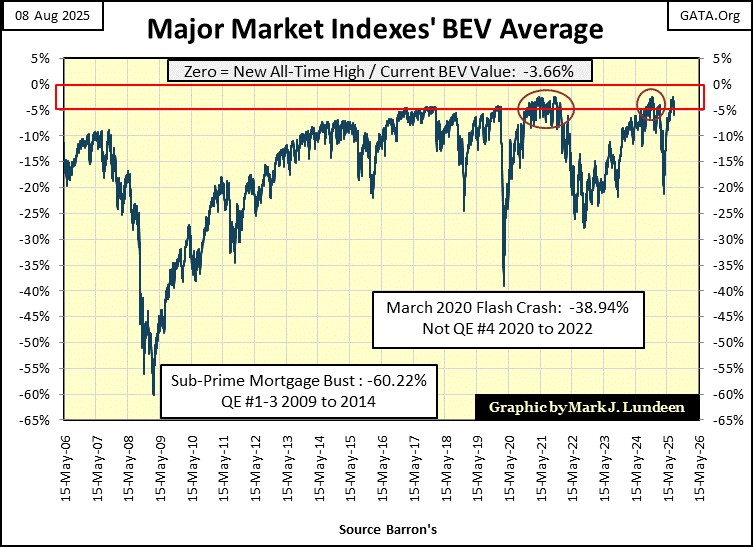
The NASDAQ Banking Index remains at #21 in the list, 21% below its last all-time high of November 2021. Why are these banks doing so poorly, when so many other indexes are doing so good? I don’t like it.
Are we going to wake up some morning, with news of bank closures somewhere in the country? Bank failures are never good news for a bull market advance.
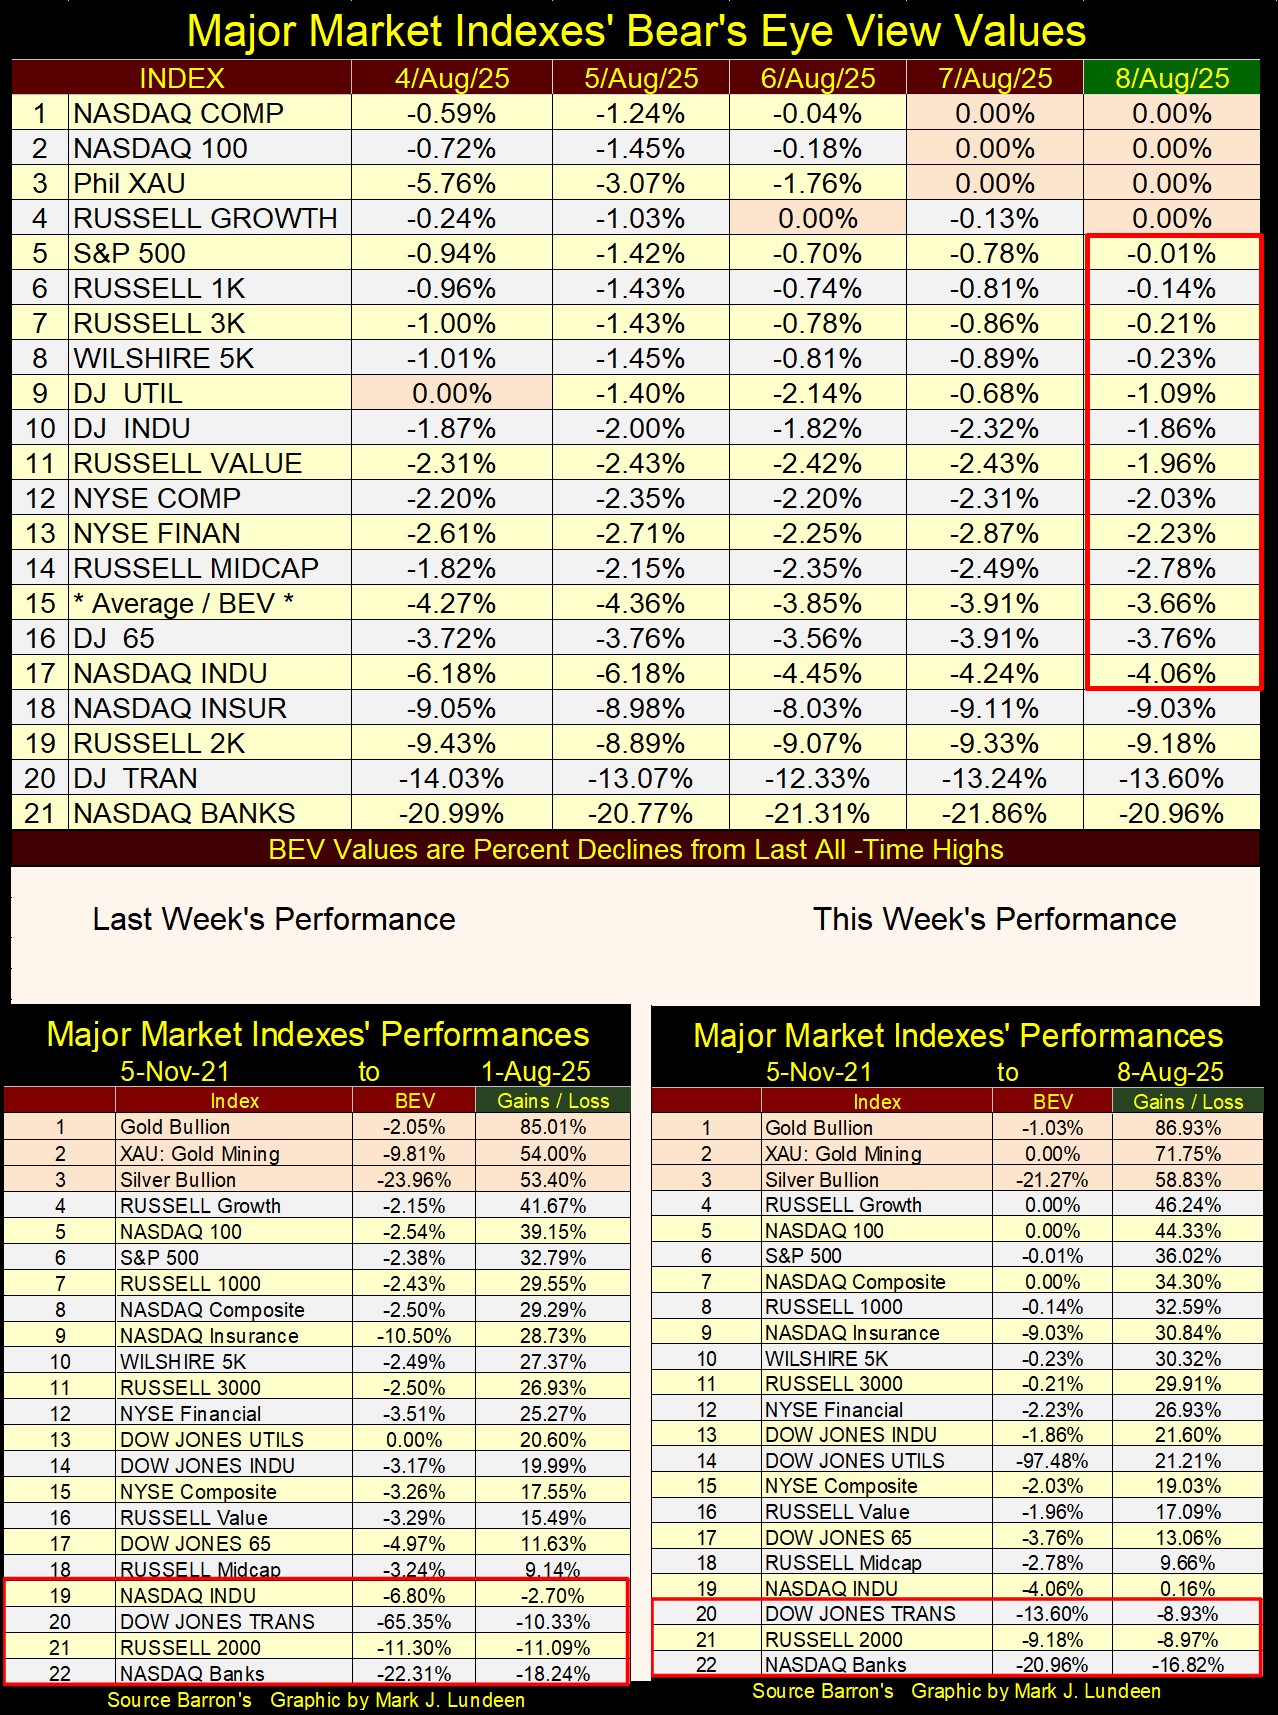
In this week’s performance table above, the XAU (#2) saw a huge jump from last week’s table. It’s only a matter of time before the XAU rises to the #1 position, and stays there. But as much as I like the miners, people should have some exposure to gold and silver bullion too. Like the XAU recent rocket shot to a new all-time high, silver should soon follow.
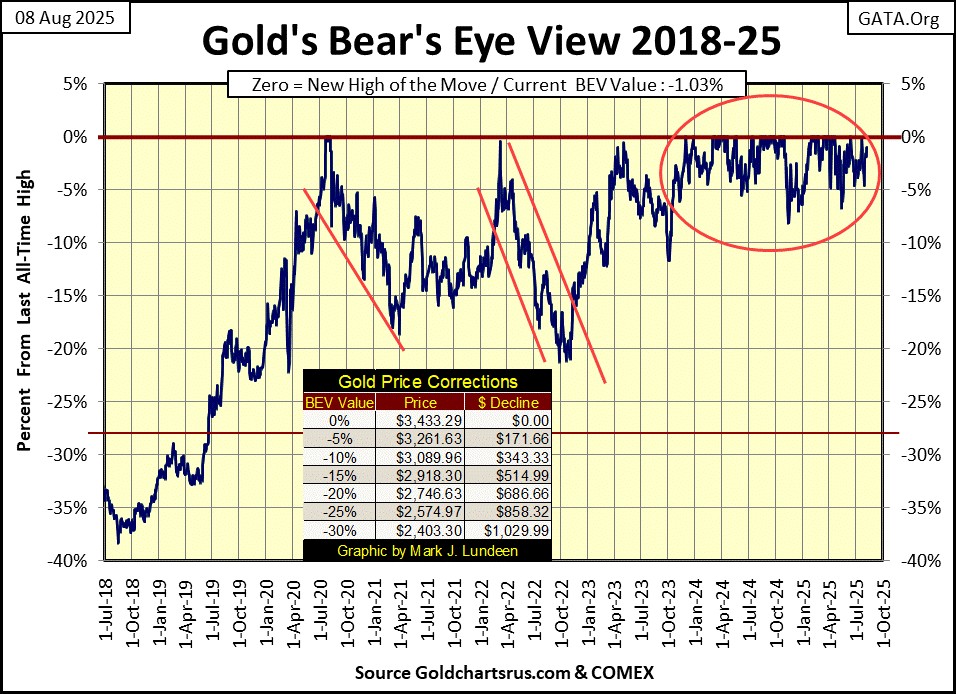
Gold this week closed only 1.03% away from making a new BEV Zero (0.0% = new all-time high) in its BEV chart below. I’m hopeful in the weeks to come, we’ll see gold do some amazing things.
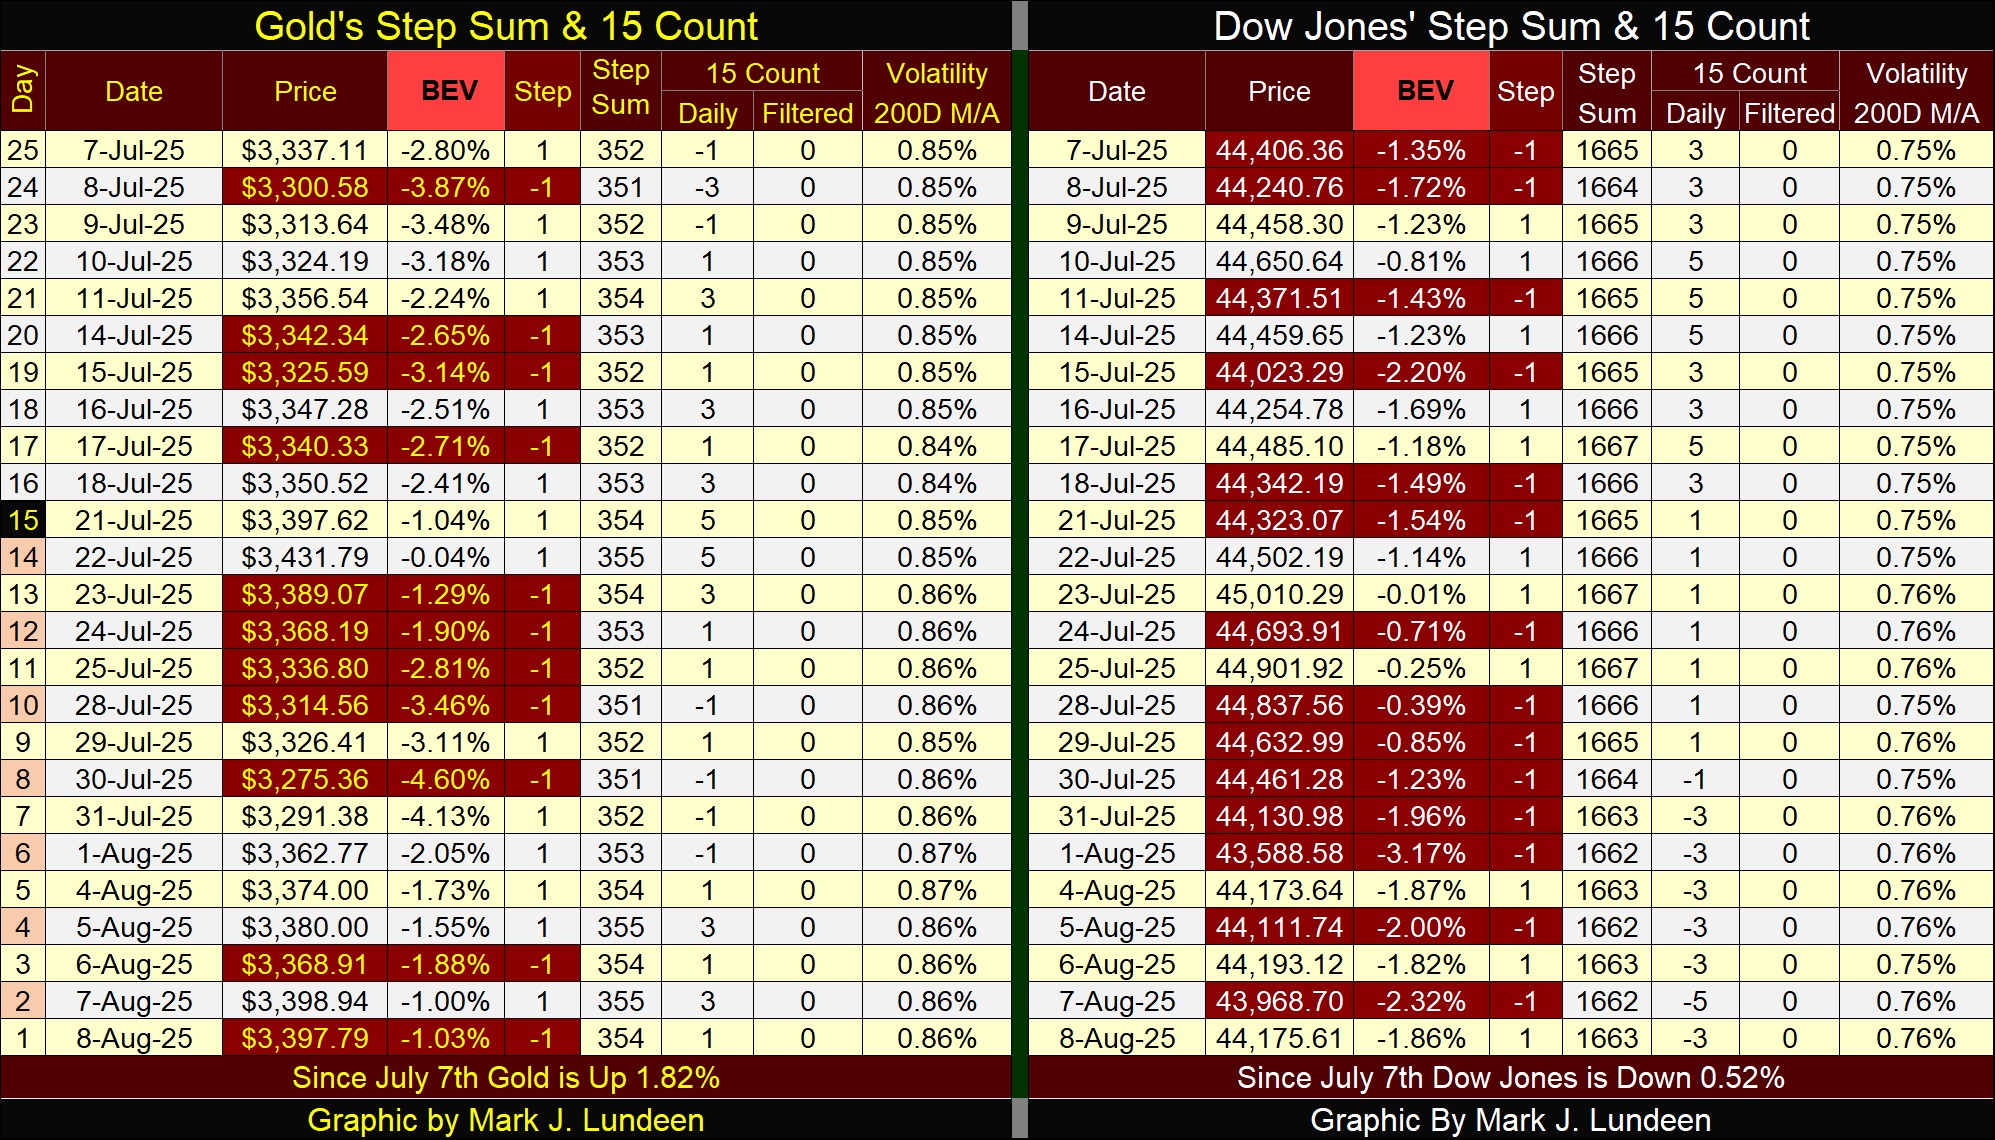
In gold’s and the Dow Jones’ step sum tables below, both are looking very good. What they will look like next week is the big question, a question I’ll be better able to answer next week. So, for this week, I’m going to leave it at that.
Mark J. Lundeen
*******


