Market Update Late July 2012


Well the dog and pony show Wall Street calls "the stock market" ended up for the week. However, once again, it developed a bout of acrophobia just as it was a few points shy of 13,000 (or a BEV -8.22% in the blue plot below). It would only take one good day in the market to clear 13,000. Dow Jones frequently saw such strong days in 1999 and 2007. But in 2012, grand pa just doesn't have it in him to get, and stay above 13,000, or hasn't yet anyways.
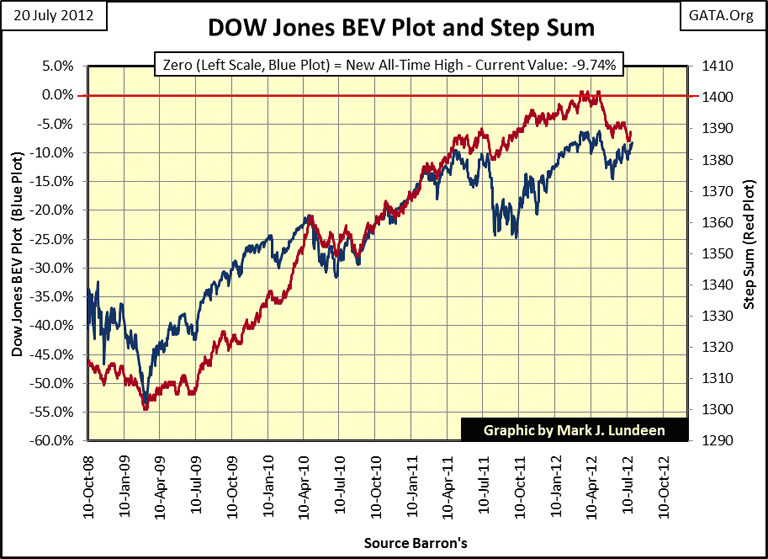
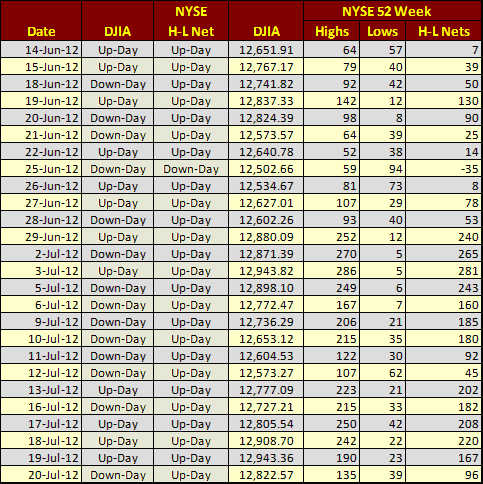
This is strange, as we can see below that the NYSE's 52Wk Highs and Lows have been very supportive of higher Dow Jones valuations. Since June 14th there has been only one trading session at the NYSE that didn't see more 52Wk Highs than Lows. With a tailwind like that, one would have thought the Dow Jones would have cleared 13,000 by now. But it hasn't, and I don't believe it will.
My reasoning is that today, all prices in the financial markets are fixed by "policy decisions" for the benefit of the "policy makers." A 13,000 Dow Jones will create expectations of Dow Jones 14,000, and then a new all-time high for the venerable Dow Jones. This is poor "policy" in the current-financial environment. After two scandalous decades where the big global banks have had their way with Earth's population, the dopes have finally woken up to the fact that something is very wrong with the financial markets. So, if no one is squawking for a new all-time high in the Dow Jones, I believe that "policy" will keep the Dow Jones below 13,000 to keep expectations low.
And by the way, what's the big deal with the LIBOR scandal? Sure, it was a derivatives scam that bilked a few hundreds of billions from a trusting public, but that isn't news. The world has known about Wall Street and its derivatives for a long time. What the financial operators in the big banks did with LIBOR is only something they have done many times before, to victims the media and the government regulators have chosen to ignore for over a decade.
Bill Murphy and Chris Powell of GATA have documented the misdeeds of Wall Street since 1998. GATA has invited members of the media to its events held in South Africa, the Yukon, and in London, events that were attended by officials from Russia and other countries who are now buying gold for monetary reserves. If this is "news" to you, it's because the financial media was deliberately "MIA" missing in action, as they have chosen to report financial disasters, rather than to inform the public of current wrong doings to prevent them. The Madoff Ponzi scheme for example.
This LIBOR scandal will prove to be small potatoes compared to the pending gold leasing scandal. Former US Treasury Secretary Robert Rubin's gift to finance when he was at Goldman Sachs, was to convince the global central banking cartel that gold held as monetary reserves was a "dead asset." Why not lease your central bank's gold to Goldman at 1% a year, who will give you a paper IOU (nothing), and let Goldman sell your national treasure at a loss? No wonder Rubin was on the short list for the top spot at the US Treasury for the Clinton administration. And the gold at Fort Knox? Long gone, or belongs to someone else! Not that anyone cares - yet.
If there is one thing the past two decades have proven, losing big money for Wall Street's clients makes even bigger money for Wall Street and their criminal derivatives operations, with everything happening overseen (covered up?) by "OUR GOVERNMENT REGULATORS." And there is no shortage of members of the American Bar Association (ABA) to assist Wall Street in looting the public by making everything nice and legal.
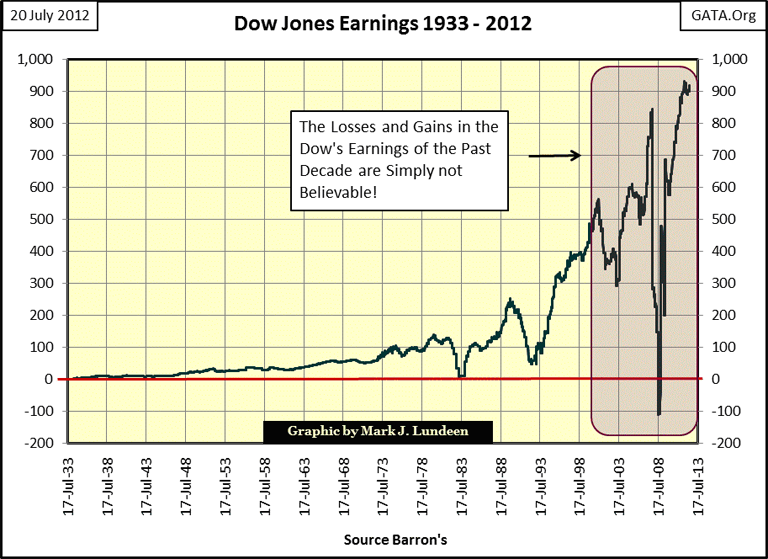
But I was talking about the Dow Jones. So let's look at something really weird, the earnings for the Dow Jones since 2000.
The Dow Jones Industrials Average contains thirty prestigious American corporations that are publically traded. These are established firms who know their business. So, how can the earnings for the Dow Jones during the 2008-09 credit crisis drop like a rock into negative values, for the first time since 1932, and then rise up again to new all-time highs only a few years later? Simple, on the best advice of their investment banker's representative on their corporate board, these companies' balance sheets became heavily laden with derivatives sold to them by their investment banker. How else could these earnings just disappear one quarter, to only go on to new all-time highs just a few years later during a continuing economic recession? There is something very wrong here! So why even follow breaking earnings new on CNBC? It's a joke, but one that only accountants could follow!
Expect a reprise performance for the Dow Jones' earning in the next "crisis", and don't expect the Dow Jones' low of March 9, 2009 to hold when it happens.
Enough of this! Let's end on a positive note and look at gold and silver. And how is gold and silver doing in the latter part of July 2012? They could be doing better, but all in all, gold and its step sum looks constructive. Like silver, gold's price trend (blue plot below) has been under pressure since last year, while its step sum (red plot) has refused to break down in a proper fashion, along with the price of gold for a very long time. But this week, gold's step sum (market sentiment) tested its lows of two months ago. What I want to see now in the gold market is more down days than up (and you do too). That's how we get a step sum to collapse. So how can gold rise up with so many down days? Simple, on the up days, the price of gold goes up much more than it declines on the down days. This is exactly what happens in a bull box, and since June 15, that is exactly what is happening in the gold market.
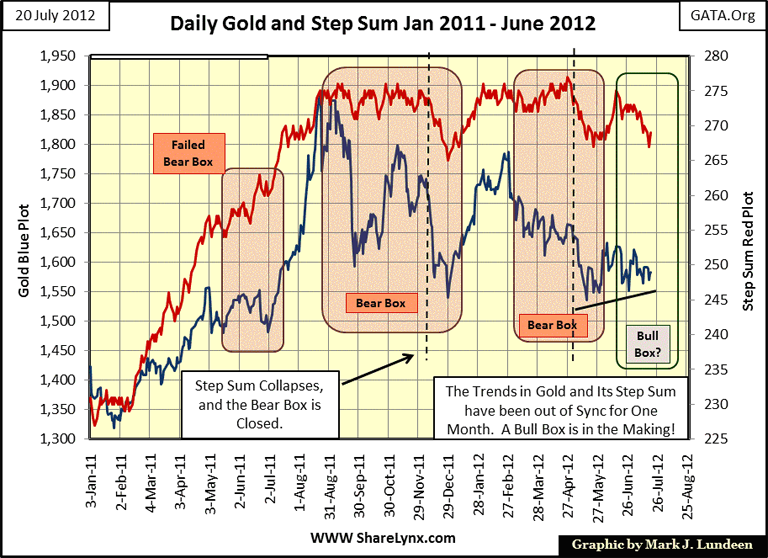
I placed a rectangle around gold's price and step sum trends for the past month, but note I didn't color it green, and have a "?" in the bull box text box. Why did I do that? Because I don't trust a box formation until it has lasted for at least two months. And besides, I can't actually visualize the beginning of a step sum box until a few weeks after it's started, and even then it might fail as we see in the May-July 2011 failed bear box in the chart.
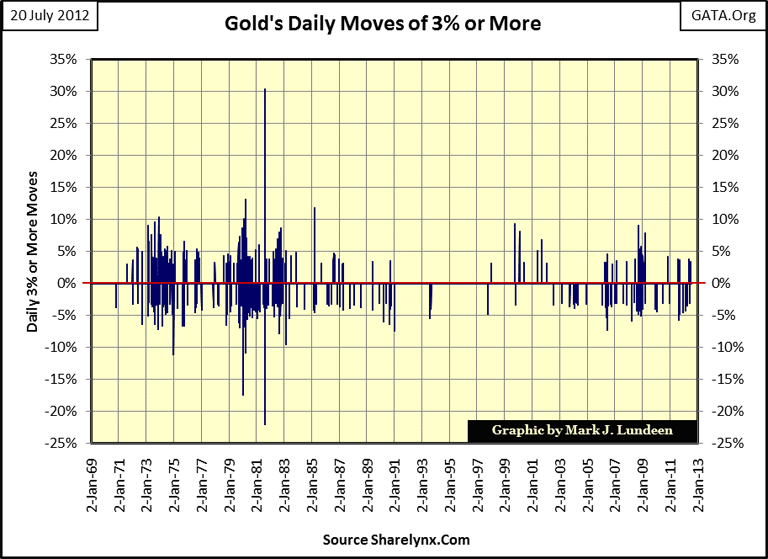
However, the world's financial markets are really a mess, and people someday are going to figure out that gold and silver are the solution to their problem. So, I expect something really spectacular to the upside coming for the price of gold and silver. I don't know the timing; could be next week, or next year. But every day I look at the chart above, expecting a historic resolution to the bull box forming. What am I expecting to happen to the price of gold? Breaking the one day gain of 30.36% on 11 August 1981 (seen in the chart below). It's not impossible. Okay, so what if August 1981 was during the second year of the 1980-2001 bear market, I can dream, can't I?
The silver chart is getting humorous, still I like it. Unlike gold, silver's step sum has collapsed (many more down days than up) since early June, but with little effect to the price of silver. I'm real tempted to place a prospective bull box over silver's price and step sum trend. It's been a month now that the price of silver has refused to go down with its step sum. But then for the past two weeks its step sum has also gone neutral.
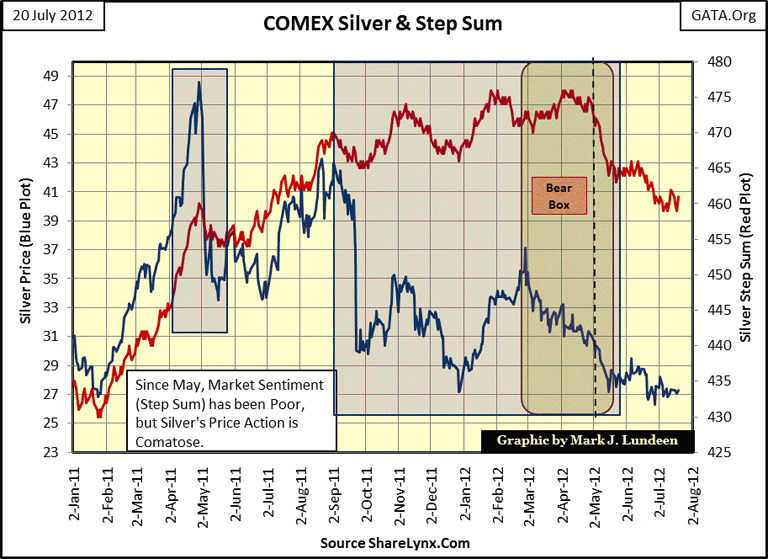
After a second thought, I think that silver currently * is not * forming a step sum bull box. But that is alright, because silver too could explode out if its four week trading range without notice. Mind you, as always, no promises on my part for short term price events, good or bad, but I think the lows for silver are in.
So what is happening with the Silver to Gold Ratio (SGR)? The SGR is having difficulty breaking above 60 ounces of silver to one ounce of gold. This is good, as a rising trend in the SGR is a bear market event; bull markets for precious metals see declining trends in the SGR. The current breakout above 40 in the SGR began in April 2011, and is just a correction in a continuing bull market for gold and silver. So far, the ratio has peaked at 58. When the bull market in gold and silver resumes, we will see the GSR reverse, and once again begin trending downwards.
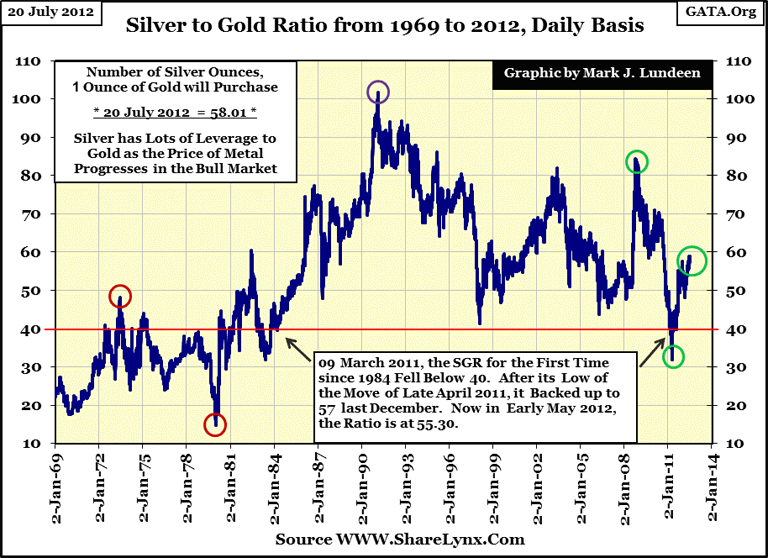
With the SGR at 58, silver has a lot of upward leverage to the price of gold when the bull market resumes. This is a good time to buy silver!
With the LIBOR scandal now breaking into the open, the world is finally paying attention to what has been happening for a * very long time. * Expect the investigation of the mechanics of the LIBOR manipulations to provide leads to many other scandals. As has happened so many times during hundreds of years of market history, deflating financial assets will once again drive wealth towards gold and silver for its survival. We are close to seeing market history being made - and you won't get any enjoyment from living in these historic times if you don't have some actual gold and silver in your personal portfolio.
Mark J. Lundeen
[email protected]
[email protected]


