Mayday: The Gold Juggernaut Is Seriously Taking On Water


Last April, while discussing the boomerang question about the trigger that is needed for gold to decline, we emphasized that gold can decline on… absolutely nothing. It’s imperative to keep watching the signs and determine when the market is really ready to move. There’s a lot of calculations, trading techniques etc. behind all that, but it does all really come down to it. Now, there are many definitions of “nothing”, but surprisingly none of them mentions “0.09 move in the USD Index”. That’s something that should to be updated and we’re waiting for the Merriam-Webster editors’ reply to our request. Seriously though, USD’s meager rally was really next to nothing and both: gold and gold stocks declined and broke below their support lines nonetheless, just like we’ve been expecting them to. And that happened shortly after they both failed to rally substantially on the Fed’s dovish shocker. Before gold declined a few days ago, we wrote that the easy part of the rally was over, and that it might be a good idea to close all the remaining long positions. The good news is that the easy part of the decline has just begun.
The Straw That Broke Gold’s Back
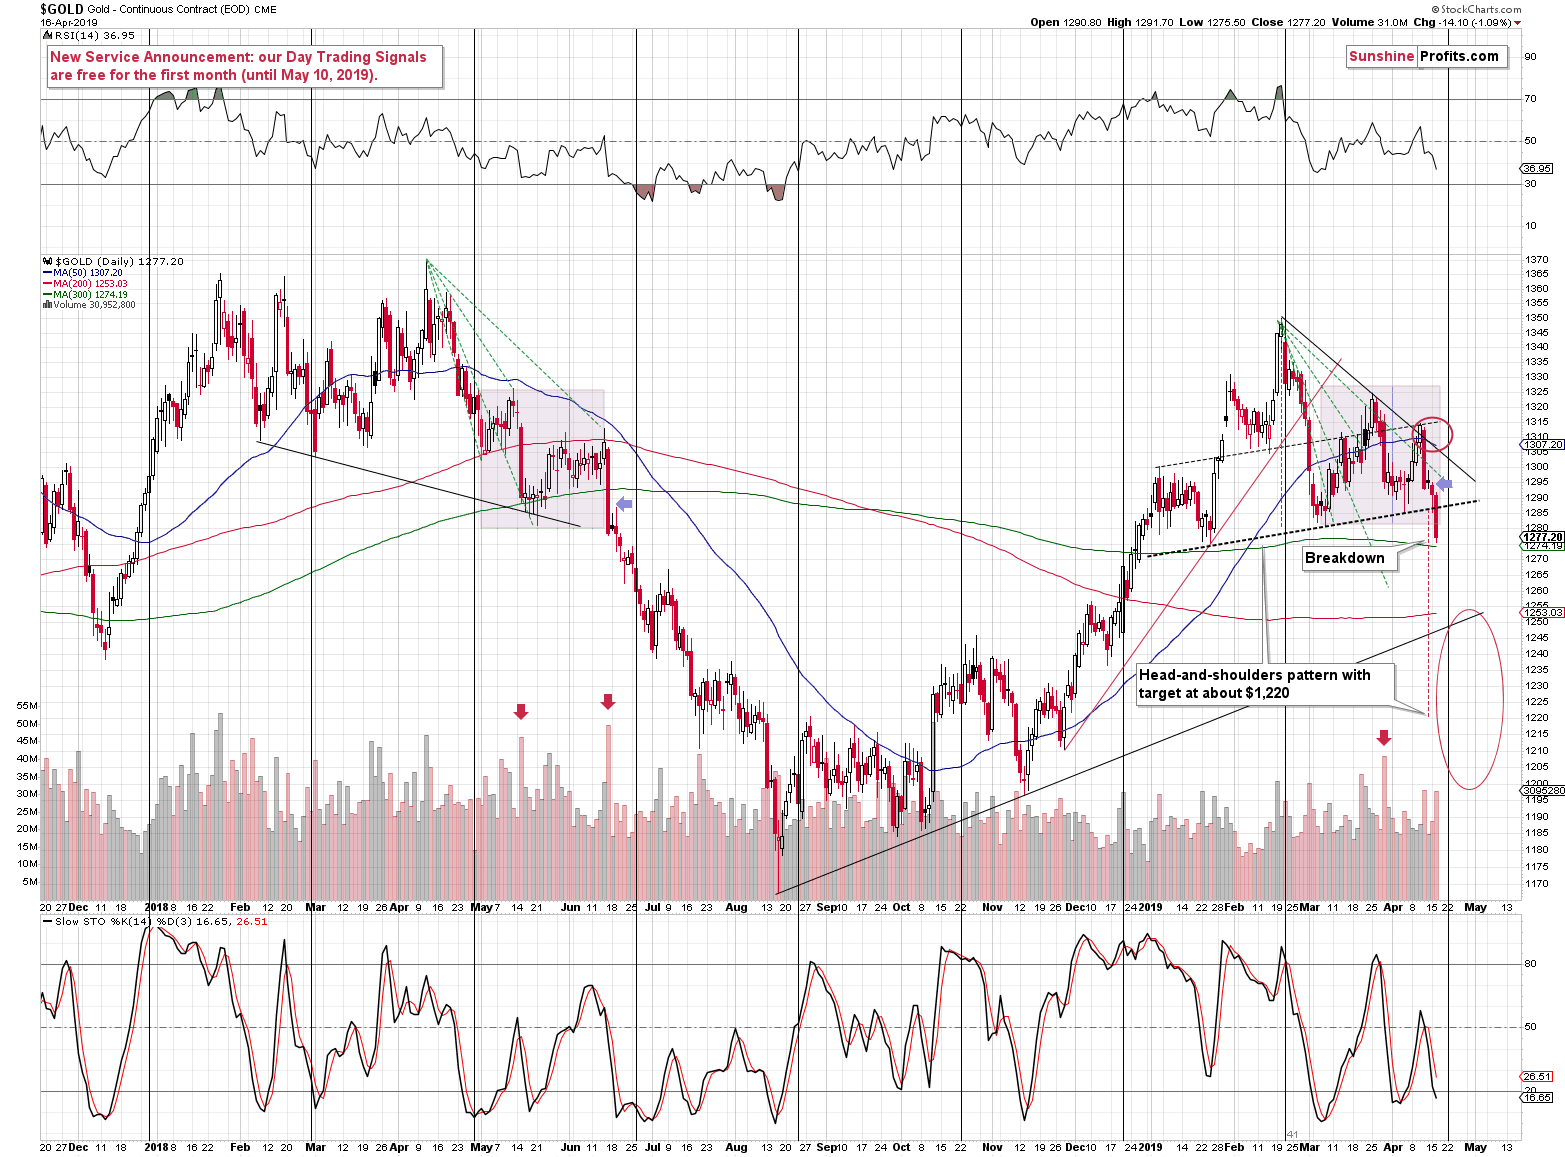
The analogy that we discussed on Friday
The second analogy is to the mid-2018 decline. The decline accelerated once it broke below the nearest support line and the previous lows. In 2018, it happened in June. We are not yet at this stage, but we are very close. We marked the similar days with blue arrows.
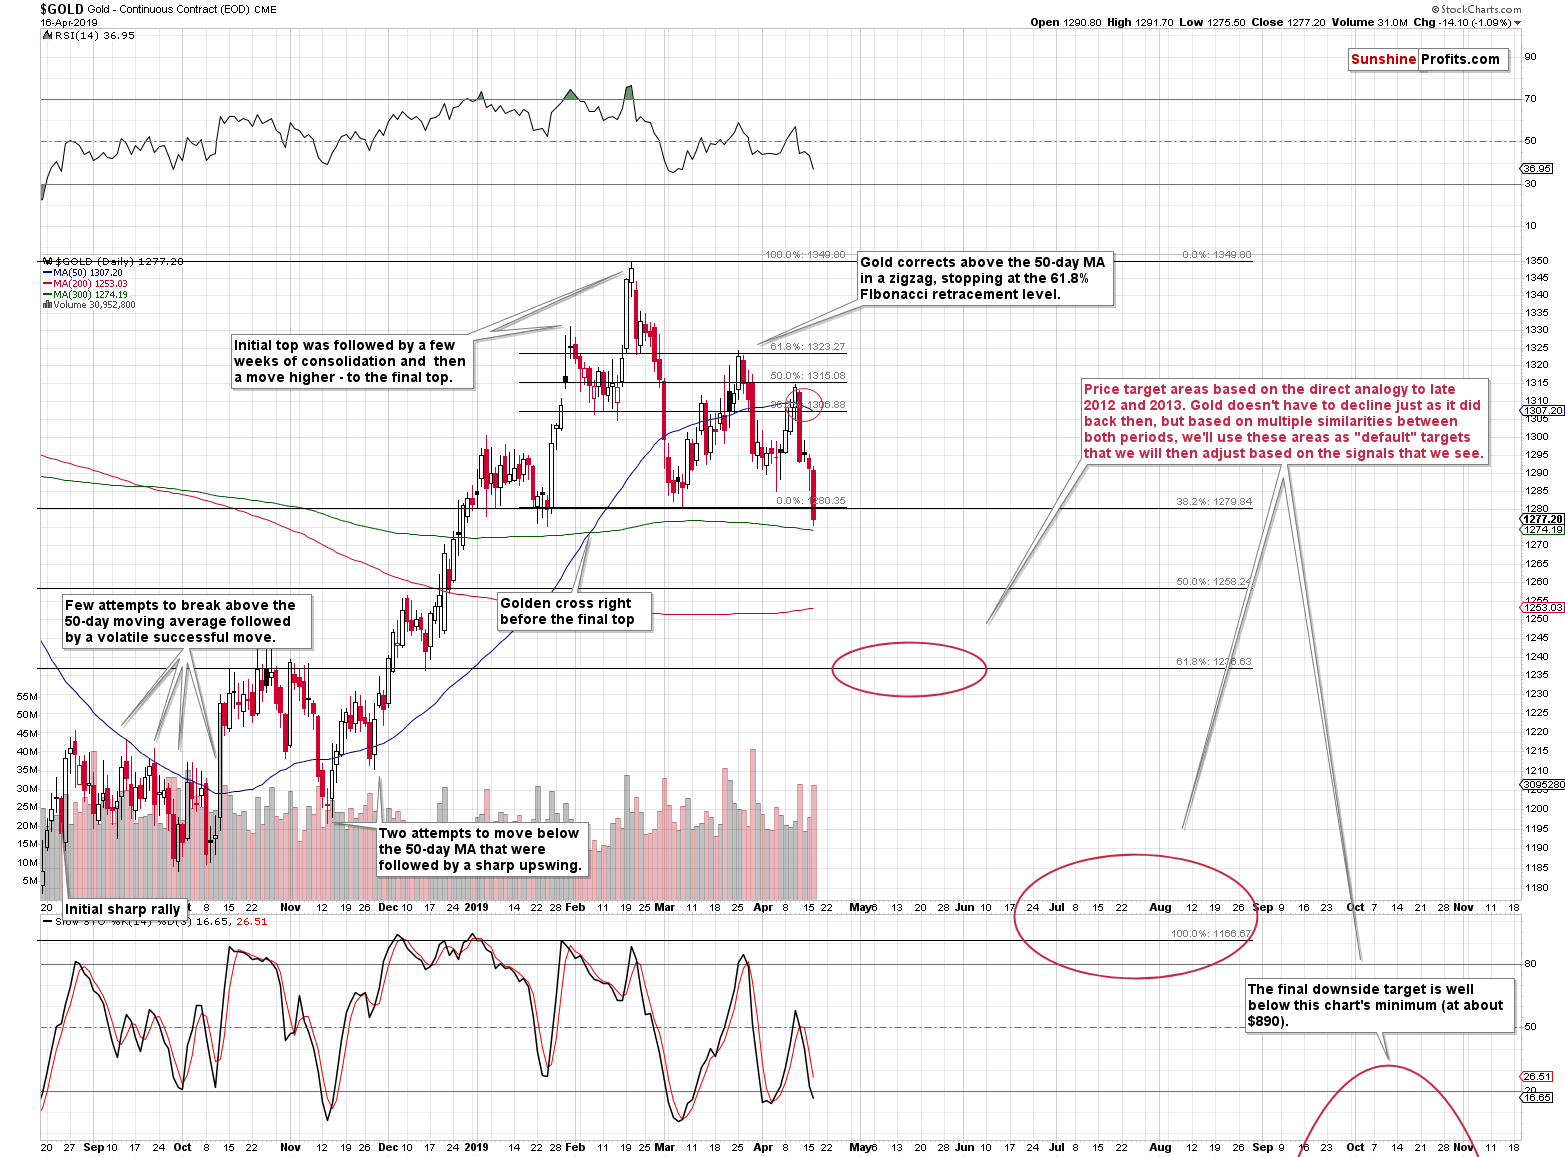
Based on the above analogy, we can expect gold to slide until it reaches the previous important bottom. The nearest important bottom is at about $1,200 (formed in November 2018). There are also two smaller bottoms that might also trigger a temporary reversal: the late-November bottom at about $1,210 and the mid-December bottom at about $1,236. The latter is very close to the previously mentioned 61.8% Fibonacci retracement, which gives it more credibility than the remaining levels.
There’s also the head-and-shoulders formation that will come into play once gold breaks below the neck level. It’s relatively close – at about $1,285, so gold would need to decline by only $8 from yesterday’s close to reach it. The target based on this formation is created by applying the size of the “head” to the moment and price of the breakdown. This technique points to $1,220 as the likely target for gold.
Of course, there’s also the rising support line that’s based on the August and November 2018 lows and it points to $1,250 as the likely near-term target.
Reserved for our subscribers, the full version of the above analysis pinpoints specific targets such as the one for gold. This week, we supplemented the above with a note that the daily June 2018 decline was followed by a small pause, so the recent pause was nothing bullish (even though we saw a bullish reversal on Monday). Based on yesterday’s slide and the breakdown below the neck level of the above-mentioned head-and-shoulders formation in gold, it’s clear that the analogy remains intact. Back in 2018, that was the moment when the decline started to accelerate, so this seems quite likely also this time.
Naturally, the breakdown below the head-and-shoulders pattern is not yet confirmed, but given what kind of (in)action triggered it, it’s very likely that it will be confirmed shortly.
The above quote starts by stating that the above is a “second analogy”, so you’d likely be interested in the first analogy as well. Here you go.
The first analogy is to the decline’s shape in 2012 and 2013.
Lessons from 2012 and 2013
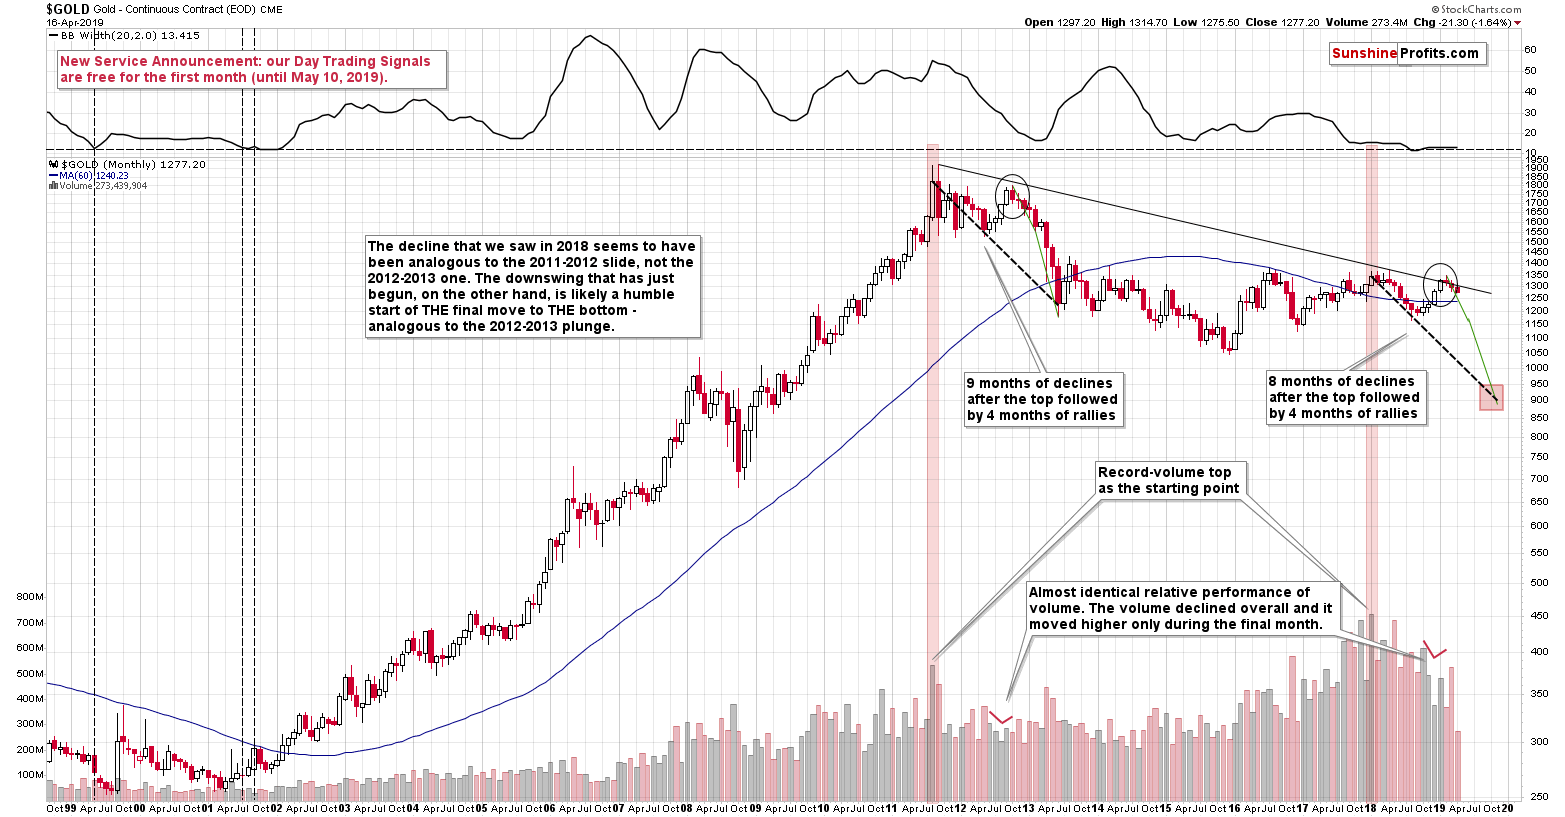
There are multiple reasons as to why the current situation is similar to the one in 2012 and 2013 and some of them are present on the above chart. Other confirmations come from other markets. But we don’t want to get into details here as that’s not the point to make. What we want to emphasize is that the similarity exists also on a short-term basis and it’s quite remarkable.
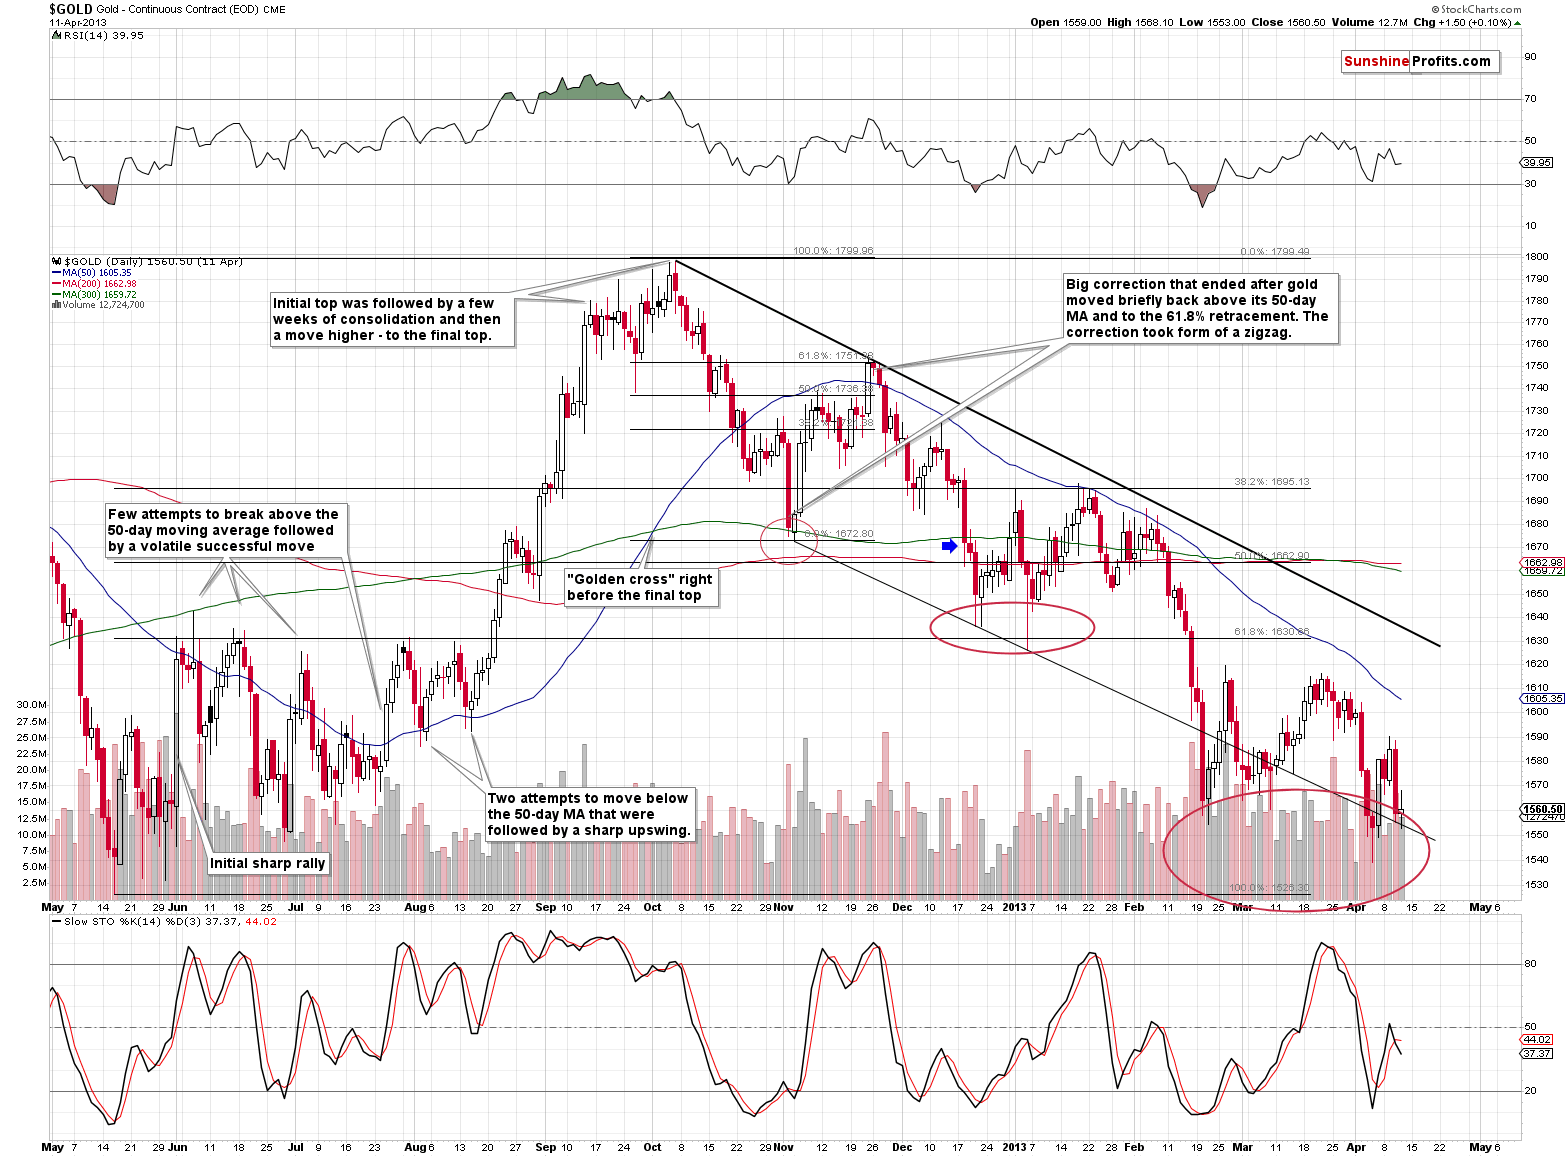
It was this analogy that helped us direct the top in gold in late March and it was also the thing that contributed to us predicting gold’s corrective upswing earlier this month. In other words, it’s very useful.
In line with the previous chart, we added a blue arrow on the 2012 chart as a “you are here” note. At first sight, the implication might be that the decline is coming to an end because back in 2012, when gold moved below its recent lows, it kept on declining for just a few more days and formed the initial bottom relatively close. This may not be the correct impression, though.
The analogies can work in terms of price or time, or both. They can also work in absolute terms and in relative terms. Starting with the former, we see that the analogy works only approximately well in terms of time and we see that the next short-term bottom was rather broad. Yes, the initial bottom formed shortly, but then gold moved back and forth for about 2 weeks and the final near-term bottom formed in early January 2013. Consequently, gold may have more time to decline this time than it seems at the first sight.
As far as price levels are concerned, we see that they are quite precise, but this is the case in relative terms, not in absolute ones. And in relative terms, in late 2012 and early 2013, gold kept on declining until it moved close to the 61.8% Fibonacci retracement level based on the preceding rally. This level also corresponded to the previous local highs. The analogous price level that we have this time is at about $1,240. What is truly remarkable is that this time the 61.8% Fibonacci retracement also corresponds to the previous local highs. This striking similarity adds to the analogy’s credibility. Analogy is a form of self-similarity: it’s a pattern. In other words, yet again, it’s very useful.
Combining both provides us with a scenario in which gold doesn’t bottom almost right away, but instead declines in a more meaningful manner.
Consequently, even if gold moves back and forth here (possibly creating opportunities - by the way, we recently launched a brand new service: Day Trading Signals. If there’s one thing that you’ll check on our website today, make sure it’s their performance), it will unlikely mark the end of the decline. And that’s only based on factors that we see in gold alone. Let’s take a look at one of gold’s key drivers.
Happy USDX Bottom Anniversary!
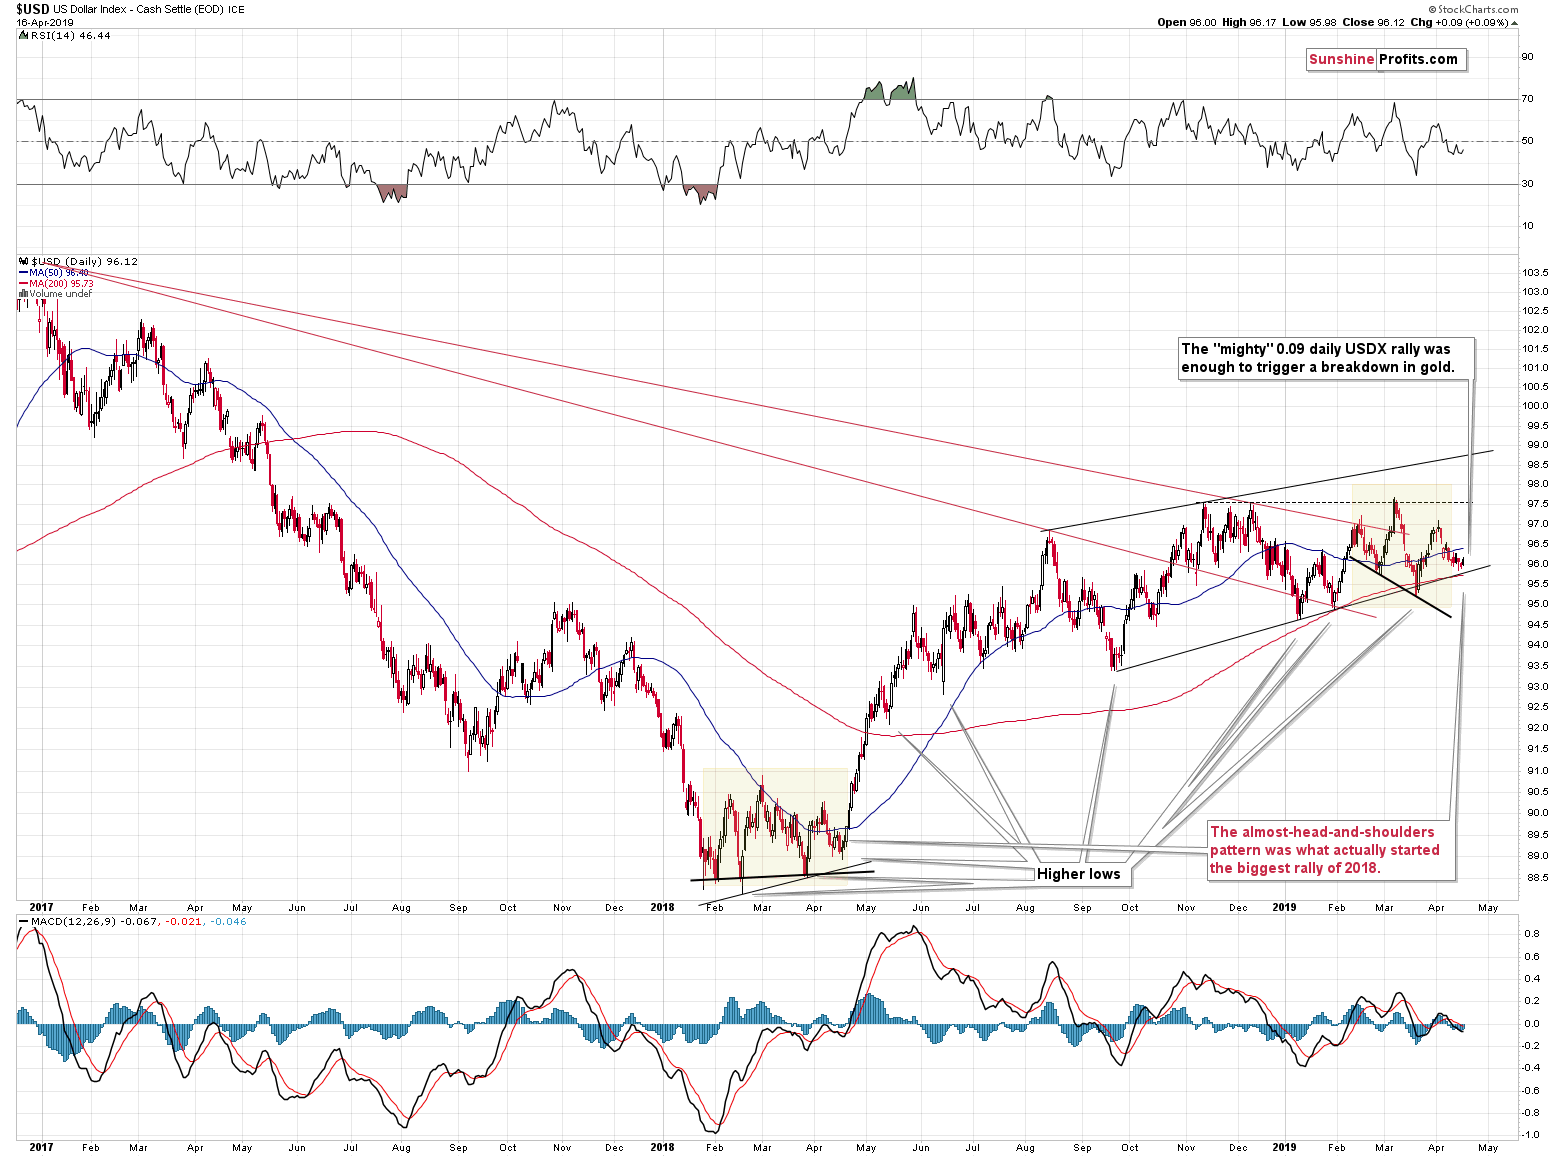
As we wrote earlier today, the USD Index has barely done anything, and the strength of gold’s reaction confirmed where it really wants to move – lower.
But there is one additional thing that is important here as well. It’s the fact that the USDX seems to have bottomed or is extremely close to bottoming. The index closed the day a bit higher, and it was the second day in a row where there was no new intraday low. This is a bullish indication, and given the proximity of the rising medium-term support line, the bottom is likely already in.
Bottoms are likely to form once the price reaches the support and this may very well be the case also here. If it were an ordinary situation, the USDX would be likely to first decline to 95.75 before rallying. However, the current situation is not ordinary. It’s similar to the January – April 2008 bottom that looked like an incomplete head-and-shoulders pattern. Back then, the USDX bottomed above its support lines, so something similar might have already happened right now as well.
The bottom that started the most powerful rally of the recent years formed exactly one year ago. If the 1:1 seasonality continues (after all, the USD topped in November and December and formed the first bottom in January in both cases), we’re going to see a massive increase in the value of the USD Index. And yes, the USDX’s reaction to the fundamental picture confirms it. Fed’s dovish shocker was unable to trigger a sustainable decline, which proved a great strength of the US currency.
Needless to say, with rallying US dollar, and based on many other reasons, gold is very likely to dive. You have been warned.
The full version of the above analysis also includes the precise price targets of the unfolding moves for gold, silver, and GDX. If you’d like to read it and receive follow-ups (including the intraday ones, when things get hot), we invite you to sign up for our free gold mailing list. There are 7 days of access to our premium Gold & Silver Trading Alerts that you’ll get as a starting bonus. Sign up today.
Przemyslaw Radomski, CFA
Editor-in-chief, Gold & Silver Fund Manager
Sunshine Profits - Effective Investments through Diligence and Care
* * * * *
All essays, research and information found above represent analyses and opinions of Przemyslaw Radomski, CFA and Sunshine Profits' associates only. As such, it may prove wrong and be a subject to change without notice. Opinions and analyses were based on data available to authors of respective essays at the time of writing. Although the information provided above is based on careful research and sources that are believed to be accurate, Przemyslaw Radomski, CFA and his associates do not guarantee the accuracy or thoroughness of the data or information reported. The opinions published above are neither an offer nor a recommendation to purchase or sell any securities. Mr. Radomski is not a Registered Securities Advisor. By reading Przemyslaw Radomski's, CFA reports you fully agree that he will not be held responsible or liable for any decisions you make regarding any information provided in these reports. Investing, trading and speculation in any financial markets may involve high risk of loss. Przemyslaw Radomski, CFA, Sunshine Profits' employees and affiliates as well as members of their families may have a short or long position in any securities, including those mentioned in any of the reports or essays, and may make additional purchases and/or sales of those securities without notice.
 Przemyslaw Radomski, CFA, is the founder, owner and the main editor of SunshineProfits.com. You can reach Przemyslaw at: http://www.sunshineprofits.com/help/contact-us/.


