Metals And The US Dollar – How It All Relates (Part II)


This research post continues our effort to keep investors aware of the risks and shifting capital opportunities that are currently taking place in the global markets. We started in PART I of this article by attempting to highlight how shifting currency valuations have played a very big role in precious metals pricing and how these currency shifts may ultimately result in various risk factors going forward with regards to market volatility.
Simply put, currency pricing pressures are likely to isolate many foreign markets from investment activities as consumers, institutions and central governments may need more capital to support localized economies and policies while precious metals continue to get more and more expensive.
One of the primary reasons for this shift in the markets is the strength of the US Dollar and the US Stock Market (as well as the strength in other mature economies). The capital shift that began to take place in 2013-2014 was a shift away from risk and towards safer, more mature economic sources. This shift continues today – in an even more heightened environment. The volatility we are seeing in the US and foreign markets is related to this shift taking place as well as the currency valuation changes that continue to rattle the global markets.
US Dollar Index Weekly Chart
It is our opinion that, at some point, the support levels in foreign markets may collapse while the US and major mature global economies become safe-havens for assets. When this happens, we'll see the US Dollar rally even further which will push many foreign currencies into further despair. The overall strength of the US Dollar is being supported by this continued capital shift and the way that global assets are seeking safety and security. The same thing is happening in precious metals.
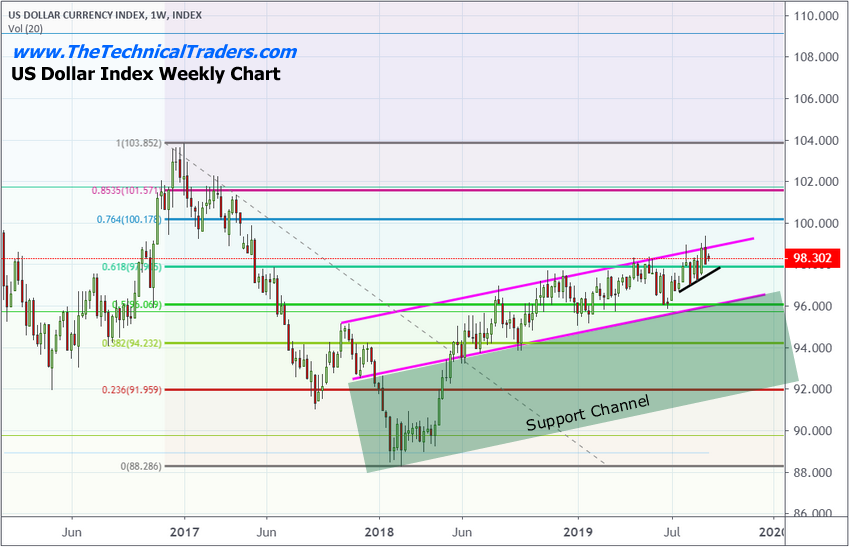
We believe the current setup in the US markets is indicative of a breakout/breakdown FLAG/Pennant formation. We believe this current setup should prompt a very volatile price swing in the markets over the next 3 to 6+ months which may become the start of a broader event playing out in the foreign markets. How this relates to precious metals is simply – more fear, more greed, more uncertainty equals a very strong rally in precious metals over the next 12+ months.
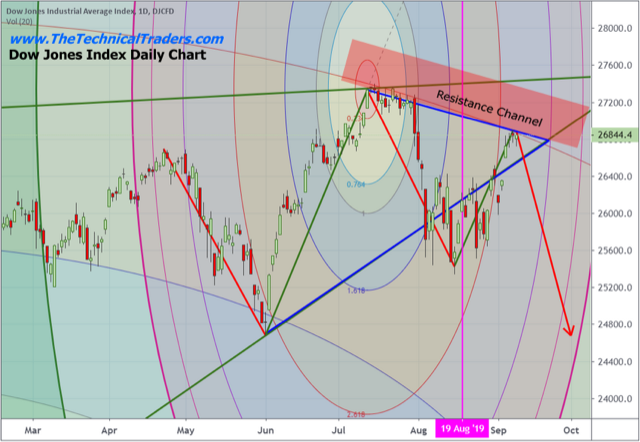
Dow Jones Index Chart
This Dow Jones chart highlights what we believe is a very strong Resistance Channel that needs to be broken if the US stock market is going to attempt to push higher in the future. You can also see the BLUE lines we've drawn on this chart that sets up the FLAG/Pennant formation. Although price broke through the lows of the FLAG/Pennant formation, we still consider it valid because it confirms on other US major indexes. Should the Dow Jones fail to move above the previous price high, near early July 2019, then we believe the Resistance Channel will reject price near current levels and force it lower (filling a recent gap and targeting the $25,500 level or lower).
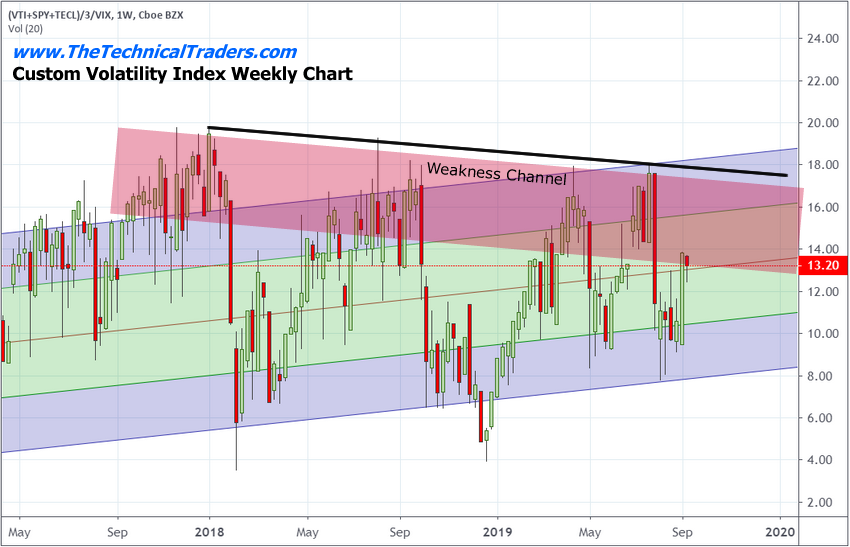
Custom Volatility Index Chart
Our Custom Volatility Index chart shows a similar type of setup. Price weakness is evident near the upper channel level of this chart. This chart is very helpful for our research team because it puts price peaks and troughs into perspective within a “channeling-type” of rotating range. You can see that previous major price peaks have always settled above 16 or 17 on this chart. And previous major price bottoms have always settled below 7 or 8 on this chart. The current price volatility level is just above 13 – just entering the weakness zone in an uptrend. If price were to fail near this level, a move toward 8 would not be out of the question. We just have to watch and see how price reacts over the next few weeks to determine if these weakness channels will push price lower.
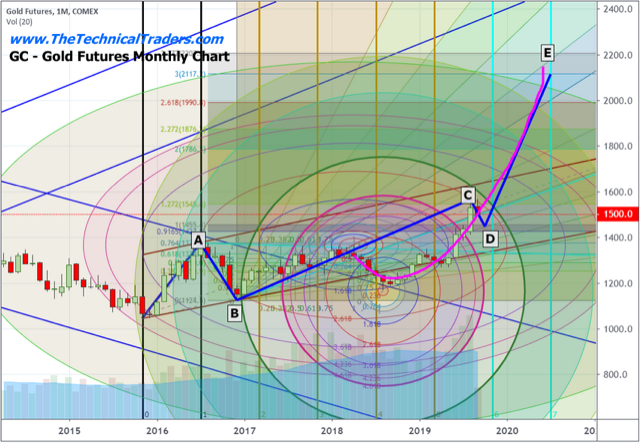
Gold Monthly Chart
If our research is correct, the entire move higher in precious metals, originating near the bottom in December 2015, is a complex wave formation setting up a WAVE 1 upside move. This complex wave formation is likely to consist of a total of 5 price waves (as you can see from the chart below) and will likely end with Gold trading well above the $2000 price level near or before June 2020.
If this analysis is correct, we are about to enter a very big, volatile and potentially violent price move in the global markets that could rip your face off if you are not prepared.
CONCLUDING THOUGHTS
This BEAST of a market is about to explode as we've highlighted by this research and these charts. It may start ripping our faces off in less than 30 days or it could take longer. One thing is for sure, the global markets are set up for something big and precious metals are beating our foreheads saying “hey, look over here!! This is where risk is trailing into as the markets continue to set up for this volatile price move!!”.
If you are not ready for this move, then we suggest you visit www.TheTechnicalTraders.com to learn how we can help you stay ahead of these big swings in the markets.
As a technical analysis and trader since 1997, I have been through a few bull/bear market cycles. I believe I have a good pulse on the market and timing key turning points for both short-term swing trading and long-term investment capital. The opportunities are massive/life-changing if handled properly.
I have had a series of great trades this month. In fact, over the past 20 months, my trading newsletter portfolio has generated over 100% return when compounded for members. And we locking in more profits on Tuesday with the Russell 2000 index. So, if you believe in technical analysis, then this is the newsletter and market condition for you to really shine.
Be prepared for these price swings before they happen and learn how you can identify and trade these fantastic trading opportunities in 2019, 2020, and beyond with our Wealth Building & Global Financial Reset Newsletter.
Join me with a 1 or 2-year subscription to lock in the lowest rate possible and ride my coattails as I navigate these financial market and build wealth while others lose nearly everything they own during the next financial crisis.
I can tell you that huge moves are about to start unfolding not only in currencies, metals, or stocks but globally and some of these supercycles are going to last years. A gentleman by the name of Brad Matheny goes into great detail with his simple to understand charts and guide about this. His financial market research is one of a kind and a real eye-opener. 2020 Cycles – The Greatest Opportunity Of Your Lifetime
FREE GOLD OR SILVER WITH SUBSCRIPTION!
********

Chris Vermeulen has been involved in the markets since 1997 and is the founder of Technical Traders Ltd. He is an internationally recognized technical analyst, trader, and is the author of the book: 7 Steps to Win With Logic
Through years of research, trading and helping individual traders around the world. He learned that many traders have great trading ideas, but they lack one thing, they struggle to execute trades in a systematic way for consistent results. Chris helps educate traders with a three-hour video course that can change your trading results for the better.
His mission is to help his clients boost their trading performance while reducing market exposure and portfolio volatility.
He is a regular speaker on HoweStreet.com, and the FinancialSurvivorNetwork radio shows. Chris was also featured on the cover of AmalgaTrader Magazine, and contributes articles to several financial hubs like MoneyShow.com.


