Metals ETFs Signal Upcoming Reversals In Gold Prices
 share
share
 share
share
 share
share
 share
share
 share
share
Gold prices may be in the process of reversing prior downtrends, as persistent trade war concerns have brought about a renewed safe-haven status for the precious metals complex. This year, most financial news headlines have centered on the record highs which have been notched in the equities benchmarks. However, over-extended valuations in stocks and declining expectations for corporate earnings suggest that the market is likely focusing its attention in the wrong areas.
Recent news of Theresa May’s decision to leave her post as U.K. Prime Minister could exacerbate Brexit fears and raise the level of geopolitical uncertainty currently influencing trader sentiment. Fundamental catalysts have been confirmed by emerging trends characterized by exchange-traded fund flows, which can offer important clues about where sentiment is actually heading in the next several weeks. At this stage, a clear break of $1,288.93 in the underlying spot gold price will target an upward retracement back toward the May 13th highs at $1,303.40.
The flight-to-safety trend has helped the precious metals complex catch a bid. After bouncing from its lows at $1,269.30, gold bulls pushed the yellow metal to its weekly highs while U.S. stocks fell out of favor and began moving in the opposite direction. The Dow Jones Industrial Average has now posted declines for five-straight weeks and the benchmark is in the midst of its longest weekly losing streak since 2011:
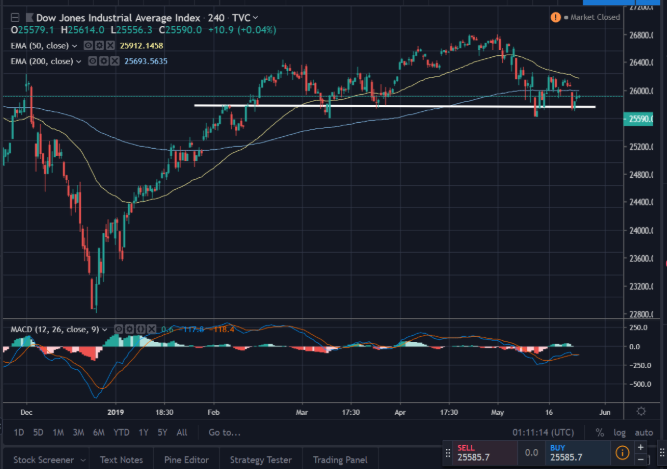
The struggling Dow is making a valiant attempt to hold onto important support levels. But we have already broken both the 50-day and 200-day exponential moving averages. In short, the outlook has grown increasingly negative for the index.
From here, a clear break of historical support levels could send equities bulls running for the exits. In addition to this, a drop in bond yields and broad weaknesses in the U.S. dollar have created a supportive macroeconomic context for further metals rallies. To get a sense of when these trend changes are likely to occur, I think it is important to consider recent market activity which is visible in exchange-traded fund flows. The market’s most commonly watched instrument in this category is the SPDR Gold Trust (NYSEARCA: GLD) and I tend to think this is a good starting point for assessing these trends.
When considering the market effects of precious metals ETFs, the reluctance that is commonly adopted by gold investors is fully understandable. The reality is that many precious metals instruments (such as leveraged and inverse funds) are not actually backed by physical gold or silver and this removes some of their validity as true safe haven assets.
Clearly, there are issues with many of the characteristics of these instruments, which is why most traditional investors tend to focus on the physical metals themselves. My long-time friend and precious metals industry expert Tony Davis of Atlanta Gold & Coin writes an excellent blog covering the history of gold coins which readers might also find interesting when researching these trends in the physical markets.
That said, it is also informative to analyze market activity in popular ETFs because it gives us important trade flow data which helps to define sentiment in other areas of the market. Participants guiding moves in ETFs are often shorter-term investors that might not typically focus on the precious metals themselves. However, their trading decisions can function as leading indicators of emerging trend changes in the precious metals space.
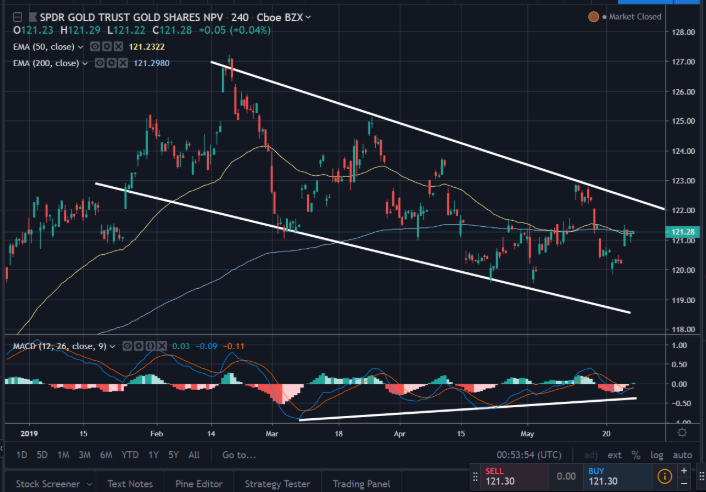
Over the last four weeks, the SPDR Gold Trust ETF has experienced outflows of -$314.5 million and this activity put the fund near the bottom of its category averages for the period. Over the last week, however, market activity has turned positively (with the ETF showing net inflows of $108.5 million). Here, the overall price trends are important because GLD has been caught in a downward channel for this entire trading period.
Not only does this tell us that the bear trend (which began in February) may be reaching a point of conclusion but it also tells us that we could be establishing prime entry points for long positions. Indicator readings support this outlook, as a bullish condition in the MACD has been developing since the first half of March.
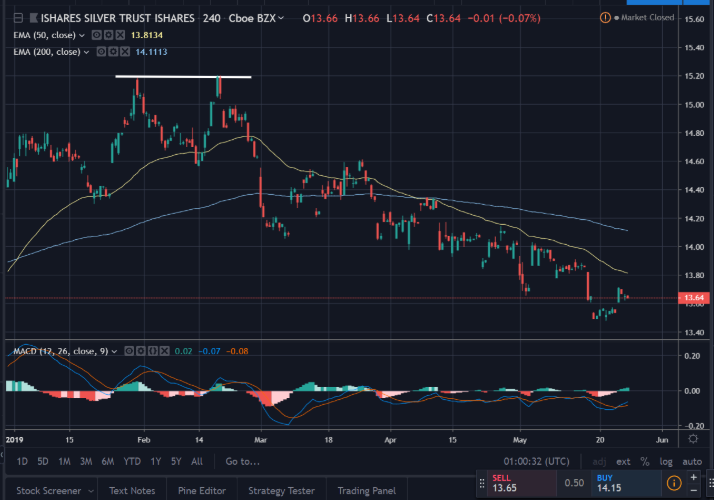
Over slightly longer time horizons, similar trends have become visible in the iShares Silver Trust (NYSEARCA: SLV). After failing at critical medium-term resistance (at $15.20), SLV dropped below its moving averages and continued progressing forward in a steady downtrend.
From a technical perspective, SLV looks to be in much bigger trouble when compared to its GLD counterpart. Momentum readings for SLV are simply not showing the same signs of life that are visible on the GLD daily charts. However, inflow readings for these exchange-traded funds can show us things not visible in the price histories. Over the last 26-week period, SLV is showing net outflows of -$189.1 million. But this bearish trend shows signs of reversal over the most recent 13-week period. Under this time frame, SLV has benefited from inflows of $29.7 million and the reversal has lifted the ETF from the lower end of its category averages.
Ultimately, this flow activity may turn out to the fundamental driver that is needed to pull SLV out of its technical chart weakness (and heavy bearish momentum). A break of the 50-day exponential moving average will suggest the downtrend in SLV has completed and target an initial re-test of $14.50. From a trading perspective, this is the event I will need to see before making the decision to re-enter with long positions in silver-backed assets.
*********
share
share
share
share
share


