Mining Stocks’ Upside Breakout Targets


Gold, Silver and Mining stocks rose sharply last week, and are breaking out above upper boundaries of declining trend-channels which have held prices in their clutches for months. In this article we will focus on Mining stocks, their breakout, and upside potential.
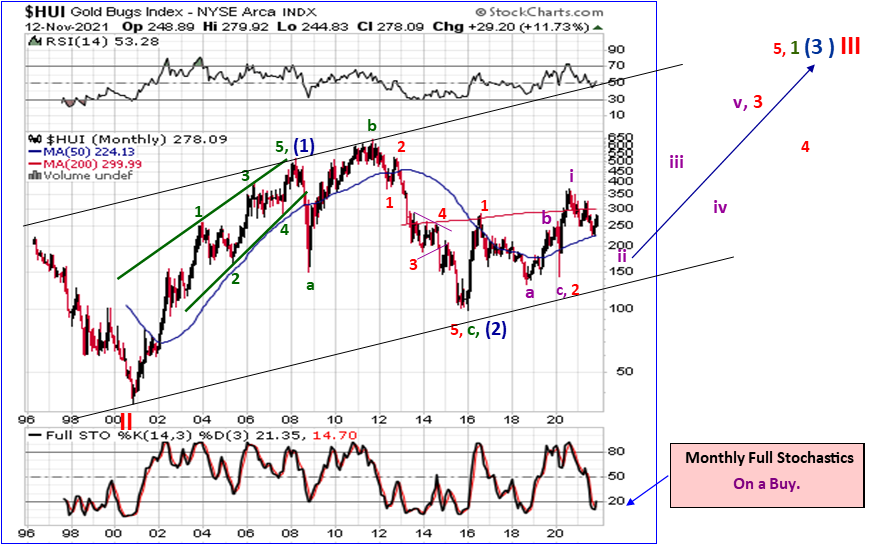
In the above chart we show the long-term trend for Mining stocks as represented by the HUI. The trend is clearly up. The trend-channel boundaries are well defined and have identified Primary trend turns. At this time, Miners are inside their Primary degree wave (3)-up, which started at the beginning of 2016. It is now rising inside minor degree wave 3-up, a subwave within Intermediate degree wave 1, within Primary degree (3). Since wave threes are typically strong, even better for Miners is that they are now starting another smaller degree of trend, wave iii-up. In other words, Miners have the potential for a strong and sustained upside move from here as a bunch of wave threes occur simultaneously. However, there are some resistance hurdles facing Miners, so let’s explore them with the next charts.
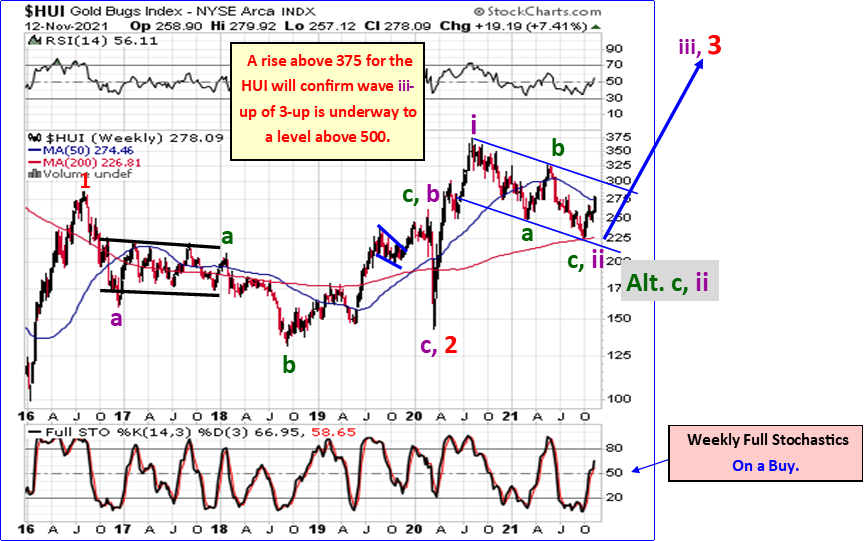
The HUI has been declining inside a well-defined small trend-channel since summer of 2020. The down-up-down progression lower looks to be corrective inside a larger degree rising trend. The upper and lower boundaries for this channel have stopped all declines and rallies for the past year and a half. Precisely. So, this tells us this trend-channel’s boundary lines are important. What this means is for confidence to increase that subwave iii-up has started, the HUI must breakout above the upper boundary of this downtrend channel. In other words, the HUI must rise above 300 for an “all clear” sign for higher prices. It sits close to that level now, so we should soon have clear guidance.
The good news for Mining stocks is that should they rise decisively above 300, up and out of this downward trend-channel, the HUI should be set to rise toward 500 without too much interference. Not all at once, in stairstep fashion for sure, but that would be an upside price target to expect.
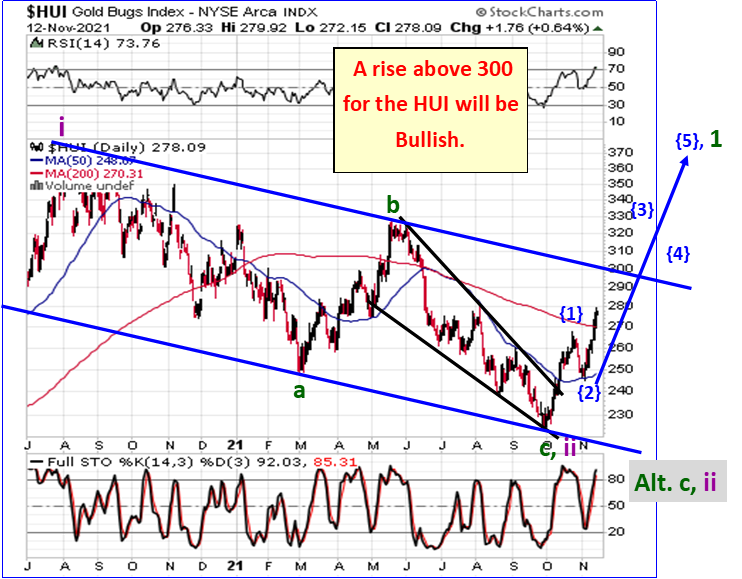
This next chart shown above gives us a close-up look of this declining trend-channel from August 2020, and the Elliott Wave mapping count of where the HUI likely is at this time. It looks to be tracking an even lower degree wave {3} up move. If this is the case, then the odds of surpassing the upper boundary of the declining trend-channel, above 300, are pretty high. Wave {3} should blow past 300 and head for 330ish.
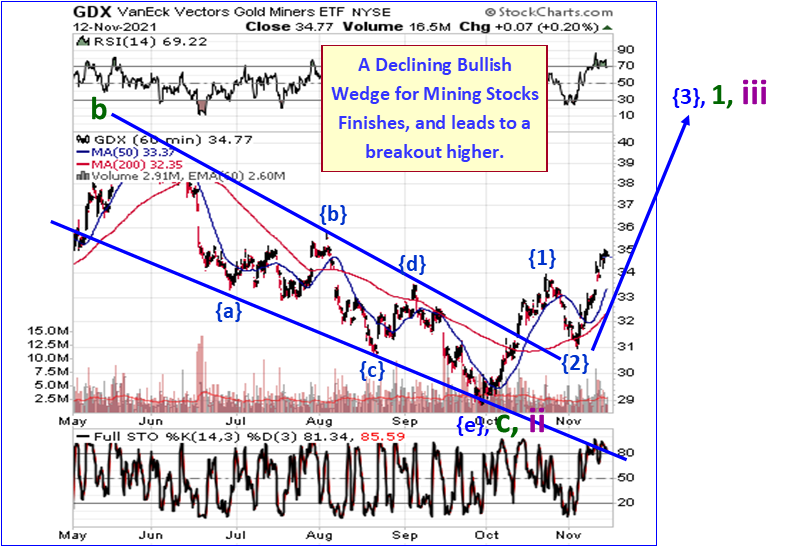
Zeroing in on an even tighter close-up, the above chart shows GDX, the ETF representation for the HUI, has just broken out higher (as did the HUI), from its declining Bullish Wedge pattern that dictated price moves since June 2021. Declining Bullish Wedges are usually found at the end of declining trends, and are usually followed by strong reversals. It is also interesting that it completed (bottomed) precisely at the bottom boundary of the overarching declining trend-channel from August 2020. That is a logical stopping point given the importance of that trend-channel. The initial move from this pattern’s bottom is typically the level it started at, so in this case it gives an initial upside price target of 40 for GDX, and 330 for the HUI.
We also track key indicator signals for Mining stocks as an assist to the patterns and wave mappings. We have four: The HUI 30 day Stochastic, the HUI Purchasing Power Indicator, the HUI 10 day average Advance/Decline Line Indicator, and the HUI Demand Power / Supply Pressure Indicator. We chart and report them in our market newsletters to subscribers. The Stochastic and Purchasing Power Indicator are measures of momentum. When these two are in agreement (both on Buys or both on Sells), they generate a Key Indicator Buy or Sell signal. Both are now on Buy signals.
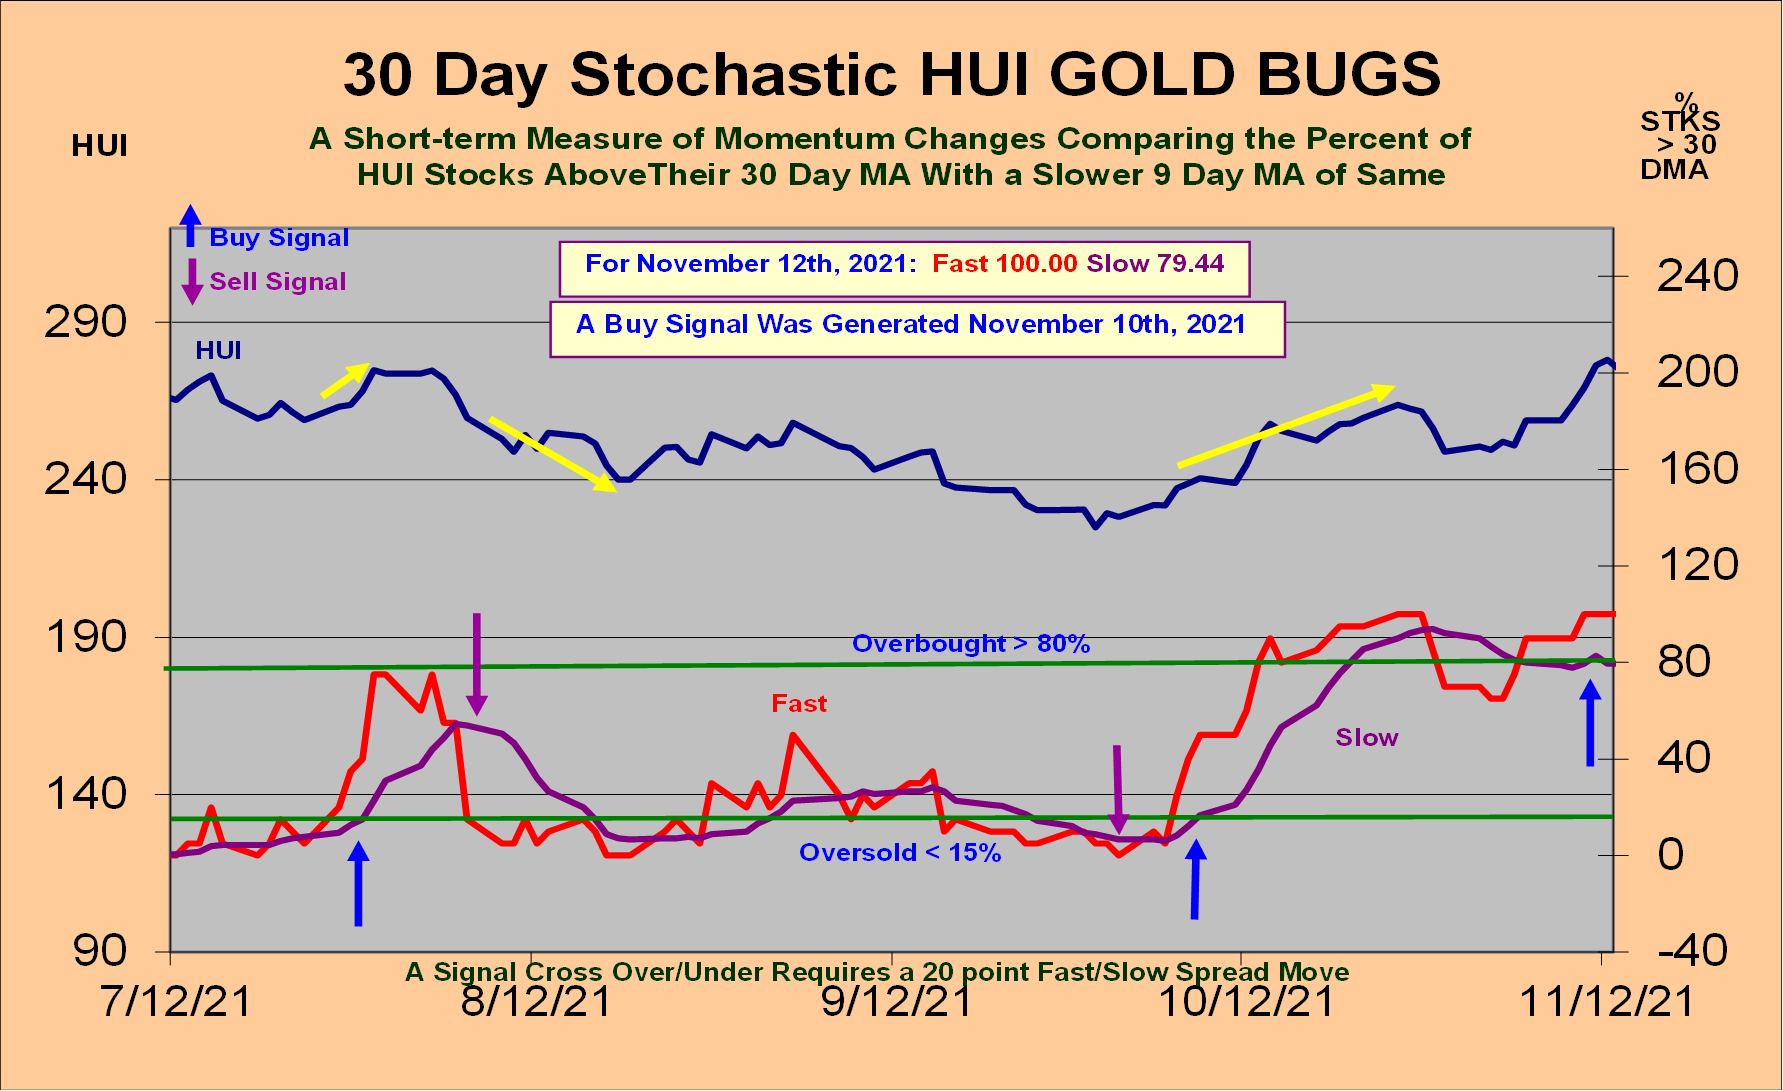
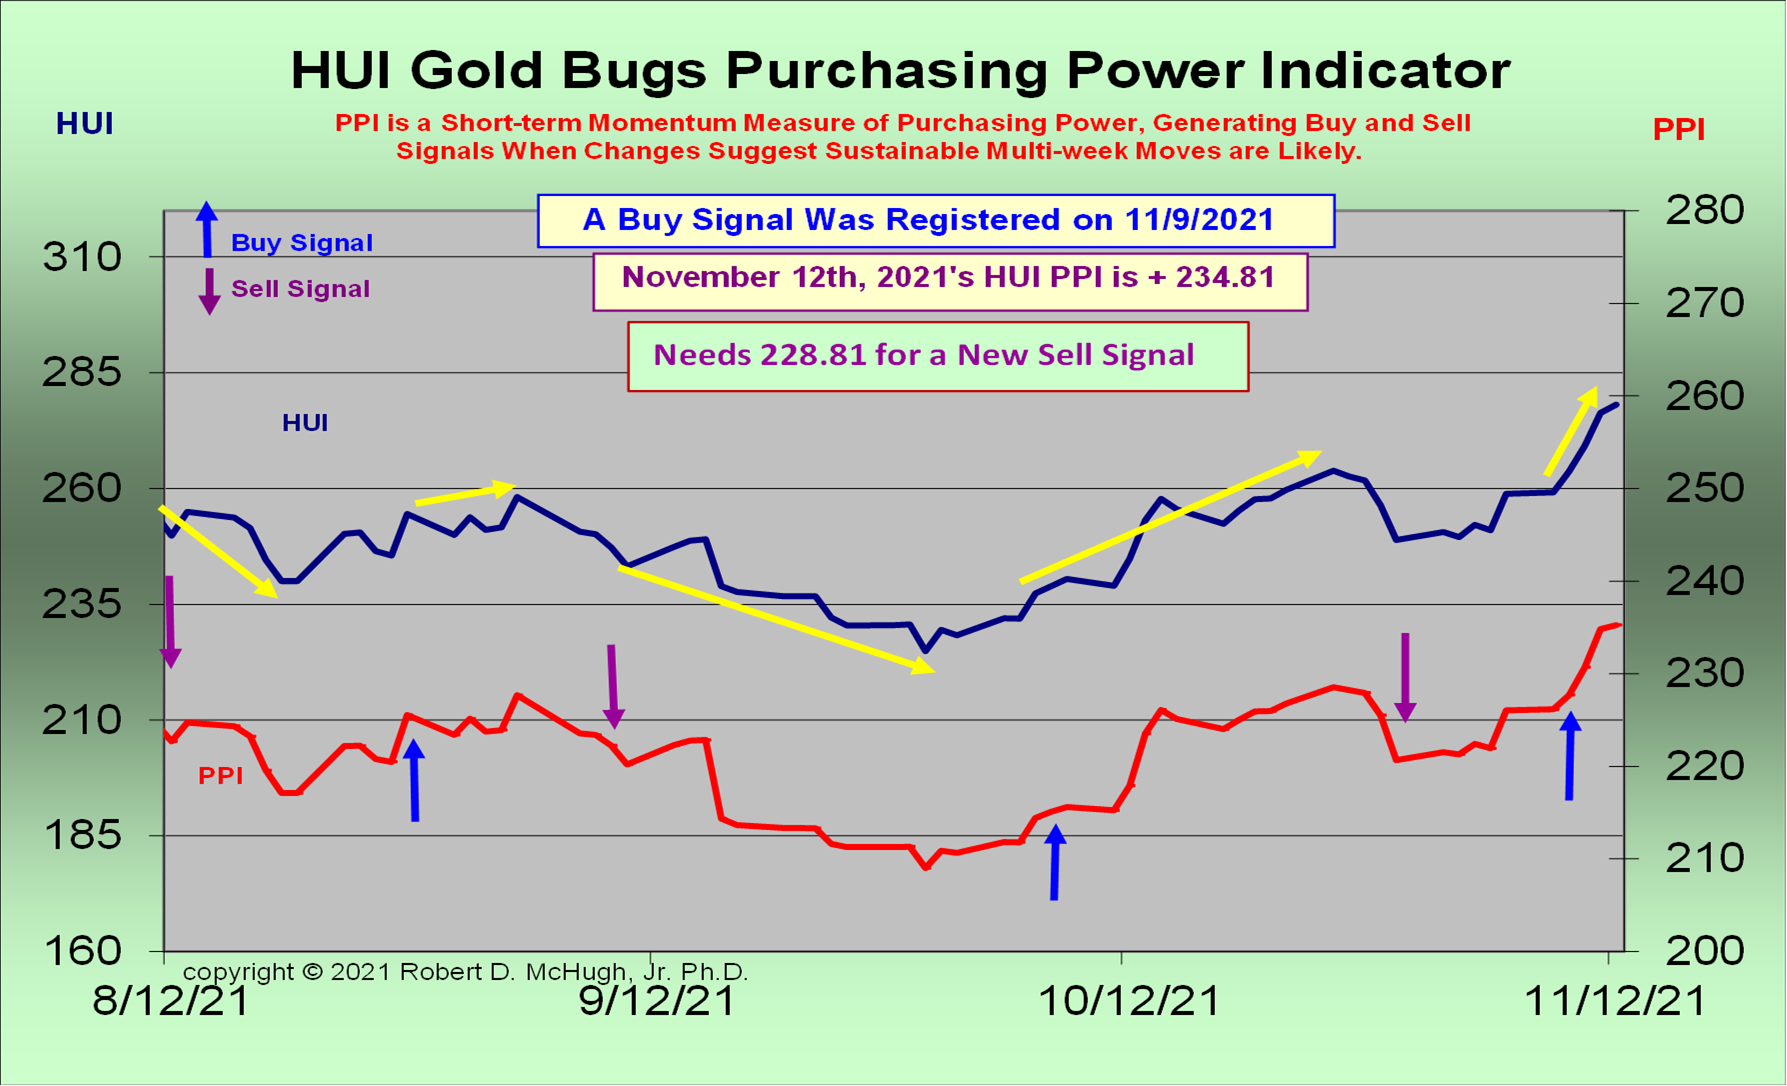
The fact they are both on Buy signals, and are derived indicators independent of patterns or Elliott Wave mappings, confirms the forecast from the patterns and Elliott Wave mappings shown and discussed above.
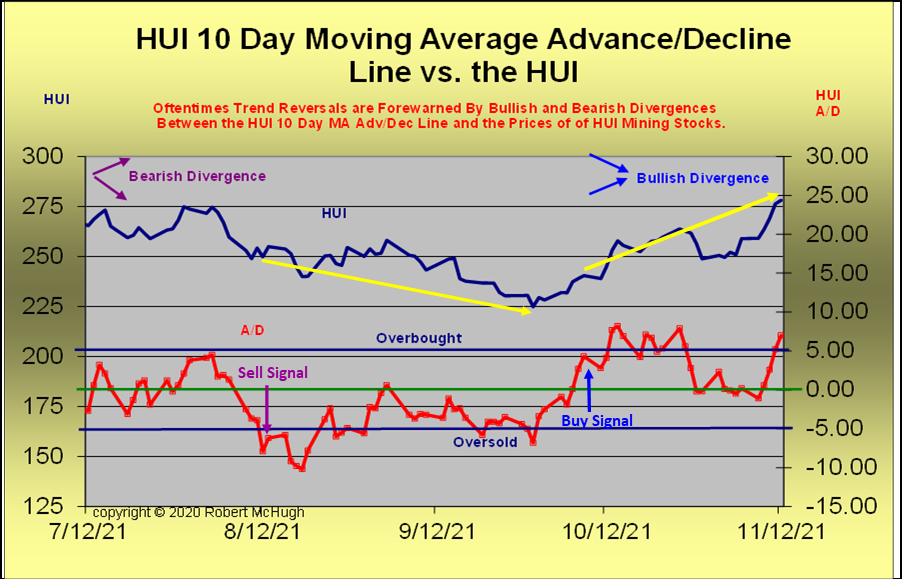
We also have two additional indicators that add confidence to our trend forecast (which helps us when trading Mining stocks with either Options or Exchange Traded Funds). We show them in the below charts.
The first is the HUI 10 Day Average Advance/Decline Line Indicator. Once it rises decisively above the zero line (from a negative reading), we get a Buy signal. That is the case at this time. Below we can see that the HUI has risen sharply since the Buy signal in early October 2021.
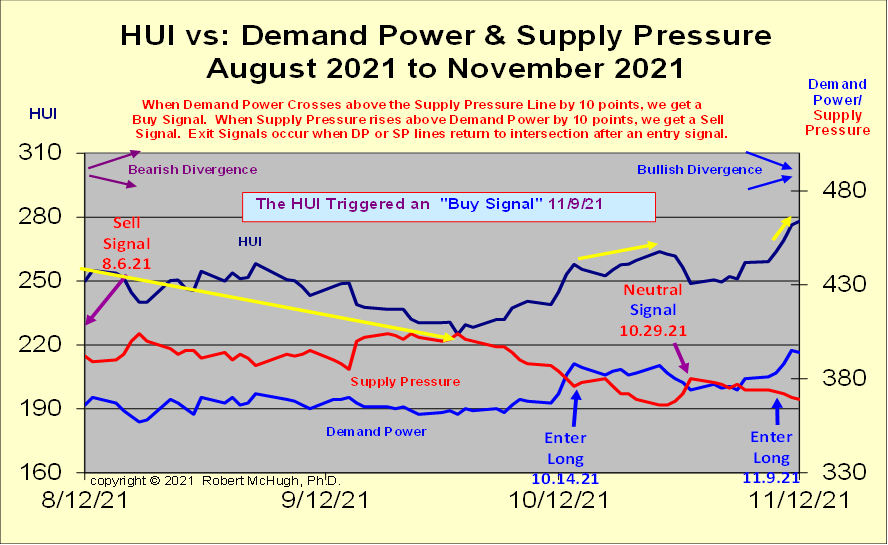
The final chart is the above HUI Demand Power / Supply Pressure chart. This measures Demand versus the Supply of Mining stocks offered on any day, and tracks which is outweighing the other. When one measure decisively moves above the other, we get either a Buy or Sell signal. If Supply is decisively stronger than Demand (Economics 101), we get a Sell signal. When Demand is decisively stronger, we get a Buy signal, which is currently the case.
There is one caveat to all of the above. The short-term Bullish case will be deterred temporarily should the general stock market plunge. Mining stocks are operating corporations, excavating and mining underground metals of course, which means they are a hybrid of Metals and stocks. Should the general stock market plunge, Miners could follow the general market lower initially. However, they should rebound as the Fed attacks the next stock market plunge with cargo carriers of hyperinflating dollars.
At Dr. McHugh’s www.technicalindicatorindex.com we track the patterns and waves that make up large and short-term degree trends, and chart them in our forecast newsletters. We have developed several proprietary Buy/Sell indicators that help us identify when the next significant move is starting for the major Stock Indices, as well as for Gold, Silver and Mining stocks, in which direction the move will develop, with likely price targets. We publish these indicators in every Newsletter to subscribers. We offer education and real time trading to identify opportunities, and demonstrate how to trade markets up or down, based upon these indicators, patterns, and overbought / oversold conditions.
********


