Monetary Metals Supply And Demand Report


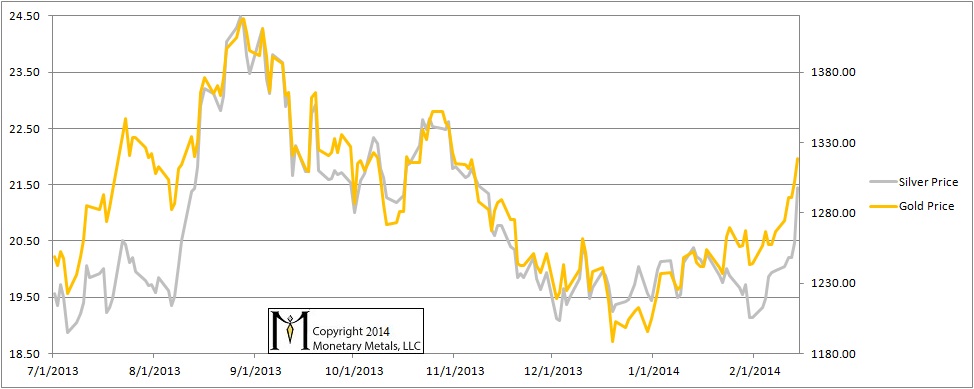
The dollar dropped a lot more this week than it has in any one week for a long time. Measured conventionally, the gold price spiked $51, and the silver price by $1.47. Gold owners have 4% more dollars, and silver owners have 7.4% more dollars. However, those dollars are worth less. How much less?
To calculate the value of the dollar (or anything else), we can’t use consumer prices. This is because consumer prices are constantly falling, in real terms. Consumer prices are falling because industry is constantly pushing itself to be more efficient. Gold is the closest thing to a constant value in the economic universe, the equivalent of the speed of light in a vacuum, C.
The dollar went from 24.55mg gold to 23.59mg, a loss of 3.9%. If you have 4% more of something worth 3.9% less, you are exactly even (trust me on the math, if you don’t remember those cases of percent from 9th algebra class). Or another way of thinking of it is that your wealth went from one ounce to one ounce of gold, a change of 0%. The profit is illusory, an artifact of measuring money (i.e. gold) in terms of falling credit (i.e. dollars).
Unfortunately, if you sell your gold to take your phantom profits, you are subject to taxes, at least in the US. The IRS believes that your gain is real. They will take perhaps a third of it, and the state tax authority will take more. Unless you used leverage, if you traded this spike then you have taken a loss when you account for taxes. Bummer.
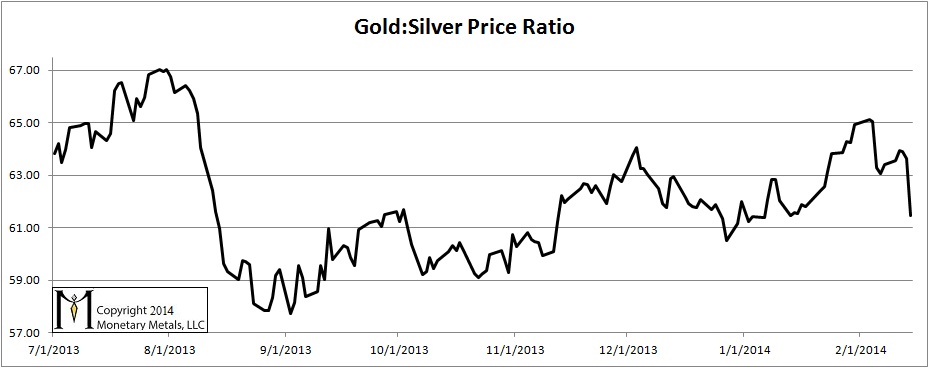
Silver is a different picture. The silver price went up 7.4% in dollar terms, or 3.2% in gold terms. A week ago Friday, it took 63.4oz of silver to buy an ounce of gold. Now it takes only 61.5oz. We won’t do the arithmetic here, but silver speculators likely did make a small profit, even after they net out taxes. Congratulations.
Now be aware that while the price of silver may have shot up, the supply and demand picture hasn’t changed much. Leveraged speculators went on tilt this week. Could they go get crazier next week? Absolutely. This is why we always say never naked-short a monetary metal!
We can only emphasize that unless the fundamentals in silver change in a big way, the silver price is likely headed for a big fall. We estimate that the neutral price for silver has risen only slightly, to around $18.60. When the exuberance and leverage (or access to credit) dries up, the price could fall back even faster than it rose. It could overcorrect, too. If speculators push it as far below the neutral line as they have pulled it above, that would put it at $15.75.
It’s something to think about, while picking up those silver pennies in front of the steamroller.
Anyways, here is the graph of the metals’ prices.
The Prices of Gold and Silver
We are interested in the changing equilibrium created when some market participants are accumulating hoards and others are dishoarding. Of course, what makes it exciting is that speculators can (temporarily) exaggerate or fight against the trend. The speculators are often acting on rumors, technical analysis, or partial data about flows into or out of one corner of the market. That kind of information can’t tell them whether the globe, on net, hoarding or dishoarding.
One could point out that gold does not, on net, go into or out of anything. Yes, that is true. But it can come out of hoards and into carry trades. That is what we study. The gold basis tells us about this dynamic.
Conventional techniques for analyzing supply and demand are inapplicable to gold and silver, because the monetary metals have such high inventories. In normal commodities, inventories divided by annual production can be measured in months. The world just does not keep much inventory in wheat or oil.
With gold and silver, stocks to flows is measured in decades. Every ounce of those massive stockpiles is potential supply. Everyone on the planet is potential demand. At the right price. Looking at incremental changes in mine output or electronic manufacturing is not helpful to predict the future prices of the metals. For an introduction and guide to our concepts and theory, click here.
Here is a graph of the gold price measured in silver, otherwise known as the gold to silver ratio.
The Ratio of the Gold Price to the Silver Price
For each metal, we will look at a graph of the basis and cobasis overlaid with the price of the dollar in terms of the respective metal. It will make it easier to provide terse commentary. The dollar will be represented in green, the basis in blue and cobasis in red.
Here is the gold graph.
The Gold Basis and Cobasis and the Dollar Price
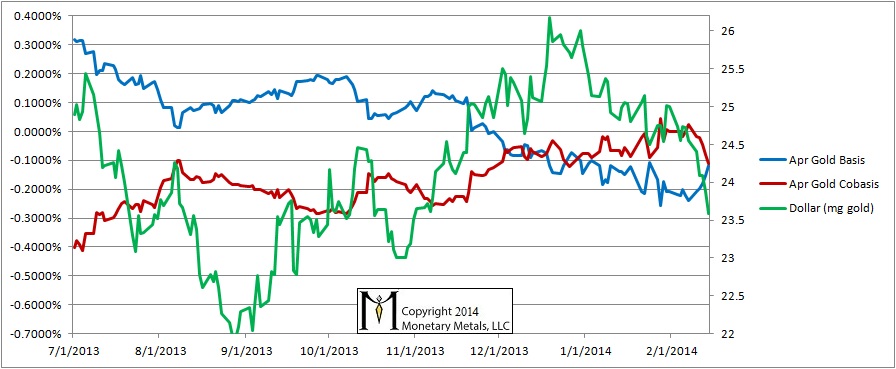
The April contract had been in a slight backwardation. Not any more. As the dollar has dropped, the cobasis has dropped a bit. Now it’s -0.11%.
We’re still bullish on gold, and our estimate of the neutral price has risen $30, to over $1420. This does not mean the price must rise next week (though it seems likely, based on the technicals).
Now let’s look at silver.
The Silver Basis and Cobasis and the Dollar Price
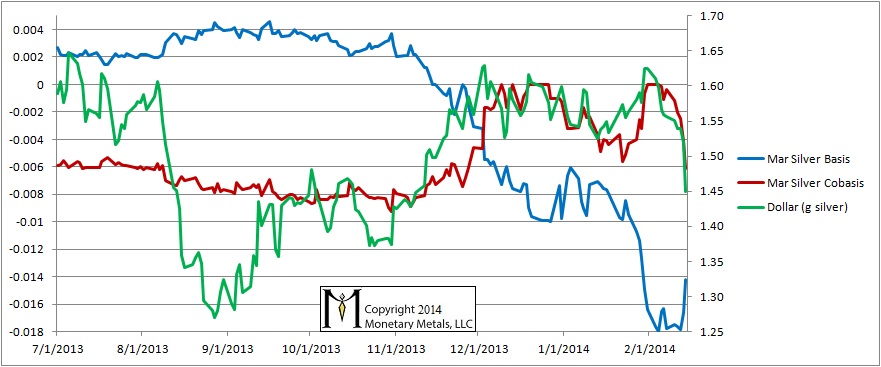
Look at that drop in the cobasis! It is worth noting that we are now but a few weeks away from First Notice Day, and we are in the thick of the contract roll right now. Most who had the March silver contract must sell, as they don’t have the cash to take delivery. If they wish to remain long silver, they can buy May or some other month. This relentless selling of the March contract places downward pressure on its bid. Look at the math.
Basis = Future(bid) – Spot(ask)
Cobasis = Spot(bid) – Future(ask)
Heavy and protracted selling of the contract headed towards expiry should cause a falling basis. The market makers will bring down the ask, to keep a consistent spread. The net result is a basis that falls off the bottom of the chart and a rising cobasis. This is precisely the pattern of temporary backwardation that we have been documenting in the new normal, post-2008.
Despite this selling pressure on the March contract, the basis is rising and cobasis is falling. How much would speculators have to buy to cause this, so close to contract expiry? A lot. The same pattern is occurring for the May, and July contracts.
© 2014 Monetary Metals
 Dr. Keith Weiner is the CEO of Monetary Metals and the president of the Gold Standard Institute USA. Keith is a leading authority in the areas of gold, money, and credit and has made important contributions to the development of trading techniques founded upon the analysis of bid-ask spreads. Keith is a sought after speaker and regularly writes on economics. He is an Objectivist, and has his PhD from the New Austrian School of Economics. His website is www.monetary-metals.com.


