Money Supply Up; Gold Price Unch


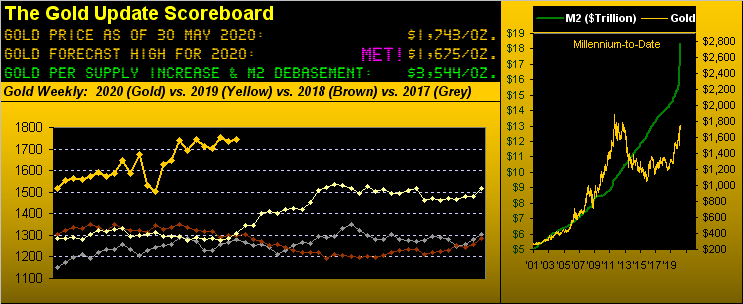
Gold just wrapped up its fifth trading month of 2020 in settling yesterday (Friday) at 1743, which by the "incoming" premium-heavy August contract was a weekly loss of 11 points and by the "outgoing" June contract was a loss of 4 points. But: because one trades by price (aka, "the truth") rather than by change (aka, "the illusion"), rolling (to avoid being committed to delivery) and rounding off from June's close a week ago of 1735 benevolently lands Gold with an eight-point gain. How grand a losing week can one have? However, Gold's first touch of the present 1743 this year was at the intra-day high better than seven weeks ago on 07 April, price's net change from then thus being zero ("0", i.e. "unch"). And yet in that relatively short time span, the U.S. money supply as measured by "M2" has increased 8.8% from $16.8 trillion right up through the $17 trillions to $18.4 trillion today. Go figure.
Indeed Gold's gain purely by premium was sufficient in allowing price to again briefly put its toe up into The Northern Front (1750-1800) for five hours during Friday before timidly pulling back as the S&P 500 raced to its highest close in nearly three months at 3044. Meanwhile, the year has unfolded through May without Gold winning a Northern Front foray. But shall what might be the beginning of a fourth attempt finally reverse the prior three failures? Not that you need be reminded, but here's the updated list in chronological order:
■ 06 April: Gold crosses above 1750 for three days in reaching the year-to-date high of 1789 before succumbing to 1662 come 21 April;
■ 23 April: Gold crosses above 1750 for two days before succumbing to 1676 come 01 May;
■ 15 May: Gold crosses above 1750 for five days before succumbing to 1684 come 27 May.
The good news is that each of those noted three lows to which Gold has succumbed has been higher than that previous. The bad -- or better put sad -- news would be to see Gold rise on fears of spreading anarchy here StateSide.
Either way, from this latest unruly state of affairs to the debasement of our Dollar shares, those who seriously study/analyze/trade and/or invest in Gold have been querying "Is this IT?" or have been outright declaring "This is IT!" ... and yet whatever "IT" is conjured up to be hasn't really appeared a wit. From our purview, hardly has a week passed in 2020 wherein we've not written the phrase "massive overhead resistance" with technical respect to Gold's pricing structure. And each time that Gold fails in a bid to cross up through The Northern Front only adds to the strength of the resistance forces therein. "IT" may well be that Gold -- like a chess knight -- shall have to be picked up, say upon closing a session sub-1750, so as to effectively "jump over" The Northern Front by being placed back on the board at 1800 for the ensuing session's open. In fact: "Miss Gibbs? Could you kindly arrange for a meeting between the London Metals Exchange and a consortium of those sovereign and private banks with significant Gold holdings? Yes, Basel would be most appropriate. My usual two-room suite there at the Motel 6 would be fine, thank you." (Whatever it takes, eh?)
Whatever it takes to stay in first place is what we see here in the year-to-date BEGOS Markets Standings. And with five months in the books, the near-zero interest rate environment has kept the Bond's price ridin' "High, Wide and Handsome"--[Kern/Hammerstein II, '37]. But tucked in right there for second and third position are Gold and Silver. To be sure, Silver (finally) is on the move of late: as measured across the last 25 trading days since 24 April, the price of Gold is actually -0.2%, but Silver's is +20.4%, the Gold/Silver ratio in turn having dropped from 113.7x to (a still dastardly high) 94.3x today. Further, from the "Gold Plays No Currency Favourites Dept.", note as well the Dollar's "strength": +2.3% may not seem like much, but for the last 24 years, that is the Buck's 10th-best January-though-May performance, (not to ruffle the feathers of the good folks over at the Schweizerische Nationalbank, their Franc barely über wasser at +0.2% year-to-date):

Indeed as Gold stays above water, 'tis rather been treading it, if not outright standing on our 2020 (pre-COVID) forecast high line at 1675. As you can next see in the chart of weekly bars from a year ago-to-date, price of late has closed above the rising dashed trend line for eight consecutive weeks; but this chopping up and down through those two months doesn't bode well for maintaining such above-trend stance unless Gold takes the chance to finally win The Northern Front at the top of the chart:
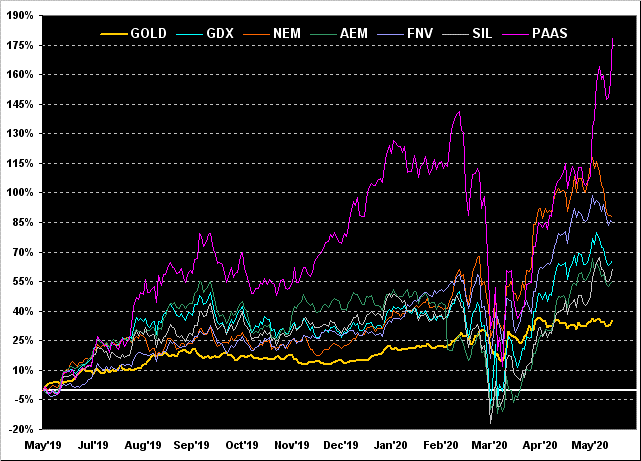
Still all-in-all, 'tis not a bad year-over-year picture for Gold. But wait: there's more. And hugely so as we add in the percentage tracks of some of the most visibly-traded precious metals equities. To wit our next graphic:
No, that's not the erratic scrawl from some kid having run amok with a fuchsia-coloured crayon: rather 'tis the +179% increase in the shares of Pan American Silver (PAAS) from this time a year ago. Remember when PAAS was the runt of the litter, perpetually in the red and left for dead whilst its equities brethren plowed ahead? 'Twas practically abandoned, wanting for love like a "get no respect" Rodney Dangerfield, his girlfriend having rung up to say "Come on over, there's nobody here", so he did and there was nobody there. Well mes amis, look at PAAS now. And not to the leave the balance of the bunch unrecognized: we've Newmont (NEM) +88%, Franco-Nevada (FNV) +85%, the VanEck Vectors Gold Miners exchange-traded fund (GDX) +66%, the Global X Silver Miners exchange-traded fund (SIL) +62%, Agnico Eagle Mines (AEM) +55%, and Gold itself +35%. PAAS the word on:
Moreover in mirror-like tracking to those metals' equities since COVID kicked in is the Economic Barometer. You'll recall a week ago our noting that "...To the extent ... reports indicate conditions worsening at a slower rate, are not as bad as expected, and get some benevolent revisions, conceivably what is shown below may appear in hindsight as the "vee" low for Econ Baro..." Now a week later we know 'twas not so. Rather than a "vee" we see a "nutcracker". Ouch! April turned out to be the month of cash-hoarding, with Personal Income +10.5% but Personal Spending -13.6%. The Fed's favoured inflationary read of Core Personal Consumption Expenditures was instead deflationary at -0.4%. The shrinkage rate of Durable Orders worsened, May's Chicago Purchasing Managers Index hit its lowest level since that of March 2009, and first-time Jobless Claims cumulatively for ten weeks topped the 40 million level. Here's the Baro, the gay S&P 500 nevertheless plowing happily higher:
And there's the obvious rotation from what is economically "out" to "in": Boeing has begun its layoff strategy of 6,700 employees, but Amazon looks to permanently retain some 120,000 people it brought on as buying from home has ramped up during COVID. Less promising is the economic state of Europe, Renault in its reboot to give the boot to some 15,000 folks. Indeed the European Central Bank estimates the Zone's gross domestic product to shrink on the order of 8% to 12%, (ref. above Dollar "strength").
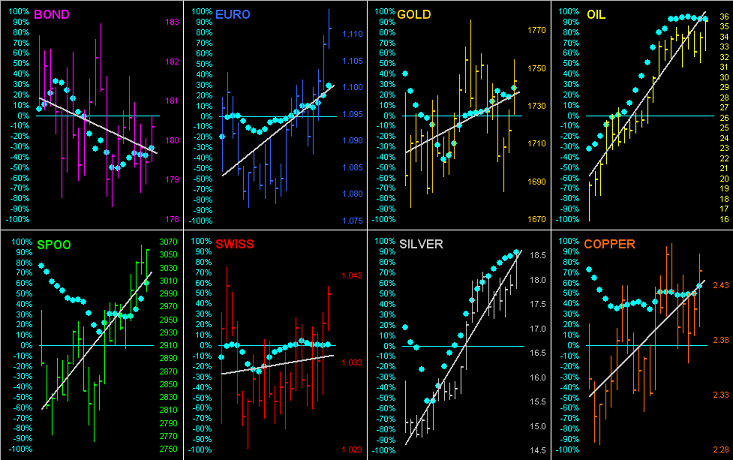
Next let's go 'round the near-term horn for all eight components that comprise the BEGOS Markets. These are their daily bars from one month ago-to-date, the respective grey trendlines, and the "Baby Blues" denoting each trend's day-to-day consistency. A couple of takeaways include: the Bond may be at the top of the aforeshown Standings, but its price is the only one now sporting a negative trendline; and Oil and Silver have been trading practically hand-in-glove. 'Course as always, the dots are our friend until they reverse their own trends, which understandably have been rickety as a function of recent markets' chaos:
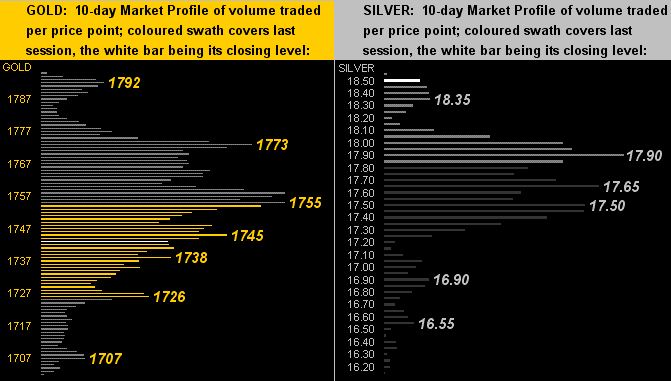
Turning to the 10-day Market Profiles for Gold on the left and Silver on the right, there is quite the juxtaposition. The yellow metal sits below a trading resistance swath from 1755 up to 1773, i.e. encompassing the lower portion of The Northern Front. The white metal however sits above a trading support swath from 17.90 down to 17.50: Sister Silver's weekly settle at 18.49 is her best since that ending 21 February:
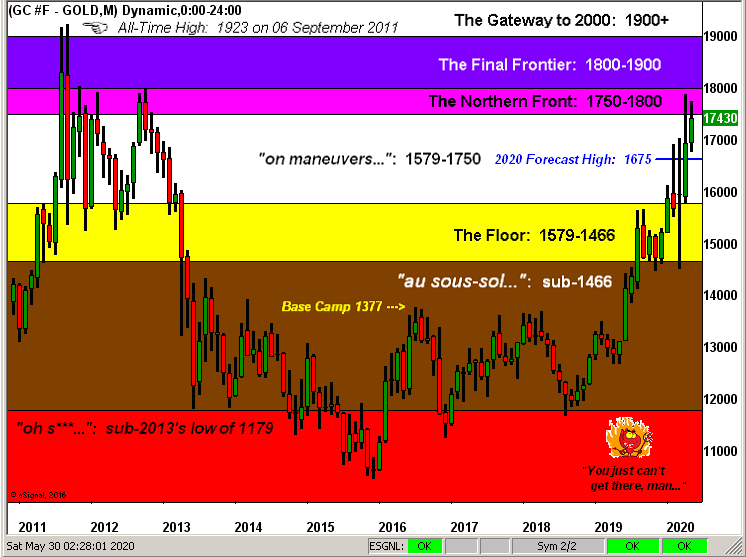
And so it being month's end, 'tis time the bring up our graphic of Gold's Structure by the monthly bars since the All-Time High back in 2011. Therein is the rose-coloured Northern Front which -- whilst comparatively narrow in spanning the 1750-1800 zone -- is fraught (dare we again mention) with the "massive overhead resistance" borne from the left-hand portion of the chart. The two bars at right poking up into The Northern Front represent both the two April failed forays to make the crossing plus the one May failed foray. Hardly about which to say "hooray" especially should the wee chap at lower right get his way; however Gold shall forever live to fight another day:
So there it all is: an increasing money supply of which thus far Gold has not been able to mitigate in value gained. Rather (as noted) price is again at that of 07 April. Gold's various trend measures are up, and yet price itself is lacking puff. That summarized, we'll wrap with this Golden story:
In the picturesque French department of Loir-et-Cher lies the commune of Vendôme, (the duchy to the southwest from which Paris' Place Vendôme gets it name, the Duke having had his townhouse there in the late 17th century). It stands to reason that the Place Vendôme and its surroundings represent one of Europe's wealthiest neighbourhoods. Due to the COVID "confinement", two lads from Paris found themselves sequestered at their late grandma's house down in Vendôme itself. Constructively doing as youngsters do, they took to building a shack out back which called for getting some old bedsheets out of granny's cupboard. In pulling out the sheets came a lovely double-thud as two bars weighing a kilo each in Gold dropped to the floor. You can do the math, but the lads rather than having the shack can now well afford the rent of a Place Vendôme pad back home in Paris. 'Course the moral of the story is: grab Gold where you can find it!
www.deMeadville.com
www.TheGoldUpdate.com
********

Mark Mead Baillie has had an extensive business career beginning in banking and financial services for two years with Banque Nationale de Paris to corporate research for three years at Barclays Bank and then for six years as an analyst and corporate lender with Société Générale.
For the last 22 years he has expanded his financial expertise by creating his own financial services company, de Meadville International, which comprehensively follows his BEGOS complex of markets (Bond/Euro/Gold/Oil/S&P) and the trading of the futures therein. He is recognized within the financial community of demonstrating creative technical skills that surpass industry standards toward making highly informed market assessments and his work is featured in Merrill Lynch Wealth Management client presentations. He has adapted such skills into becoming the popular author each week of the prolific “The Gold Update” and is known in the financial website community as “mmb” and “deMeadville”.
Mr. Baillie holds a BS in Business from the University of Southern California and an MBA in Finance from Golden Gate University.


