Mr Bear And Dow Jones Dividends…Not for The Faint Of Heart
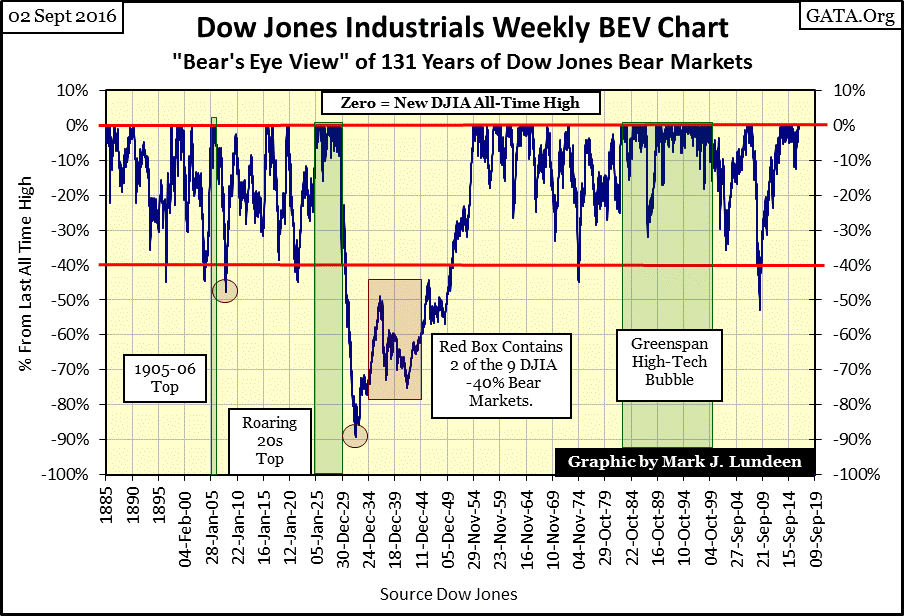
Looking at market history via the Bear’s Eye View (BEV) plot provides a unique insight into the past. When plotted in dollars, monetary inflation makes nonsense of market data spanning decades. A BEV view of the market, where each new all-time high (BEV Zero) is equal to 0% (and never more), and all other data points not a new all-time high are expressed as a percentage from its last all-time high, brings clarity to the many decades of bull and bear markets in the stock market, or any other historical market series.
A BEV plot illustrates how Mr Bear actually understands markets; to him each new all-time high is only a big fat Zero. The only thing he’s interested in is how many percentage points he can claw back from each new all-time highs. And that’s exactly what we see in the Bear’s Eye View of the Dow Jones’ data series from 1885 to 2016 below.
Note the circles on the 1907 & 1932 bear market bottoms. The crash of 1907 was the market event that inspired J.P. Morgan, Paul Warburg, and others to institute a central banking system (the Federal Reserve) in the United States. Within two decades of its creation the Great Depression resulted.
I cover these bear market bottoms in greater detail below.
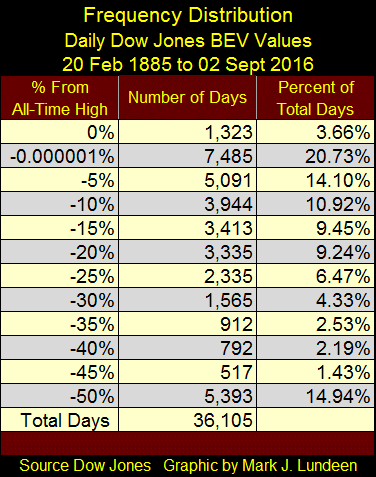
Next the frequency distribution table for the Dow Jones BEV plot seen above, from 20 February 1885 to 02 September 2016. The data is daily, and since February 1885, the Dow Jones made 1,323 daily new all-time highs. The -0.00001% row catches the daily closes that are just a penny away from being a new all-time high, down to -4.99% from being one. This row is necessary to isolate actual all-time highs in the 0% row. The Dow Jones since 1885 has seen 7,485 daily closings not far from being a new all-time high.
Note the -50% row; then take a quick look at the BEV chart above. After the 1929-32 crash, it took over two decades before the Dow Jones would work itself out of the hole it found itself in. The Dow Jones didn’t see a new all-time high until November 1954; twenty five years and two months after September 1929.
In what follows I’m going to use the Dow Jones as a proxy for the broad stock market. Without doubt, during every bull and bear market, there are stocks that perform better, or worse than the Dow Jones. But for a general examination of the stock market as a whole for the past 131 years, the Dow Jones is more than adequate.
Viewing the Dow Jones as Mr Bear does offers us a unique insight into stock market history (BEV chart above). With the exception of the Great Depression Crash, since 1885, seeing the Dow Jones decline 40% from an all-time high provided investors with a strong buy signal. This was true for the 2007-2009 credit-crisis bear market, the second deepest bear market bottom since 1885. At the close of 09 March 2009, the Dow Jones found itself 54% from its October 2007 all-time high. Still, had one reentered the market on 10 October 2008, as the Dow Jones broke below its BEV -40% line, they would have missed the worse of the market decline and done very well in the following years.
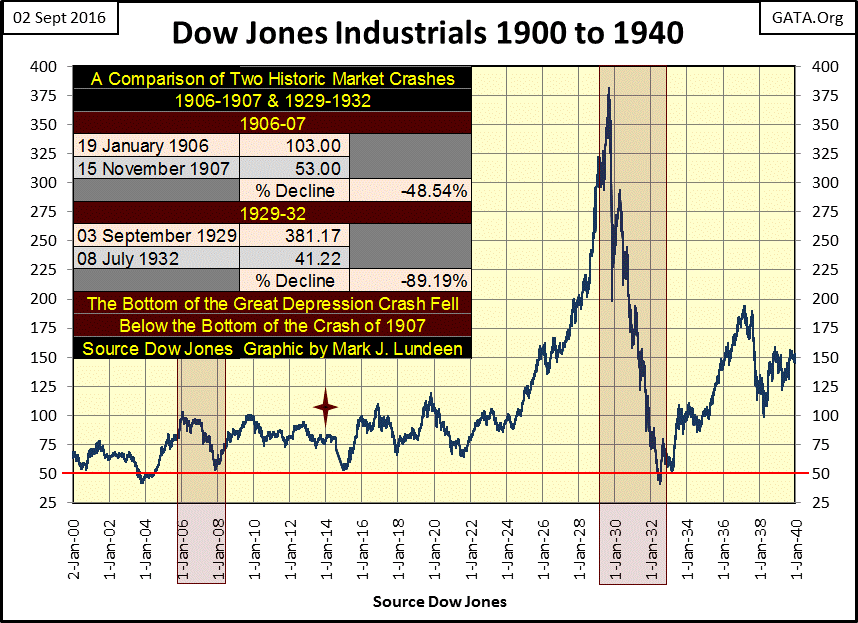
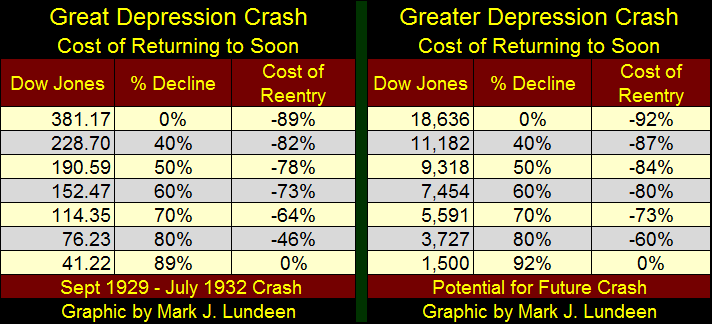
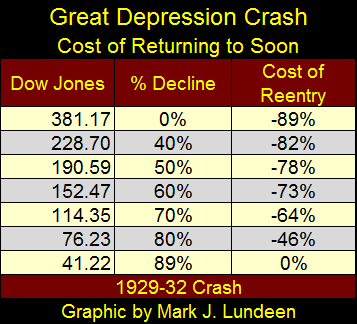
But that wasn’t the case at all for the Great Depression Crash; far from it! What made the Great Depression Crash so depressing was the horrific bear market mathematics of it, as seen in the table below. The crash began on 03 September 1929 as the Dow Jones saw its last all-time high of the Roaring 1920s; 381.17, and bottomed on 08 July 1932 at 41.20. If one came back in the market with the Dow Jones down by 40%, and held on until the July 1932 bottom, they saw an 82% loss in their investment. Even in March 1932, when the Dow had declined by 80% thirty months into the crash (76.23), investors who entered the market still took a 46% loss over the next four months.
Here’s a chart of the Dow Jones from January 1900 to January 1940. Note on the data used. From 1885 to 1928 the Dow Jones data seen below had evolved many times. In 1885 it originally consisted of twelve railroad and two industrial stocks, and saw many permutations over the following decades. But the thing to note is that at the start of WW1, the NYSE stopped trading from August 1st (@ 71.42) until December 12th where a totally reconfigured Dow Jones, one that would be used during the 1920s closed at 54.00; leaving a 24.3% gap between the two data series. I closed this gap by using a factor for the data previous to the War. It’s not a perfect solution to this problem, but one I felt necessary for continuity.
In the chart below I highlighted two of the bear markets seen in the BEV chart above: 1907 & 1932. Using my data, corrected for the WW1 break in the Dow Jones, we see that the 1932 bottom of 41.22 was actually lower than the bottom of the 1907 bear market: 53.00.
After the tremendous advances the stock market made during the 1920s, Mr Bear clawed back from the bulls not just the gains of the past twenty-two years in the Great Depression Crash, but to levels below where the stock market found itself in November 1907. Actually, one would have to back as far as June 1897 to see the Dow Jones close below 41.22. Ouch!
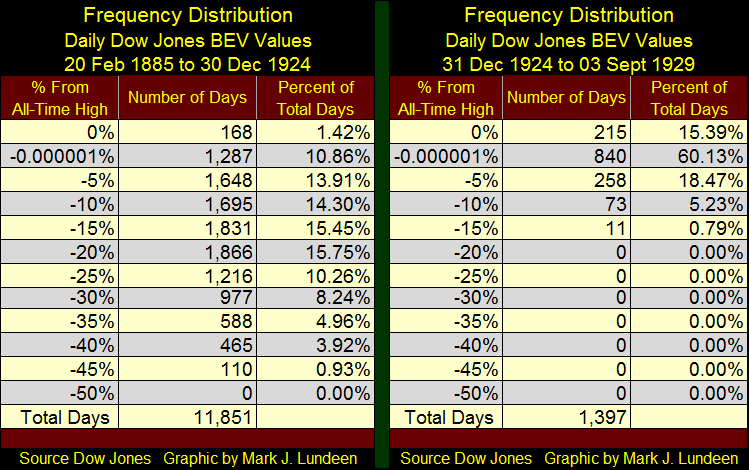
The two frequency distribution tables below, one spanning from 20 February 1885 to 30 December 1924, the other from 31 December 1924 to 03 September 1929, displays the extraordinary difference of how the market operated before and after December 1924. The frequency table spanning February 1885 to December 1924 samples 11,851 trading days, of which only 168 of those days saw the Dow Jones close at a new all-time high.
Compare that to what happened after 30 December 1924 in the second frequency table. Of the 1,397 trading days from 31 December 1924 to 03 September 1929, the Dow Jones closed at a new all-time high 215 times. If we include the data from the -0.0001% row, for those days just a penny short of a new all-time high, down to -4.99% from being one, we see that for 1,055 trading days of the 1,397 in the sample (over 75% of the daily closings), the Dow Jones closed either at, or within 5% of making a new all-time high during the final years of the Roaring 1920s bull market.
What happened? In the chart above plotting the Dow Jones in dollars, look at the red star marking January 1914; it marks the creation of the Federal Reserve system, which after it began its operation, the stock market was never the same.
Apologists for the Federal Reserve, such as Doctor Bernanke, admit the Fed’s responsibility for the Great Depression Crash. They say “policy making” of the era was immature, but much was learnt from the experience of the 1930s. But what they gloss over is a fact plainly on display in the dollar plot chart of the Dow Jones, and in the two frequency distribution tables above; the “policy makers” of the 1920s inflated a historic bubble in the stock market. Had they not, the “policy mishaps” of the 1930s wouldn’t have been so depressing.
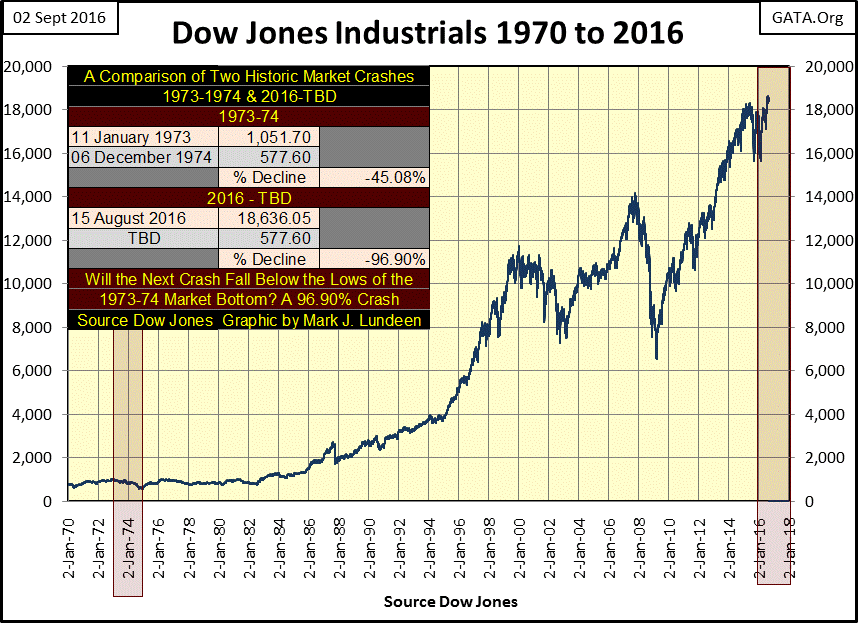
This brings us to the chart below, which to my eyes has an alarming similarity to the dollar plot of the Dow Jones from 1900 to 1940 above. Oh, there are differences too. Notably how the “policy makers” successfully practiced bear-market interruptus during the market downturns of 2000-02 & 2007-09, before they were successful in ratcheting the Dow Jones up above its 18,000 level. Obviously, “policy making” has matured greatly since the 1920s.
Still, I have a nagging fear that although the “policy makers” have twice frustrated Mr Bear in his so far unsuccessful attempts of purging the world of unviable debts, deflating overvalued financial assets in the process, the “policy makers” haven’t seen the last of Mr Bear. When he returns, is it possible that the stock market, and the global economy will see a repeat of the depressing 1930s?
You’ll never get on TV if you ask questions like that, but I wouldn’t rule it out. Twentieth century movers and shakers, such as Lenin and John Maynard Keynes certainly knew the potential for economic chaos monetary inflation can inflict on a society.
“Lenin was certainly right. There is no subtler, no surer means of over-turning the existing basis of society than to debauch the currency. The process engages all the hidden forces of economic law on the side of destruction, and does it in a manner which not one man in a million is able to diagnose.”
- John Maynard Keynes, The Economic Consequences of the Peace, 1920, page 235
Let’s examine the two methods of valuing the stock market. The method favored by the bulls is based on “economic growth” as defined by dubious statistics from government statisticians. During those times when monetary inflation is flowing into financial asset valuations, the bulls (and government statisticians) are unable to place limits on either “economic growth” or share prices. So there is no limit to the potential “growth” for the stock market in the minds of the bulls. Currently stock market valuations are being set by the bulls.
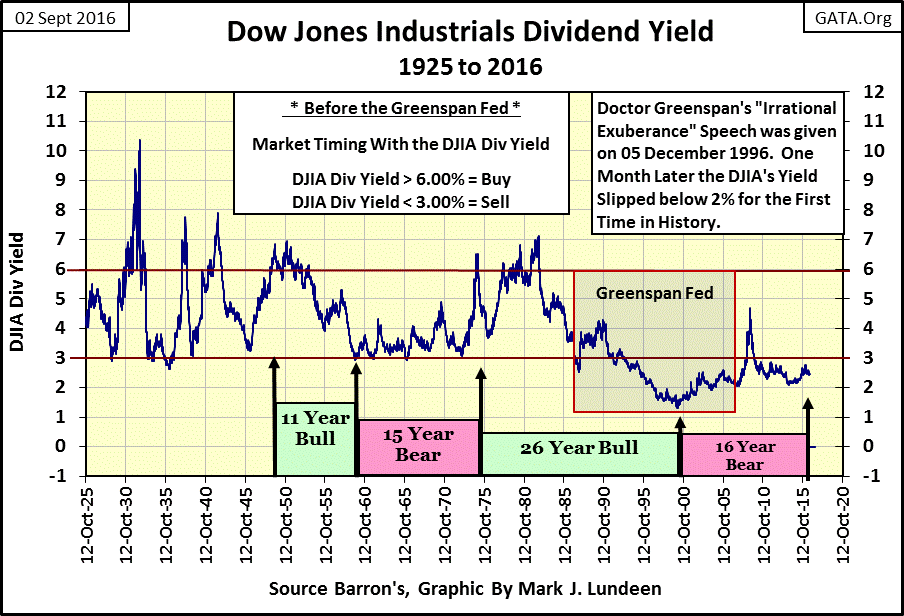
Mr Bear on the other hand favors valuing the stock market on a dividend model. From 1925 until Alan Greenspan became Chairman at the Federal Reserve in 1987, investors could time their entry and exit points in the stock market by the dividend yield of the Dow Jones (chart below). A yield of something over 6% in the Dow was a buy, but look at the 3% sell trigger. Since the Roaring 1920s bull market, seeing the Dow Jones dividend yield decline to 3% was an extremely dependable and profitable sell signal.
But all that changed with Alan Greenspan, who must have been aware of this data. He gave his infamous “Irrational Exuberance” speech in December 1996, where he asked how “policy makers” can know if financial assets were fair valued, or if the continuing rise in financial asset valuations were the fault of investors’ irrational exuberance. As noted above, “policy makers” don’t like to talk about their “policies” inflating markets, so Greenspan blamed bloated market valuations on the investors’ irrational exuberance. He knew what he was doing, and so saw the need to control the narrative, that market overvaluations were the fault of the public, not Alan Greenspan’s.
A month after Greenspan made this speech the yield for the Dow Jones dropped below 2% for the first time in history, and the Greenspan bubble would continue to inflate for another three years. Ultimately Greenspan’s inflationary policies would drive the Dow Jones dividend yield down to 1.30% on 14 January 2000; the top of the 1982-2000 bull market.
To my way of thinking, the chart above is prima facie evidence the “policy makers” have had great success in thwarting Mr Bear at every market downturn since 1990. To this day, the FOMC has refused to allow the valuation for the Dow Jones to deflate until it yielded a 6% dividend, for the past three decades.
Look at what happened at the bottom of the credit-crisis bear market. The second deepest bear market since 1885 bottomed with the Dow Jones at 6,547 yielding 4.74%: a 54% decline. But note the yield for the Dow Jones never increased to 5%, let alone 6%. Had the “policy makers” allowed the Dow Jones to deflate until its dividend saw a 6% yield, by restraining their impulse to inject trillions of dollars of QE into the financial markets, the Dow Jones would have bottomed at 5,173, a 63.4% market decline. That assumes the Dow Jones could have maintained its payout of $310.43. That would have been a big assumption in such a massive market decline.
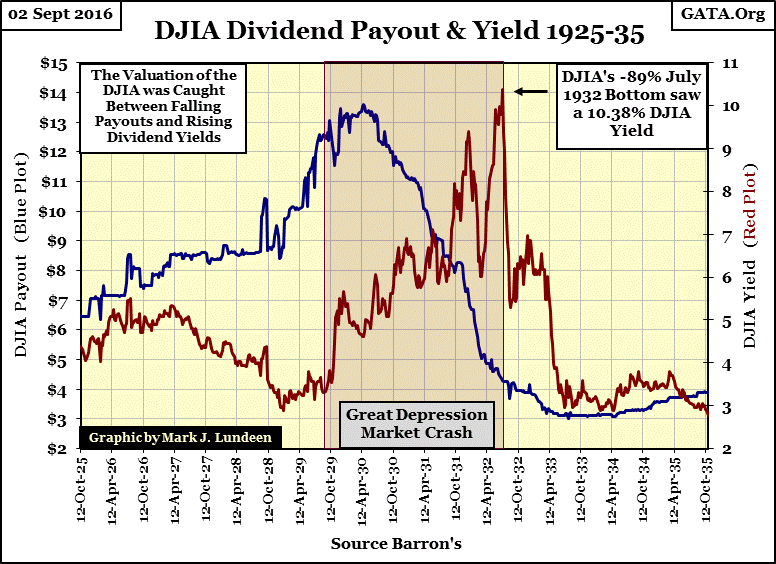
Let’s look at what dividends for the Dow Jones did during the Great Depression Crash (chart below). The valuation for the Dow Jones during the crash was caught in a bear market duel-pincer maneuver of rising yields and declining payouts. Note the Dow’s payouts actually increased for the first seven months of the crash.
Recently I’ve shown that bonds (contracts for debt) with their fixed income have proven to be disastrous in an inflationary-monetary regime. But dividend payouts by companies trading in the stock market are a profit sharing program for its owners; the shareholders. Dividend payouts can be increased when a company is increasing its profitability, or decreased at discretion of the company’s management, as happened during the Great Depression when profits were difficult to come by.
Dividend payouts for the Dow Jones, like its earnings, are at historic highs. However current “monetary policy”, with its near zero Fed Funds Rate and ever declining longer bond rates has encouraged corporate America to take on trillions of dollars of debt in the bond market. The proceeds from the bond market have largely been used to finance corporate share buyback programs, or to fund dividend payouts.
You can buy them shoes and send them to school, but when they become big shots in the corporate world they still do damnest things!
Mr Bear must be licking his chops as he patiently waits for the inevitable economic downturn. When over leveraged consumers stop buying what over leveraged corporate America is selling, I’m anticipating a collapse in the dividend payouts for the Dow Jones that will take our breath away as profits evaporate. Management will be forced to shift what residual profits they have from dividend payouts towards debt service for the trillions of dollars of consumptive debt taken on during the lamentable era of Bernanke and Yellen.
Interest rates, bond and dividend yields in such an environment will without a doubt will be rising, even without the permission of the FOMC, as Mr Bear once again takes charge in fixing market valuations for the stock market. And that means dividend yields much higher than we’ve seen since 1990.
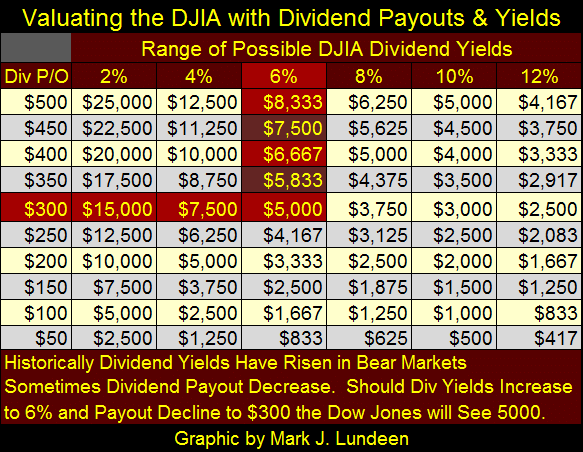
The potential impact rising dividend yields and falling payouts will have on the Dow Jones’ valuation can be determined with mathematical precision in the table below. The Dow closed the week at 18,491.96 paying out $456.21, giving it a yield of 2.47%. Should the Dow Jones payout decline 35%, to $300, and have its dividend yield increase to 6%, that would fix the Dow’s value at 5000. That’s a 73% market decline from its current all-time high of 18,636.05 seen on August 15th of this year.
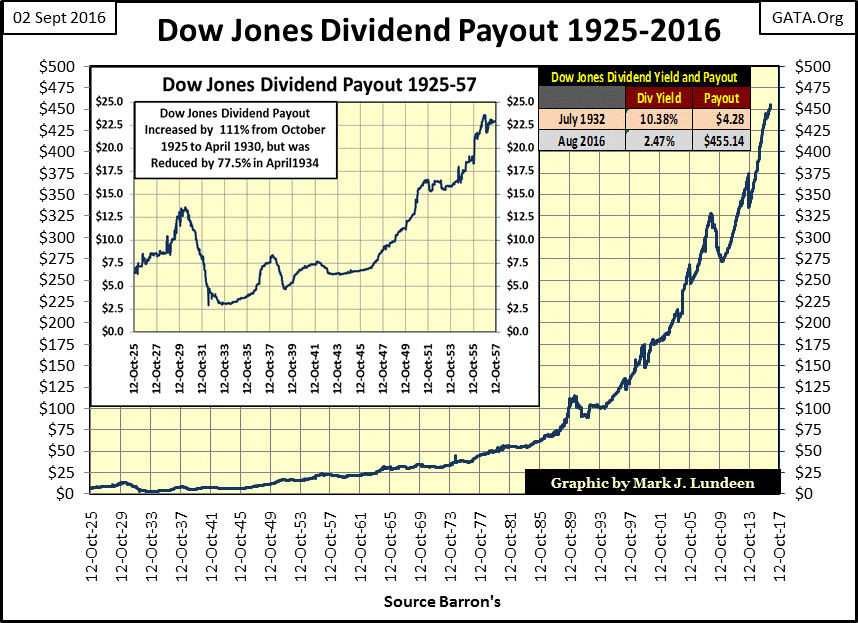
Above, I’ve included charts for yields and payouts for the Dow Jones going back to the 1920s. A payout reduction of 35% for the Dow Jones with its yield increasing to 6% are both well within historical parameters. Seeing changes in the Dow Jones dividend resulting in a 73% market decline isn’t the fault of Mr Bear, but of the “policy makers.” By suppressing Dow Jones dividend yields below 3% for three decades, they have inflated stock-market valuations far above historic valuations, exactly as they have done with bond prices.
“Central banks are now so heavily influencing asset prices that investors are unable to ascertain market values. This influence is especially evident, with the Fed's purchase of government bonds, which has made it impossible for investors to use bond prices to learn anything about markets.”
- Kevin M. Warsh: Former Federal Reserve Governor. Comments made to the Stanford University Institute for Economic Policy Research, 25 Jan 2012.
Let’s apply the Dow Jones July 1932 bottom’s dividend conditions to our current market; a 77% decline in payout with a 10% yield. That would be a payout of $150 with a 10% yield in the table above, placing the Dow Jones at 1,500: a 92% decline from the Dow Jones’ last all-time high (18,636). That’s deeper than the Great Depression bottom; could this happen? “Responsible market commentators” would assure the public that such a decline today is impossible.
I have no desire of being irresponsible; shouting fire in a crowded theatre.
All I’m doing is pricing the Dow Jones as Mr Bear does during bear markets, using dividend payouts and yields. What I’m finding in the charts and tables above is a bleak picture of the future for the stock market.
It’s been the “policy makers” in the past few years who have been irresponsible; facilitating corporate America, and everybody else in taking on levels of debt that in past times were known be reckless. Being reckless in the 1920s had consequences in the 1930s, as seen in the table below left side. When Mr Bear begins to take out the trash from everyone’s balance sheet, which is what happens in bear markets, and bear markets aren’t over until all the trash is taken out, I don’t see how we can avoid what is posted on the right side of the table below before Mr Bear finishes cleaning up Wall Street.
In the coming economic downturn, the success highly-leveraged companies will have in defending their dividend payouts is a fair question for prudent people to ask. That plus assuming dividend yields will follow bond yields upwards as the bond market comes under distress with rising defaults, is an absolutely reasonable assumption to make. So assuming Dow Jones dividend payouts will decline, and yields will increase is not the issue; but how far these trends will go until the coming bear market bottoms is.
Mark J. Lundeen


