My Brash Call for a Top
 share
share
 share
share
 share
share
 share
share
 share
share
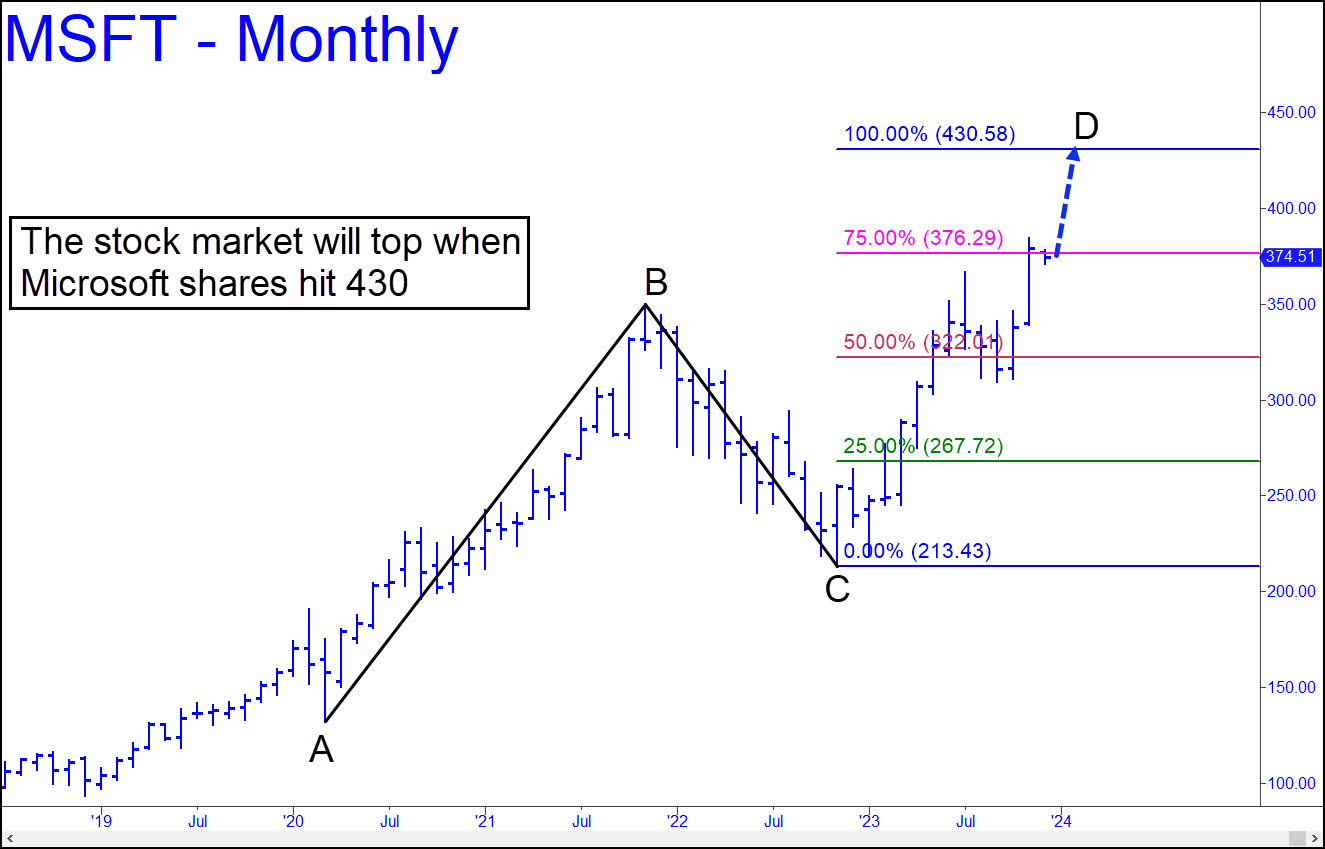
They don’t ring a bell at the top, as the saying goes, but it’s hard to see how Mr. Market can avoid it this time. The stock market’s heedless, nutty short squeeze since October will end when Microsoft hits $430, probably early in the new year. It’s that simple. How do I know this? Just a gut feeling. I’ve been paying close attention to charts for more than 40 years, and the one above looks like it can’t miss. It tells us two things with clarity and authority: MSFT will continue to rise until it reaches $430, a Hidden Pivot resistance; and, it will not surpass that number, at least not by much, without a major correction. Furthermore, because Microsoft shares, which are trading in record territory, have surpassed a laggard Apple’s as the #1 favorite of portfolio managers, the former cannot but serve as a reliable proxy for institutional mindset.
My high confidence that MSFT will reach 430 is rooted in the way buyers handled resistance at two crucial ‘Hidden Pivot’ levels: 1) at the red line, a ‘midpoint resistance’ at 322.01; and 2) at the pink line, a ‘secondary resistance’ at 376.29. Not only was the first level easily penetrated on first contact, it also became support thereafter, adding to the likelihood of a further move to 430.58. As for the secondary pivot, although it has yet to be decisively exceeded, the fact that it was exceeded at all strongly suggests the uptrend will continue. Also, the ABCD pattern is sufficiently clear and compelling that we can infer D=430.58 will show precise stopping power.
Ankles Grabbed
Mr. Market undoubtedly would love to rebuke (i.e., sodomize) me for being so confident. As the headline implies, though, I’ve willingly grabbed my ankles so that he can try. The pattern is what it is, and although it is not immune to a certain amount of tampering, it will not be easily subverted. Furthermore, the 430.58 target, which I wrote about here earlier, precisely corresponds to a 430.50 target tied to a lesser but still important ABCD pattern. Here it is, with a decisive penetration of p=369.98 that implies D=430.50 will be reached. Two big, bullish patterns projecting a move to respective targets that are almost identical is a coincidence too rare and dramatic to ignore. We’ll leverage this knowledge with a bullish trading bias until the target is reached, then short the bejeezus out of MSFT at its presumptive apex.
I’ve cautioned subscribers that Mr. Market at his most devious is capable of fooling us even when we’ve gotten everything right. Here’s an IBM chart from 2007-08 that illustrates this perfectly. Notice that the stock came within an inch of a bull-market target in June 2008. When the stock sold off sharply thereafter, it is not hard to imagine that bears would have celebrated. But Big Blue reversed precipitously to make a final top even closer to the D target; and then it collapsed. This could only have happened if everyone, bulls and bears alike, were caught with their pants down at the marginal new high. Forewarned is forearmed.
One more note that could be useful for timing purposes: If you’ve been looking for a news headline to drive a stake through the bull market’s duplicitous heart, it is bound to be one heralding a Fed pivot toward easing. Giving Wall Street exactly what it wants is a surefire way to end the craziness — a classic example of ‘Buy the rumor, sell the news.’
*********
share
share
share
share
share