Need for Objectivity
 share
share
 share
share
 share
share
 share
share
 share
share
Stubborn investors lose money. With this in mind, there is a need for objectivity here. At face value, the markets have spoken and the bears (including myself) have been proven wrong.
If the bears were wrong, why were we wrong? Why would overvalued markets rise from here?
There are three possible reasons:
- Weight of cash with lack of alternative investment avenues.
- Corporate profitability will rise faster than any of us can anticipate
- Inflation is about to escalate
If 1 above is true, there is no theoretical upside limit. The markets will rise like a helium balloon until the peaks vanish in the distance. Unfortunately, taking a view on this probability is not a decision making process that falls under the category of "investment". Personally, I am unable to participate sensibly in this type of debate.
If corporate profitability is going to rise, what will drive it?
There are two possibilities here:
- The ultimate driver of the economy could switch from consumer spending to government spending
- This spending will be funded by deficits - as opposed to taxes - which will be inflationary.
Which brings us, ultimately, to inflation.
Now, if we are to protect ourselves against inflation, investment in "hard" assets seems, at face value, to be a sensible approach.
Unfortunately, this does not address the issue of income. How will asset rich but income poor baby boomers survive in the coming years?
Government bonds?
The monthly chart below shows that 30 year government bonds are still within a 20 year rising trend. (ie yields are not yet rising).
How could this be possible if we are heading for inflation?
Short answer: It cannot. Either we are wrong about inflation, or yields are about to start rising.
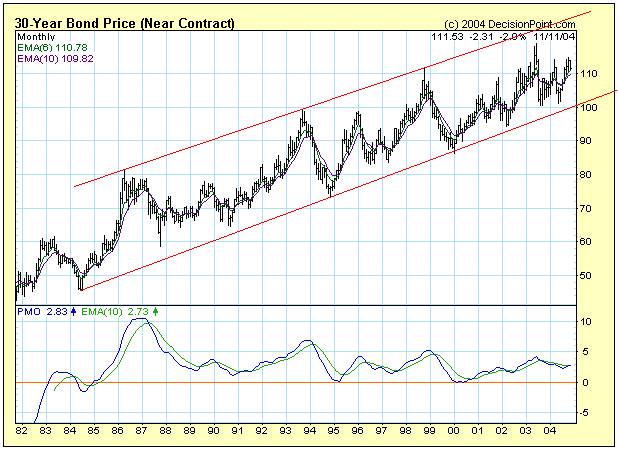
My conclusion following analysis the above chart patterns is that yields will not fall from this point. They may go sideways or they may rise, but the falling trend in the PMO - which is still intact after 20 years - will need to be penetrated on the upside for yields to continue falling. Such an occurrence would imply "collapsing" yields, and I cannot get my head around this concept. The probabilities are too small, and the consequence will likely be "Depression".
In any event, the equity markets are giving buy signals.
So, if it is unlikely that yields will fall further and, if yields do not rise - thereby eroding capital bases if investment is channeled into Government Bonds - we could expect to earn around 5% p.a. on our investment in long dated bonds.
One would have to have a strong stomach to invest in US Government bonds in the "hope" that yields do not rise from here - given the US Government deficits, and the US Sovereign Debt situation, and the size of the trade deficits (around 5% of GDP).
Regardless of whether the dollar swoons or recovers strongly as a result of short covering, the underlying fundamentals are not conducive to a long term recovery of the dollar relative to other currencies - so it would be a brave foreign investor that will invest in an environment of a double whammy risk to his capital
If yields rise he will lose capital and if the dollar weakens further he will lose capital.
Another possible answer to the question of income is: The market is "punting" on a solution from an investment in equities. This will protect against inflation AND generate income if, somehow, the underlying companies can keep pace with dividends.
Another possible answer to the question of income: Short term treasuries - if you can live on a 2% - 3% return.
Logic leads to the conclusion that the equity markets are either rising on a wave of misplaced hope, or on a wave of desperation flowing from an expectation of inflation.
At this point, it would be instructive to recap:
If the US government is going to become the primary driver of the US economy, the only way this could happen - and still allow the US to remain a participant in the world economy - is if yields rise, given the Government's escalating need for capital (assuming it borrowed this capital); or if inflation exploded - assuming it printed the money required to fund the expenditure. This, in turn, would lead to a collapse in the dollar and the wiping out of existing foreign capital values.
The above argument is taking on an air of surreality. Salvador Dali might feel at home here, but the pieces of the puzzle just do not fit.
Either the US is heading into a period of isolationism, or the markets are giving buy signals which cannot be believed.
The following chart (courtesy DecisionPoint.com) is providing an objective warning signal that the recent buy signals may not be as robust as they appear:
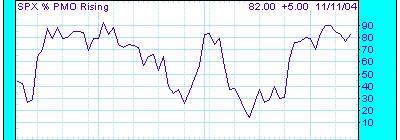
It shows an oscillator that naturally occurs as prices within the market ebb and flow. In short, it shows that as at November 11th 2004, 82% of Price Momentum Oscillators of the stocks that constitute the Standard and Poor Index were rising, but having bounced down from a peak of 90%. Yes, it is possible that the level could stay at around 80% - 90%, but history shows that the markets do not work in this way.
Another trading indicator is shown below
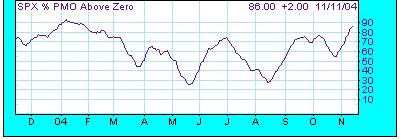
This one shows that 86% of PMO Oscillators of stocks making up the SPX index were above the zero pivotal line as at November 11th.
Historically it can be seen that oscillators - by definition - oscillate. i.e. The percentage of oscillators rising and the % above zero typically turn down after hitting the 90% level.
So where does this leave us?
In my view, it leaves us with an understanding that there are thousands of professional investors who are handling billions of dollars of Other People's Money which, by definition, they MUST invest - or return to their original investors. These people are forced to rationalize whatever information they process in order to justify their existence.
When George Bush was voted back into power, this was taken as a bullish sign and - notwithstanding the On Balance Volume Charts that had been falling for the period leading up to the elections - caused them to move back into the markets.
So, let's look once again at the daily OBV chart:

Objectively, it has also given a buy signal.
Equally objectively, it is still below its February peak
Overall Conclusion
Following the Presidential Elections, pent up demand was unleashed on a wave of relief, which caused the market to give buy signals that have yet to demonstrate that they have steam behind them. If the February high on the On Balance Volume Chart is penetrated on the upside, it can be argued that the bearishness of the preceding nine months has receded, and we will have entered a new - interim period - bullish trend.
Notwithstanding this, the short term technical indicators are pointing to a significantly overbought situation, from which the markets should pull back in the short term.
The jury is out, but we should be watching to see how significant the coming pullback will be. If the OBV chart remains in a bullish mode, we can expect the uptrend to continue. If the OBV chart aborts its bullish mode, then we could still be in for a severe reaction.
There is no way to second guess this particular outcome. We will have to wait and see.
share
share
share
share
share


