New Bull Market for The Dow Jones? Not Likely!


On Tuesday of last week (March 5), the Dow Jones closed above its last all-time high of 14,164.53 on 9 October 2007, when it closed at 14,253.77. As seen in the table below, each day since (until today), the Dow Jones made a new all-time high, and ended the week at 14,514.11. For my new readers, the “BEV” column below gives the percentage the Dow Jones is from its last all-time high, except when it registers a “0.00%”, which tells us that the Dow Jones closed above its last all-time high, which it did for eight consecutive days; from March 5 to 14.
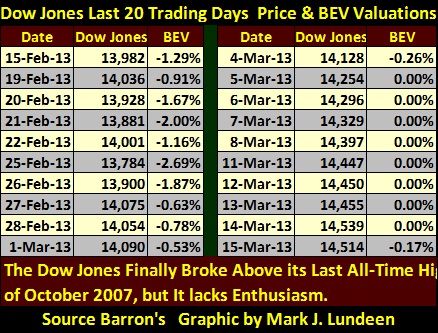
So is the stock market in a new bull market? I don’t think so. If Doctor Bernanke actually stopped supporting the stock market, it wouldn’t be long before we would once again approach the lows of March 2009. Look at it this way, after eight consecutive new all-time highs, the Dow Jones is only 2.47% above its highs of October 2007. What, only 2.47% into record territory after eight straight new all-time highs? For a new bull market, that seems awfully timid to me. Look at the daily gains in the table, each of the daily gains since March 05 are only about 50 points above the day before, and each new all-time high happened on low trading volume. Today the Dow Jones closed down some 0.17%, on trading volume that was 400% above any of the eight days seeing a new all-time high. It seems that the market is looking more for a reason to sell stocks than to buy them.
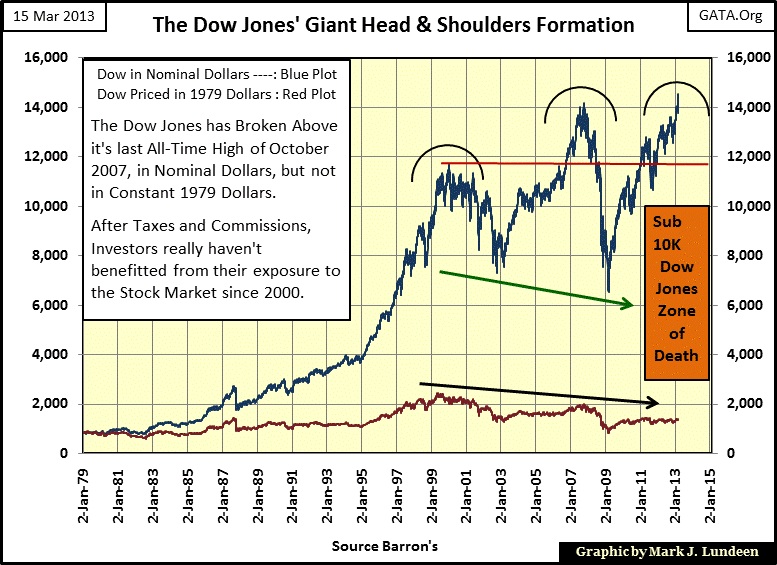
I’m still a stock-market bear, so seeing the Dow’s high of October 2007 taken out is not something that impresses me. The first thing I object about this new high is that the new high is only in nominal dollars. What good does the Dow Jones going up do for us if consumer prices are increasing faster? As we see in the red plot above, showing the Dow Jones in constant 1979 dollars, on an inflation adjusted basis, the Dow Jones is actually 42% below its last all-time high of August 1999. With all the money the Federal Reserve has created since 2000, this increase in the money supply has had to have an impact in market valuations somewhere in the economy. Unfortunately, raising valuations in the stock market have fallen far behind the price increases of basic commodity prices.
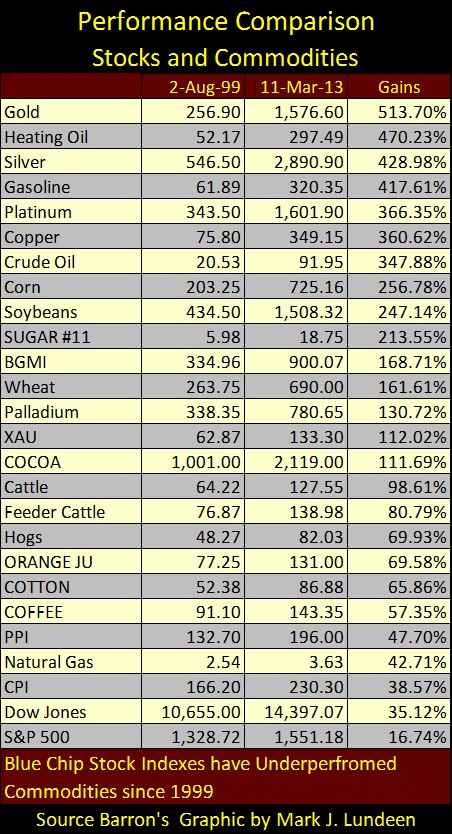
Look at energy and agriculture prices in nominal dollars since August 1999 (when the Dow Jones saw its last all-time high in constant 1979 dollars), with the exception of natural gas, they are all over 100% higher, with gains of over 300% all too common.
The gains in the Dow Jones have lagged far behind commodity prices, including gold which has increased by over 500% since August 1999, and silver by over 400%. Also, the gold mining indexes (BGMI & XAU) have outperformed both the CPI & PPI inflation indexes, but look who hasn’t beaten the government’s inflation indexes; the Dow Jones and the S&P500. For the past thirteen years, investing in the stock market has failed to provide investors with an inflation adjusted return, unlike commodities.
So while there is much being made about the Dow Jones making new highs in the media, just remember that the media has been very silent about the real bull market in gold, silver and commodities for the past thirteen years. This fact makes investing in the stock market a mug’s game, as the tax code forces you to pay tax on your nominal gains, even though you’re falling behind on a cost of living basis. For the Dow Jones to have done as well as gold since August 1999 it would have had to increase to over 54,000 in the past fourteen years.
Then there is the weird trading volume action in the stock market since 2000, where we see rising trading volume during stock market declines, and declining volume as the stock market advances. This can only be explained by market manipulation at the highest levels of government and finance.
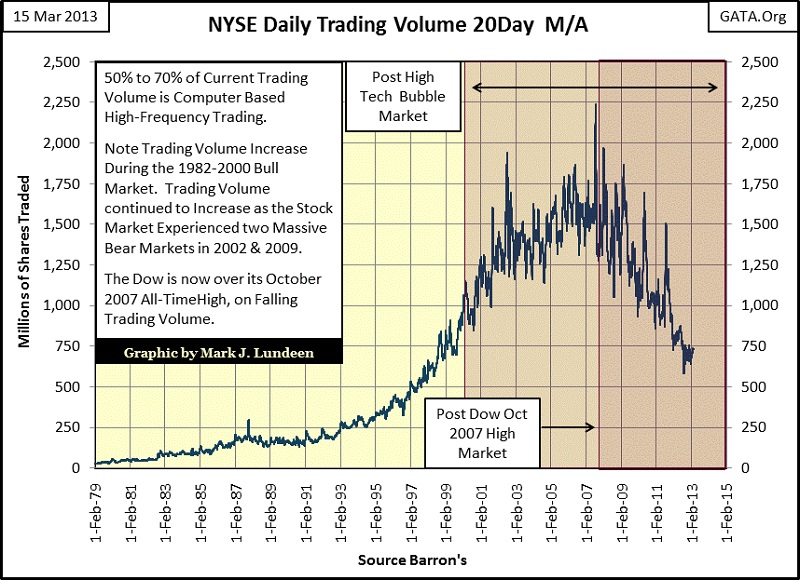
Seeing the Dow Jones reaching new all-time highs (in nominal dollars) on collapsing trading volume is bizarre, as is seeing declining prices on rising trading volume. Historically, trading volume collapses during bear markets as people flee rapidly deflating share prices. However, since January 2000, we’ve seen two bear markets (2000-02 & 2007-09), both occurred with rising trading volume.
In past articles I’ve noted this, and the only thing that can explain this violation in the law of supply and demand is that the Federal Reserve is purchasing shares in the open market during market declines to shrink the total number of shares (reducing supply) trading in the stock market. If I’m correct, how much of the stock market has been monetized? Something over 50% is my guess.
And then the earnings for the Dow Jones, and the S&P500, are strange too. Here is a chart plotting the Dow Jones’ earnings since 1929. The total collapse in earnings we see from August 2007-2008, is unique in the history of the Dow Jones, and alarming. Over $900 in Dow earnings just disappeared during the mortgage crisis, taking the Dow’s earnings into negative territory. The only other time this happened was at the bottom of the Great Depression bear market.
This happened at a time when the derivatives market was under great stress, so I expect that is why earnings for the Dow Jones simply vanished, because the thirty mature blue-chip companies in the Dow Jones saw their derivatives portfolio crater. Their earnings disappeared as the Dow Jones companies had to pay their losing bets to their casino; the unregulated and secret OTC derivative market.
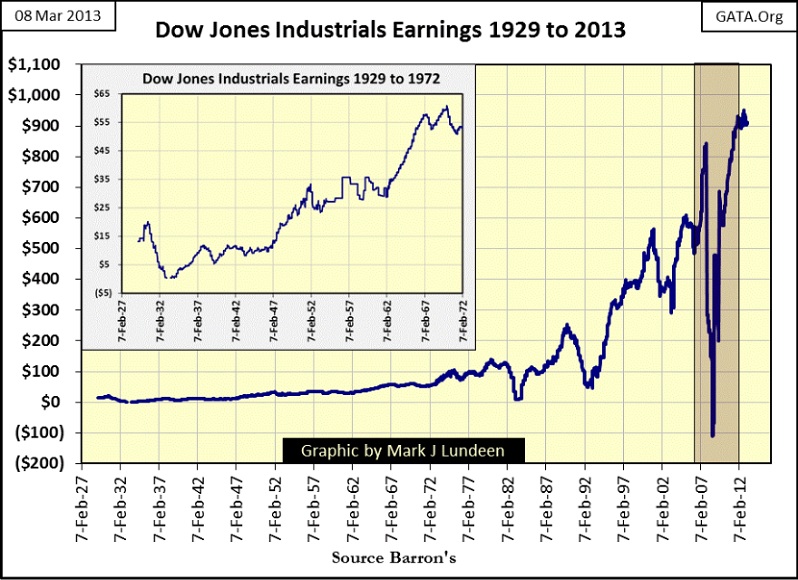
And then the rebound in the Dow Jones earnings since 2008 is also amazing. Exactly what was the source of this great profitability? The economy is struggling with massive levels of debt? In fact, the entire world is struggling with servicing its debts.
Unemployment has been a growing problem since 2007. That means that the economy has a lot of unused capacity, and that isn’t good for corporate profitability. When I really think about it, the current surge in earnings for the Dow Jones is harder to explain than its 2007-08’s decline. If the accounting standards, from say August 1982 when the stock bull market started, were still in place, I doubt the earnings for the Dow Jones would be anywhere near new all-time highs. Ultimately, the stock market in 2013 doesn’t appeal to me in the least because it seems that its rising valuations are mostly due to dishonest accounting and market intervention by the Federal Reserve.
However, for all their presumed problems the media constantly reminds us about gold and silver, the old monetary metals are still a better place for you investment funds than the stock or bond markets. First of all, where the stock market is being managed upwards, commodity prices, including the price of gold and silver and the US Department of Labor’s Consumer Price & Producer Price inflation indexes are being managed downwards (see CPI & PPI in the table above).
When our current market manipulation ends, I expect those valuations currently being increased beyond their fair value will come crashing down. That will be a horrible day of reckoning for investors in stocks and bonds, which includes pension funds and insurance companies. The opposite will happen with those items that saw their valuations pushed below their natural market prices. Seeing gold and silver outperforming energy and agricultural commodity prices in the table above for the past thirteen years is something that I expect will continue for years to come. We live during an era when the Federal Reserve has committed itself to a QE to Infinity policy for as long as it takes to return the markets and economy back to the boom-times of the 1990s. And that is something that is not going to happen again in the life time of most people living today.
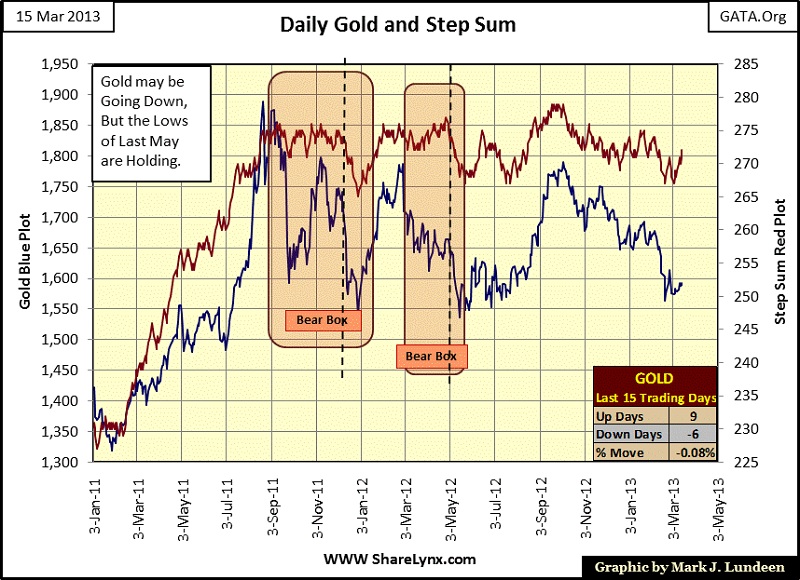
Let’s look at Gold’s step sum chart. This chart could look better. Currently gold and its step sum are trending down, but show signs that they are they have found a short term bottom. We should note that at present levels, gold is still above its lows of last summer, and December 2011. In fact at no time in its current decline did gold decline below these previous bottoms. That’s a good sign that maybe the bottom in our current correction has been in place since May of last summer.
Let’s move on to gold’s BEV Chart.
Gold’s step sum chart looks bearish, but the fact is gold is only 15.74% below its last all-time high. That really isn’t much, so why is everyone so down on gold? I think it’s because it hasn’t seen a new all-time high since August 2011; a year and a half ago. Well I hate waiting too, but I note that for all the time the “policy makers” have had their way with gold, the current correction has been the shallowest since 1999. Look at the chart below to see my point.
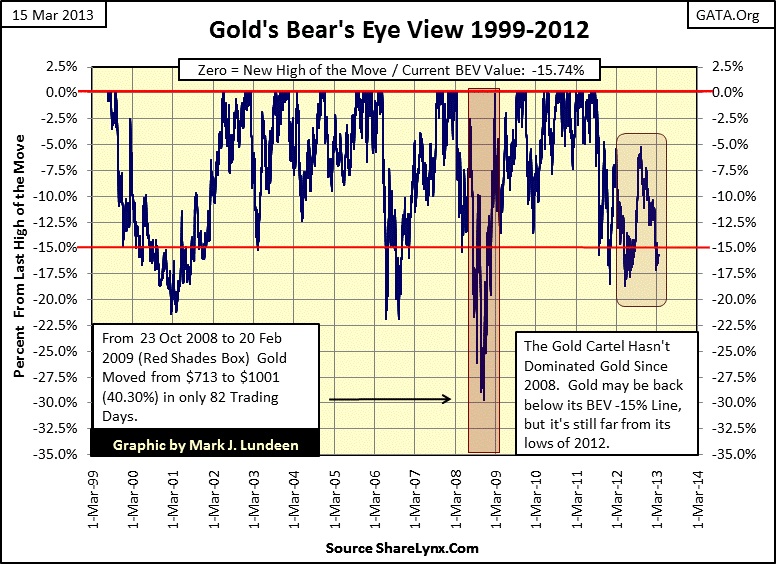
But this correction has been different from the other major corrections seen above; the other corrections bottomed, and then worked their way up to a new all-time high. Our current correction has bottomed four times below its BEV -15% line, and then the price of gold rose up to its BEV -5% line three times before being forced down again. This isn’t natural, but something to be expected in a market dominated by the global central banks. The CBs are inflating their money supplies in a reckless manner, and have been doing so for decades. Rising gold and silver prices are a failing grade for their “monetary policies”, so they suppress gold and silver prices in the paper futures markets where very little gold and silver actually changes hands. But these phony prices concocted in the paper markets isn’t something that can go on forever as demand for actual gold, and silver, are much higher than they would be at higher natural prices. The day will come when a big bank shorting the gold market will be unable to fill an actual order for metal at the price found on the COMEX paper market, and then things will get very interesting.
These central banks are not all powerful. If they were, the current gold correction which began in August 2011 would have declined far below its BEV -20% line, but as we can see in the chart, this is something they have tried, but failed to do four times in the past two and a half years. It’s only a matter of time before gold breaks decisively above its BEV -5% line, and resume its bull market.
Look at silver’s step sum plot. Except from May 2012 to November 2012, no matter what the price of silver is doing, and it is usually going down in the chart below, its step sum is going up. What does that mean? Market sentiment for silver is excellent. So far this bullish market sentiment has not been able to lift the price of silver above its high of April 2011, but when silver finally does take off I expect we’ll see historic daily moves to the upside. Unlike gold, silver has huge industrial demand, and industry will pay whatever the price the market asks to obtain the silver they need. If an automotive manufacturer uses $35 of silver to make a $40,000 car, do you believe they will stop buying silver if prices rise where it now costs $350 in silver to produce a $40,000 car? And going without silver is out of the question for most of industry, as silver is used for its unique physical and electrical properties.
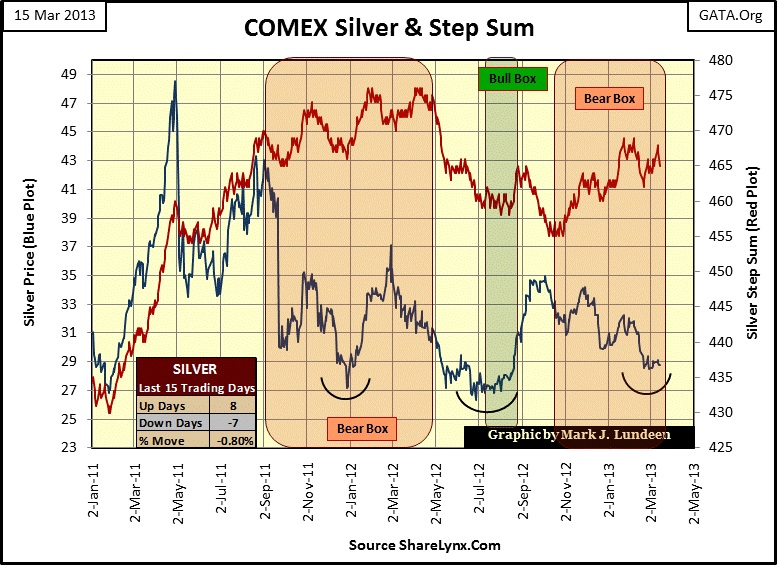
Looking at silver’s BEV chart, we see the same pattern we saw in gold’s BEV chart; unlike silver’s previous corrections where it made a sharp-V-bottom and then began to rise up to a new high of the move, the current correction keeps attempting to make a new bottom.
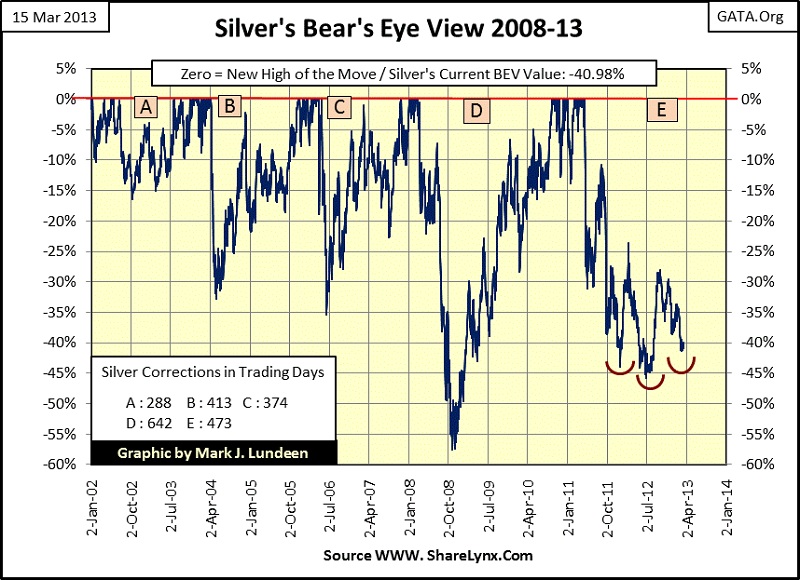
Why is this? Well, I suspect the “policy makers” fear the consequences of silver making its first new all-time high since January 1980. After more than three decades, that has to be big news, the type of news that would attract lots of new investors in the silver market. JP Morgan has a huge short position in the paper COMEX silver market, and rising silver prices is a big problem for them. If demand for physical silver overwhelms JP Morgan’s ability to keep the price of silver contained in the paper market, you’ll see it in the news.
Mark J. Lundeen


