New Highs For 2017? Yes, But Only Until...


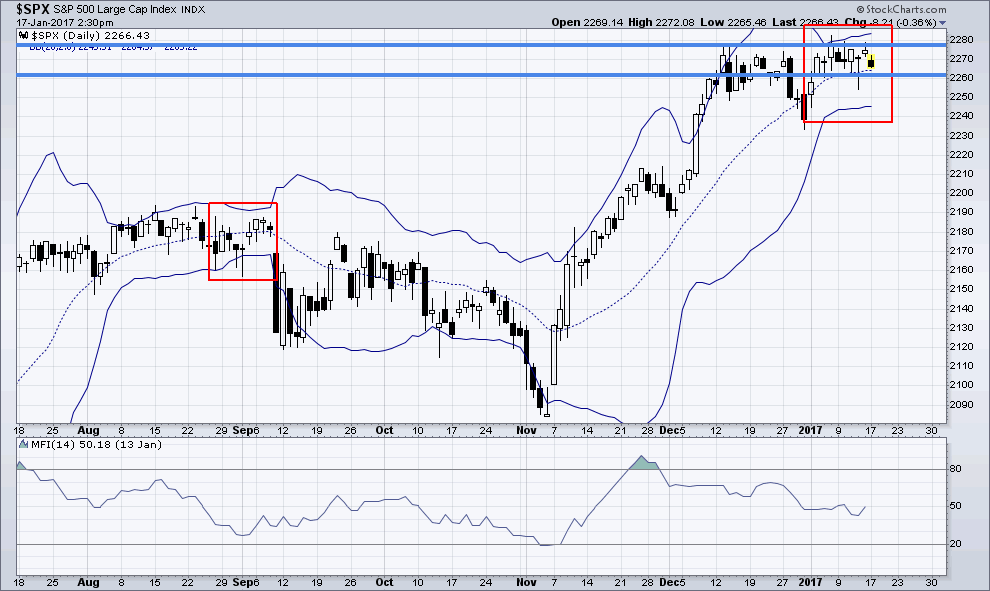
When the SPX breaks out above its current resistance level, it will be the next leg up in this bull market. We are currently in a consolidation period. The SPX seems to be resting for now! The "Bollinger Bands Squeeze" is now taking hold and will result in a powerful move in either direction once broken. I do have a new BULLISH trigger for members to enter into during this amazing "melt up" that will only be shared with my 'elite members'. I can assure you that you will want to be invested in this next BULLISH leg of the SPX!
The Next Move UP!
'Bollinger Bands' Are One Of My Most Preferred Tools Of Technical Indicators
The "Squeeze",(http://www.investopedia.com/articles/technical/04/030304.asp?lgl=bt1tn-baseline-below-textnote) occurs during low levels of volatility as the 'Bollinger Bands' narrow. These periods of low volatility are followed by periods of high volatility. Therefore, a volatility contraction of the bands can foreshadow a significant advance or decline. This is one of my best kept secrets of technical analysis, until now!
Financial markets are now awaiting what the new Trump Administration has in store. These markets do not like "uncertainty". So far, President-elect Trump has announced a direction of deregulation and lowering the tax bracket for corporations and repatriation of all corporate money (http://www.investopedia.com/terms/r/repatriation.asp) that is held overseas in foreign bank accounts.
The 'ISI Research Study' revealed that the "U.S. S&P 500 companies now have $1.9 trillion parked outside the country". Most likely, said funds will be applied so as to continue the stock buyback program thereby pushing the SPX to new levels that are ridiculously overpriced. Hot money 'continues to be supporting the rise in equity markets. I share some of these hot money sectors and stock on my StockCharts.com public list!
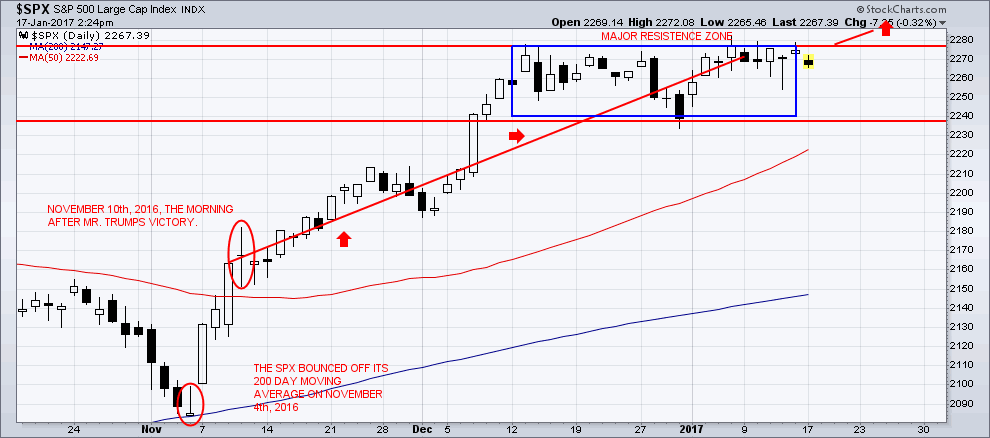
Trump's Victory Speech on November 9th, 2016:
"We are going to fix our inner cities and rebuild our highways, bridges, tunnels, airports, schools, hospitals. We're going to rebuild our infrastructure, which will become, by the way, second to none. And we will put millions of our people to work as we rebuild it. We will also finally take care of our great veterans".
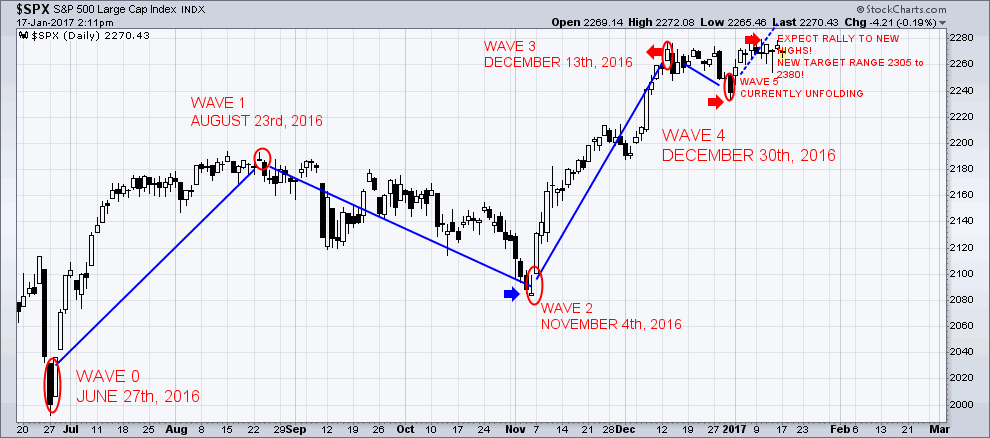
Chart of the SPX "melt-up':
Are There Too Many Happy Investors?
The US stock markets have been on a run since the U.S. Presidential election last November 9th, 2016.
US stocks continue to see signs of "optimistic extremes". The risk of buying on emotional decisions is still currently high.
There is no interest in shorting. The number of shares sold short, in hopes of buying them back at a lower price, has collapsed. The SPY fund (https://us.spdrs.com/en/product/fund.seam?ticker=SPY), short interest is the lowest since the summer of 2007. Individual stocks are also showing a lack of short sales which, in turn, removes a pool of potential buying interest. A "de-trended" version of the short interest ratio has dropped to a level that has led to negative returns for stocks which will happen, but likely not for many month yet. The market is likely to grinding higher before a big correction takes place.
A new high presented itself on a day that the jobs report missed expectations. On January 6th, 2017, the jobs report came in less than what economists' expectations were. However, the SPX powered to a new high of 2276.06. This may seem like good news, but during prior times that this occurred, stocks usually pulled back over the following weeks.
Stocks have drifted higher even after optimism reached an extreme. 'Dumb Money Confidence' exceeded 80% but the SPX has added on more gains without any kind of pullback. This type of buying pressure, after an extreme optimism sentiment, has previously occurred only a handful of times. It has usually led to losses as the late buyers became "exhausted".
Investor Confidence Is So High They See No Need To Hedge Their Positions
The Equity Hedging Index has declined to its' lowest level in nearly two years, showing a lack of interest in the various ways that investors use to protect themselves from possible market declines.
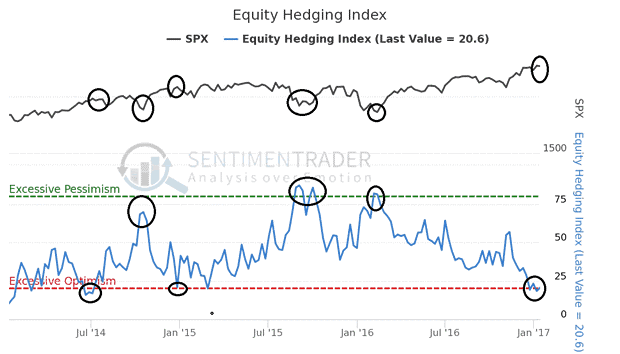
This chart is a contrary indicator. The higher the Equity Hedging Index, the more likely it is that stocks will rally going forward. The lower the Equity Hedging Index, the less likely that stocks will rally.
Conclusion
Hopefully, Trump's business experience will translate well into his new position. It is certainly my hope that he is as successful as possible. Even during the campaign Trump spoke about how stocks were in a giant 'bubble'. This euphoria that we have felt, since his election victory, has made that 'bubble' even larger. Throughout US history, every 'giant financial bubble' has always ended very badly, and this time around will not be an exception. Trump may get the blame for it when it bursts, but the truth is that the conditions for the coming crisis have been building for a very, very long time.
I expect the stock market to stall out mid-way this year in June/July at which point things could turn south.
********

Chris Vermeulen has been involved in the markets since 1997 and is the founder of Technical Traders Ltd. He is an internationally recognized technical analyst, trader, and is the author of the book: 7 Steps to Win With Logic
Through years of research, trading and helping individual traders around the world. He learned that many traders have great trading ideas, but they lack one thing, they struggle to execute trades in a systematic way for consistent results. Chris helps educate traders with a three-hour video course that can change your trading results for the better.
His mission is to help his clients boost their trading performance while reducing market exposure and portfolio volatility.
He is a regular speaker on HoweStreet.com, and the FinancialSurvivorNetwork radio shows. Chris was also featured on the cover of AmalgaTrader Magazine, and contributes articles to several financial hubs like MoneyShow.com.


