With No Understanding of the Past, We Have No Future.


I’m constantly on guard not to bore my readers with tedious, repetitious comments week after week. However, with the markets acting as they are, it’s impossible not to be repetitive as the markets are mostly a repeat of the previous week’s action. How long have I been commenting on the Dow Jones’ inability to break above its last all-time high of October 2007? For over a year now. As far as I’m concerned, any time the Dow Jones is in a bull market and finds itself within 10% of its last all-time high (October 2007), it is in scoring position to take out its previous all-time high. To see the point I’m making, look at the Dow Jones’ BEV chart below from 1996 to 2000. This is what a bull market looks like; many new all-time highs (BEV Zeros) with frequent corrections that come from nowhere, and ends quickly.
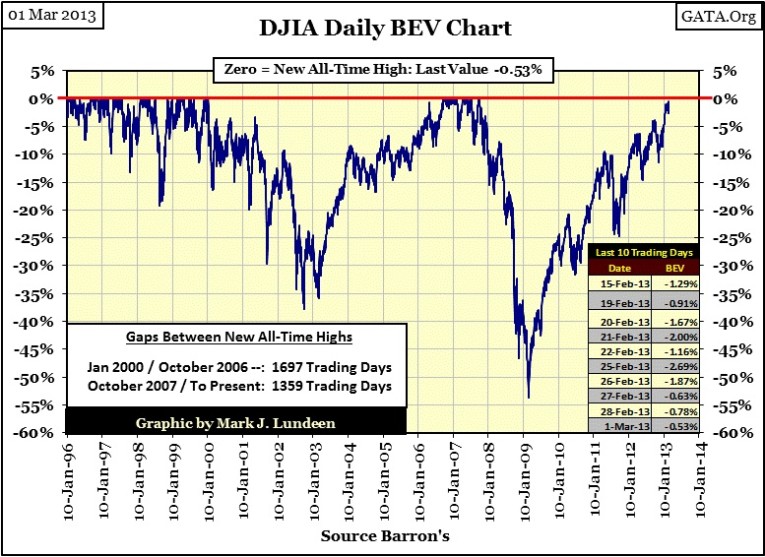
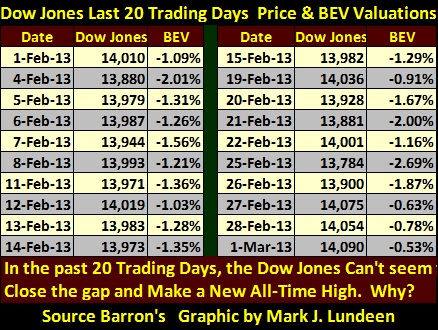
Look at the table below displaying the Dow Jones’ BEV values of the last twenty trading days. If the stock market has been in a true bull market since its 09 March 2009 bottom, it’s inexcusable for the Dow Jones to have been so close to breaking above its last all-time high of 09 October 2007 (14,164.53) yet has consistently failed to do so for the past two years. This is especially evident in the past month. Look how close the Dow Jones came to taking out its last all-time high of 2007 all month long. Today the Dow closed with a BEV just half of a percent from of making market history. What is going on?
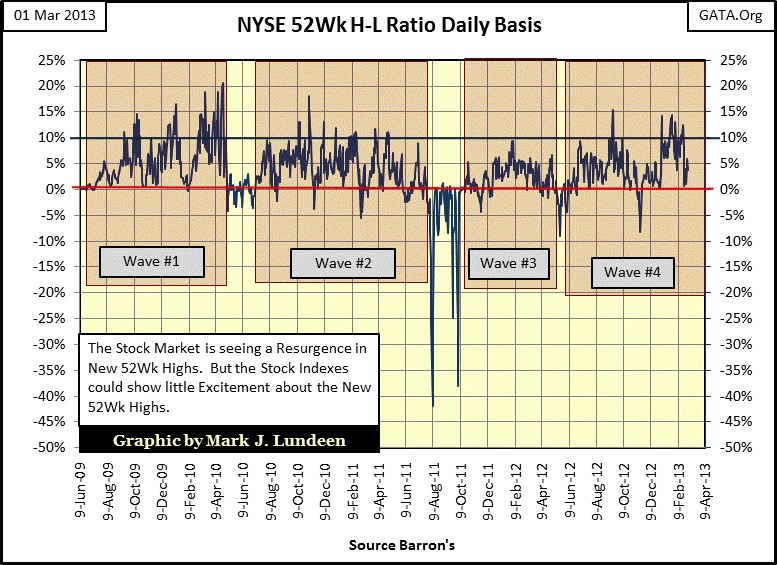
From the perspective of new 52Wk highs on the NYSE, the market is showing remarkable strength. Look at Wave #4 in the chart below. Since mid-December 2012 (last two months), the NYSE 52Wk High – Low Ratio has seen many days with the ratio above 10%. We haven’t seen anything like this since Wave #1, a time when the stock market bounced strongly off its March 2009 lows. The Dow Jones made excellent advances during Wave #1. So what was the problem with the Dow Jones doing something spectacular this week; like making a new all-time high in Wave #4? I’m not predicting that the Dow Jones won’t make a new all-time high next week or next month. What I’m notingis that unlike the 1990s, and even during 2007, where the rising Dow Jones created considerable excitement in the news, today there appears to be ZERO PASSION in this “bull” market.
I don’t really know exactly why the stock market is behaving this way, but I do know the stock market’s valuations are managed by Washington and Wall Street. When anything is managed, the managers always do so with some purpose in mind. What could it be that the “policy makers” are trying to accomplish with the stock market? Is what we see above a success or failure of “policy?” I believe it’s a success. With all the problems the world of finance faces today, is seeing the Dow Jones and the American Stock market really taking off as it did in the 1990s something the “policy makers” want to happen in 2013 and beyond? I think not!
We should keep in mind what the “policy makers” themselves have told us is the actual goal of “policy”: “STABILITY IN THE FINANCIAL MARKETS”, and stability is boring. I can tell you something that won’t be boring; when the financial markets break free from the meat hooks of the “policy makers”, their “stability” will become Mr Bear’s instability, and you won’t need me to tell you when that happens.
Let’s take our weekly look at gold and silver, first gold. Gold’s step sum chart is still bearish. What will it take to make this chart bullish? Gold’s price and step sum trends need to go up briskly! But the best thing that could happen would be to see the price of gold rise up as its step sum plot continues to turn down. It other words, have gold and its step sum begin to form a step-sum bull box.
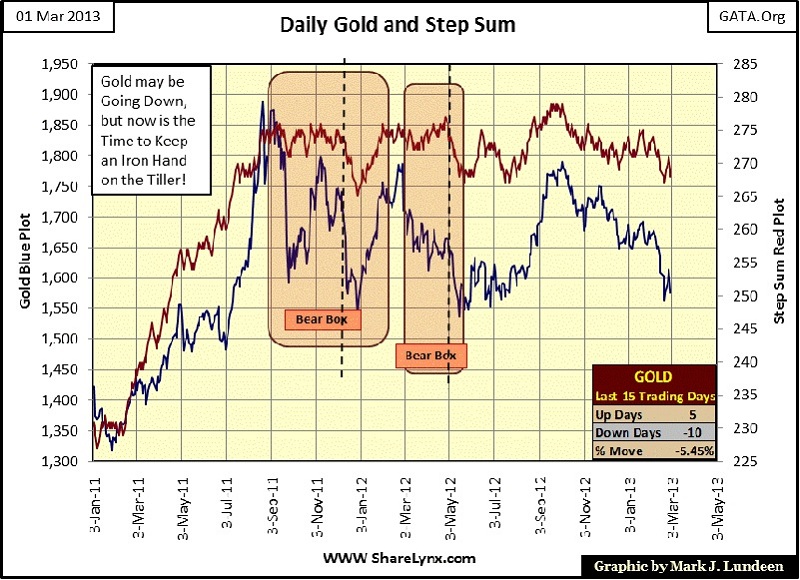
I note how the two plots bottomed on February 20, and reversed upwards a bit, and then turned down again, but not below their lows of February 20. That is nice to see, but I don’t make too much of it as overall this chart is currently bearish. What we need to see is some real market strength, like what we saw in this chart from July to October 2012. Better yet; from February 2011 to late August 2011!
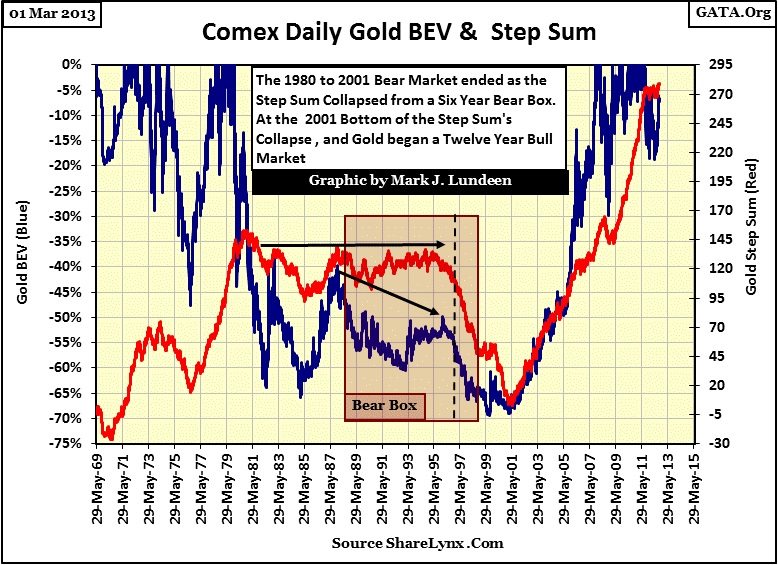
Is it possible, as reported by the financial media, that the gold bull market is over? No way! Below I have a Bear’s Eye View (BEV) plot of the price of gold (Blue Plot) and gold’s step sum (Red Plot) going back to 1969. The corrections in the 2001-13 gold bull market have been insignificant compared to the corrections of the 1969-80 bull. Still people complain, as they always do! And then look at gold’s step sum plot since 2001. Gold * IS * in a massive BULL MARKET, that is currently is taking a rest.
This always happens in any bull market that spans decades. The Dow Jones bull market of 1982-2000 also saw corrections that took years to complete. Why would anyone believe it would be different with our gold bull market?
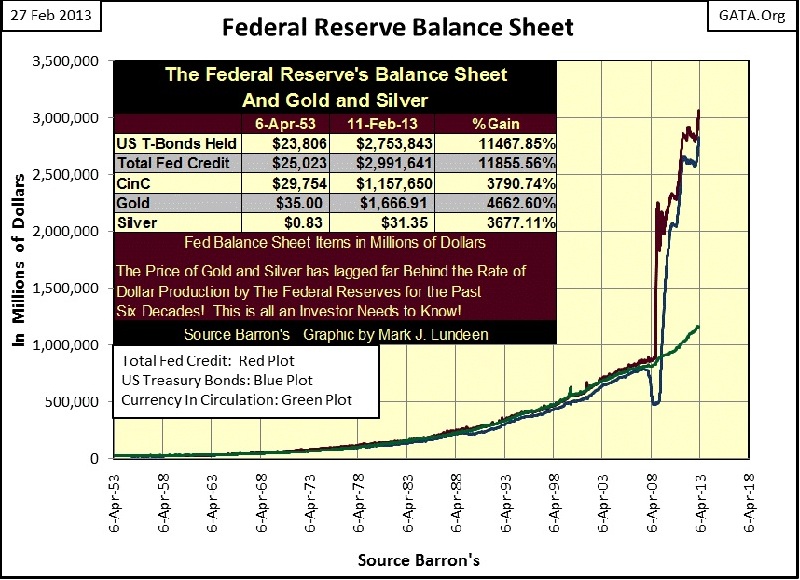
How can I be so sure that the price of gold will someday again charge upward, far above its last all-time high of $1888? Because the Federal Reserve is now in the hands of a quack-monetary moron! Look at the Fed’s balance sheet in the chart below. This reckless expansion of the money supply is unprecedented in the 100 year history of the Federal Reserve! By itself, this chart guarantees that ultimately gold and silver have only one way to go – to the moon! I’m not saying that gold and silver have seen their lows of the current correction, as I don’t believe they have. But someday the inflationary pressure beneath gold and silver will be fully expressed and the prices of the old monetary metals will be higher than anyone today can predict.
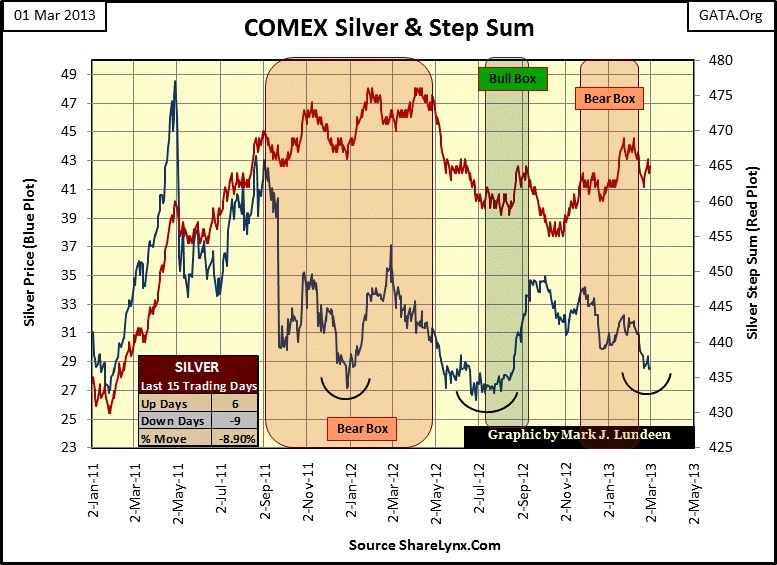
Here is silver’s step sum chart; my comments on silver’s step sum chart are about the same as for gold’s. But with one additional comment that stands for both metals: even with all the negative vibrations currently present in the gold and silver markets both are still a respectable distance from their lows of last summer. Well they just are. So, I have to wonder why everyone is so pessimistic about the future prospects for gold and silver? I know exactly why; everyone is watching CNBC with the volume turned up.
If you keep this up, someday CNBC will report on a government funded study proving that gold and silver investors are 100 times more likely to blow their brains out than investors in blue chip stocks. It may even be true because of the dis-information gold bugs have absorbed from watching & listening to CNBC and other “mainstream” financial news outlets. PLEASE, PLEASE, PLEASE, before you do anything you and your family will regret, study the chart below!
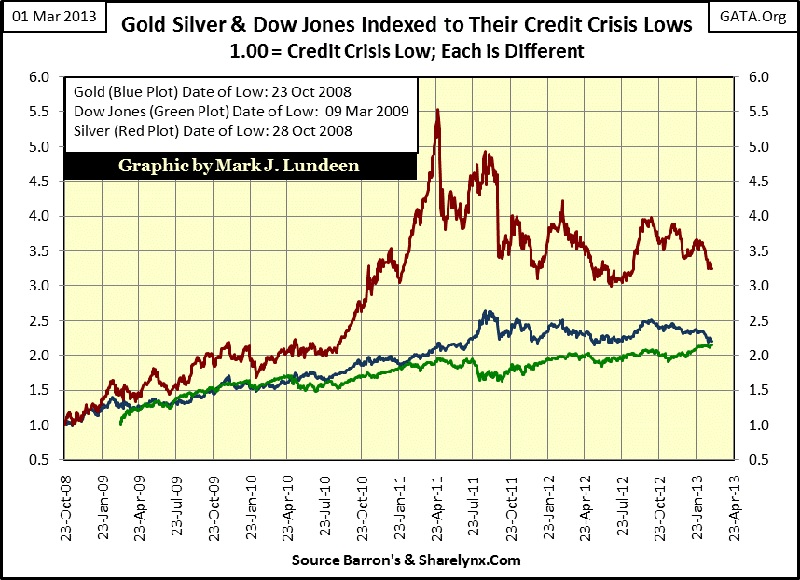
This chart shows the indexed performance of gold, silver and the Dow Jones from their credit crisis bottoms. Note how gold and silver turned up months before the Dow Jones did. And look at what silver has done over the past four years! Even though silver is in a significant twenty-two month correction, it still blows away what the Dow Jones has done since 2009. And as for gold, since January 2011 (two years) it has outperformed the Dow Jones to this day! How can CNBC report bullish news on the Dow Jones, a market index that’s struggling to break a five year old all-time high, yet be pessimistic on the old monetary metals which have made multiple new all-time highs in the last two years? Well, the media is stuck-on-stupid because they don’t check-out these things for themselves, but pass on their “experts” advice unfiltered to the public.
Make no doubt about it, I’m sick and tired of the current action in the gold and silver markets, but I realize that the old monetary metals have still been one of the best investments investors could make since the credit crisis, no matterwhat CNBC “experts” would have us believe. Think of the current correction in gold and silver as a buying opportunity. I haven’t a clue when the old monetary metals will break out of their current funk, but when they do, the wait will be well rewarded.
The average American has no sense of history, sad but true; people concentrate mostly on what is happening today. Yesterday means little to most people, and as for tomorrow, it doesn’t yet exist. For a government like ours which justifies its actions based on the opinion of an uninformed electorate with no memory of Washington’s past blunders; this makes the American people the best sample population they could ask for on election-day. There is great danger in this for the average citizen, because if the establishment can rewrite history, one can change what people believe today, and eventually allow those in power to take the country to places it never should go. Legislated “economic stimulations” by politicians and Quantitative Easings to Infinities by the Federal Reserve serve no real purpose other than delay a crisis until after the next election.
This is very unfortunate as humans do have the unique ability to consider the past and project likely possibilities into the future. This God given ability is essential if one is to be successful managing investments from one decade to the next. After all, the high-tech stock bull market ended in January 2000, with gold and silver being “THE NEXT BIG THING” ever since 2001. Not that the financial media have noticed after thirteen years. So let’s have a look atmonetary history to gain some insight into what yesterday can tells us of tomorrow’s possibilities.
The chart below plots the US Treasury’s gold reserves (Red Plot/Right Scale) and the percentage of the US National Debt the Federal Reserve has monetized (Blue Plot/ Left Scale) from 1938 to today. From 1938 to the beginning of World War Two, we see the US gold reserves increasing as Europe’s central banks began to shift their monetary gold to the United States for safekeeping from invasion by Hitler’s Germany. Remember, back then gold wasmoney, and paper money (like our Federal Reserve Notes) was only a claim to money (gold).
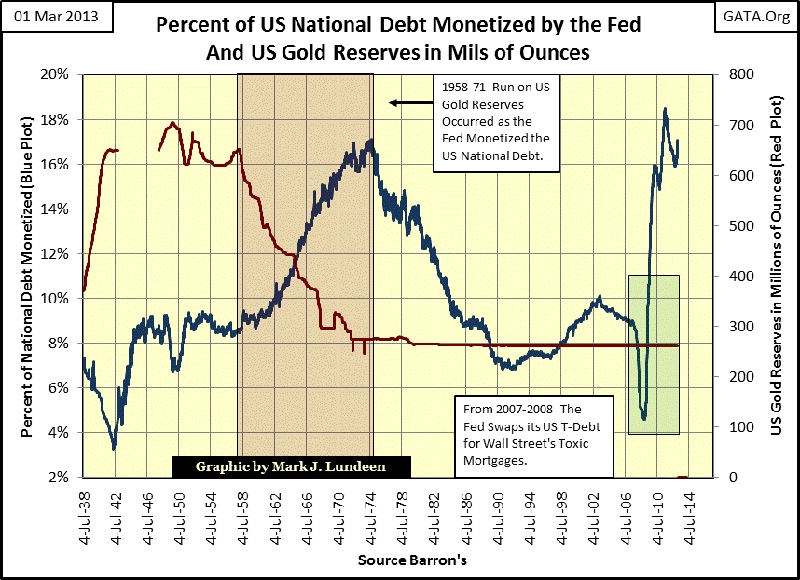
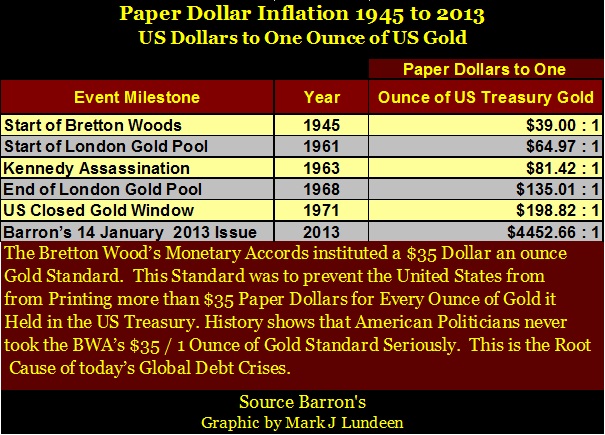
After the war, Europe saw no need to take back their gold. The urban-myth that the French began a run on the “US Gold Reserves” from 1958 to 1971 was, and still is widely believed, when in fact it was the US Government that was responsible for the run. Look at the table below; by printing more paper dollars (each a legal claim on the US Treasury’s gold reserves) than they had gold on deposit, the US created the situation where a run on “its” gold would become unavoidable.
In fact, what France and many other European nations did was deposit their gold in the NY Federal Reserve Bank in the late 1930s for safe keeping, taking $35 paper dollars in return for each ounce of gold they deposited. After the war, When France saw the US Government printing more paper dollars (each a legal claim on the Treasury’s gold, including France’s portion of it), France began demanding their gold back, by returning $35 paper dollars to the US Treasury’s gold window, for each ounce they removed from the NY Fed. At the time, gold was already selling for $42 to $44 in Paris and Zurich commodities market, presenting an opportunity for arbitrage, and motivating the French to repatriate their foreign exchange dollars for bullion. Barron’s, an excellent source to study monetary history, reported on this in 1951.
Paris – The Paris gold market is worrying the U.S. Treasury. In recent months, the free gold price has been 20% to 30% higher than the $35 an ounce: dollars are therefore, cheap in terms of gold. To depress the gold price, the French treasury has been selling gold for dollars. Having acquired the gold from the U.S. or through the European Payment Union, at $35 an ounce, it (France) reaps tidy arbitrage profits. Although the French support the dollar, our Treasury resents the way they have turned the gold market into a source of dollar gains.”
- Barron’s World at Work Column: 29 January, 1951
The current war on rising gold and silver prices began long ago!
Foolishly, Germany didn’t follow the French lead decades ago, and look at the problems they are having now getting their gold back from Uncle Sam six decades later!
For a long time, since 1945, American “monetary policy” has been one of deliberate malfeasance. It is important to keep in mind that the Bretton Woods Accords (BWA) were ratified and passed into law by Congress and the President in 1945. Its $35 an ounce gold clause is still the law of the land. It cannot be repealed with a simple Presidential executive order issued in 1971! The fact that the IMF and World Bank still operate within the United States, and the US Dollar is still the international “reserve currency” is only because the BWA is still in effect. The only aspect of the BWA that Nixon canceled was its most important; the gold convertibility clause. With the ratification of the Bretton Woods Accords, the US in 1945 promised the world that it would only issue $35 paper dollars for each ounce of gold held by the US Treasury. As the table above clearly illustrates, a more accurate description of American “monetary policy” since WW2 is one of deliberate and criminal malfeasance.
Back to the chart above; in the Red Box we see the “run on the US Gold Reserves” for what it really was; an inflationary event driven by the Federal Reserve monetizing an additional 10% of the US National Debt.
But this chart minimizes what actually happened between 1938 and 1971. In July 1938 the US National Debt was only $37.1 billion dollars. Warren Buffet’s net worth is now greater than the entire US National Debt in 1938! I see these things, these inflationary perversions and my mind reels! Where’s the media’s outrage? Oh I forgot, they are still stuck-on-stupid. Anyway, by the time “Nixon closed the Gold Window” in August 1971, the big spenders in Washington had increased the National debt to $412.83 billion dollars, at a time when gold was still legally money and pegged to $35 paper dollars an ounce. No wonder the US saw a run on its gold. And as is so typical of Washington, they blamed the consequences of their incompetent “policies” on an intended victim who successfully slipped from their grasp: Charles de Gaulle of France.
This didn’t happen in a vacuum. Barron’s for decades had devoted much ink on paper to document this exact subject. Here are a few of the many articles on the US Dollar and Washington’s corrupting influence on the Post WW2 monetary system published in Barron’s decades ago.
“We hope that the government of the United States, despite the big spenders, and the gold tinkerers, maintain a sound dollar, a dollar worth saving, a dollar worth earning, and a dollar that can be traded in any part of the civilized world.” - Barron’s World at Work, 02 January 1950 issue, Front Page
* * *
“The greatest thing we have to fear in the economy is a spreading fear as to the future of the dollar.”
- Edwin G. Nourse: Former Head of the President’s Council of Economic Advisors. As reported in Barron’s Editorial for 29 January 1951
* * *
“Solvency in international affairs is, of course, measured largely in gold and by this hard standard, the U.S. for many months has been losing ground. ---
“The long years of inflation, it would thus appear, are coming home to roost. In such circumstances other governments have chosen some of the classic remedies available, including tighter credit and fiscal policies. But this country, even under the G.O.P (Republican Party), has not yet nerved itself to swallow so bitter a pill.
--- “Yet in the end all nations, no matter how rich or powerful must play the game by the rules or suffer the consequences. It’s time Washington took heed of its dwindling stack of chips.” (U.S. Treasury’s gold bullion reserves)
- BARRON’S Editorial: 20 September 1954
* * *
“Before long, if the U.S. fails to mend its financial ways, the deficit in the balance of payments is likely to reach the critical point where the outflow of gold, currently an intermittent trickle, again swells into a flood. For several years the money managers, vis-à-vis national solvency, have been taking what they have described as a calculated risk. To this observer, however, it has come to seem more and more like a reckless gamble with the nation’s future.”
- BARRON’S Editorial: 06 November 1961
* * *
“To serve as a central banker, as BARRON’S again reminded its readers early last year when G. William Miller took over at the Fed, one needn’t be a flim-flam man, but it helps.” - Robert M Bleiberg: Barron’s Managing Editor, 11 June 1979
As I’ve mentioned previously, history is important. The incompetence displayed over and over again by Washington and Wall Street for decades has been totally forgotten by our culture. So, if the economic establishment today continues to believe that the solution to all economic problems is turning a hose of “liquidity” on it, it’s because the general population doesn’t remember a time when the money supply was limited by its gold reserves, or that daily marking to market of all bank assets was required, and that once upon a time, bankruptcy (not bailouts) was used to sanitize (not monetize) the debt market of unviable debt. Hell, illiquid assets are currently the Crown Jewels of the Federal Reserve’s balance sheet. This won’t last forever!
We have arrived at our current point in time after traveling a long dreary road towards insolvency, with few people in or out of the world of finance and politics understanding the true root cause of our malady: that Washington, over many decades, is guilty of murdering the gold standard in the first degree (murder with intent), and then in 1971, began a paper money inflation on an unprecedented scale. This monetary malfeasance has happened before. The next quote is by William Durant as he discusses an inflationary paper money disaster from 10th century China.
"Such were the sources of that flood of paper money which, ever since, has alternatively accelerated and threatened the economic life of the world."
-William Durant: Our Oriental Heritage, (1935) pg 780
Next; Durant sums up money and banking since the beginning of history.
Bankers know that history is inflationary and that paper money is the last thing a wise man will hoard. - William Durant
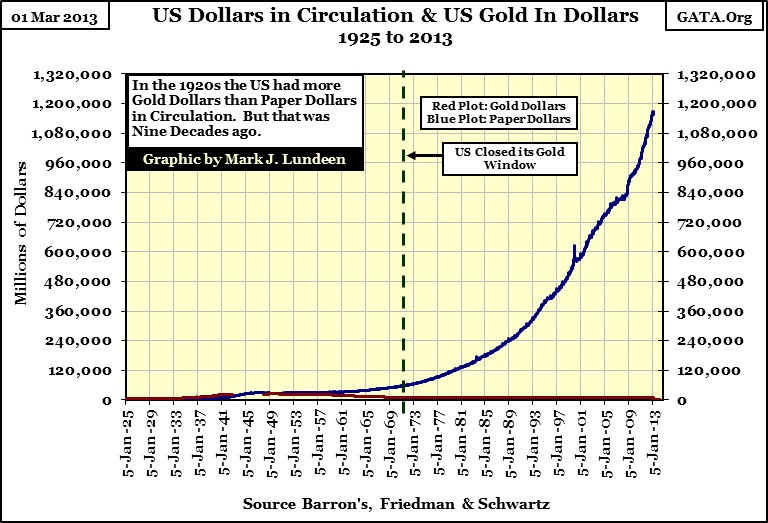
Next are a few charts I occasionally publish on the US gold reserves and the growth in the supply of paper money (Federal Reserve Notes) issued by the United States. These charts run from the time when the dollar really was as “good as gold” to now, when the dollar is only as good as political necessity needs it be.
Note how each of the three following charts begins at 1925, and the only change with the second and third charts are their termination dates.
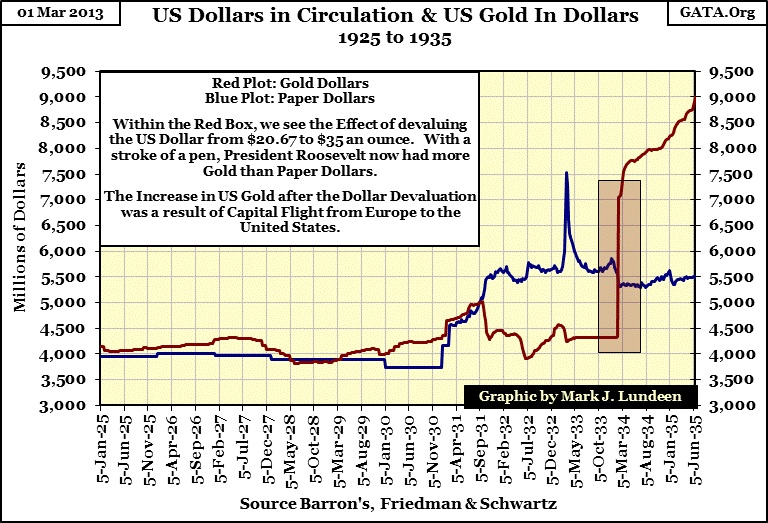
In the chart above, note how closely the number of paper dollars were matched by the number of gold dollars during the 1920s. Also note how in 1931 President Hoover began increasing the number of paper dollars (Blue Plot) in circulation. This increase in government spending not only failed to stimulate the economy, but most likely actually deepened the Great Depression.
Doctor Bernanke spent his professional life studying the Great Depression, but I suspect he somehow missed this data published weekly in Barron’s at the time. I expect our current Chairman of the Federal Reserve will soon learn more about depression era “monetary policy” than he cares to know!
Let’s move on to chart #2.
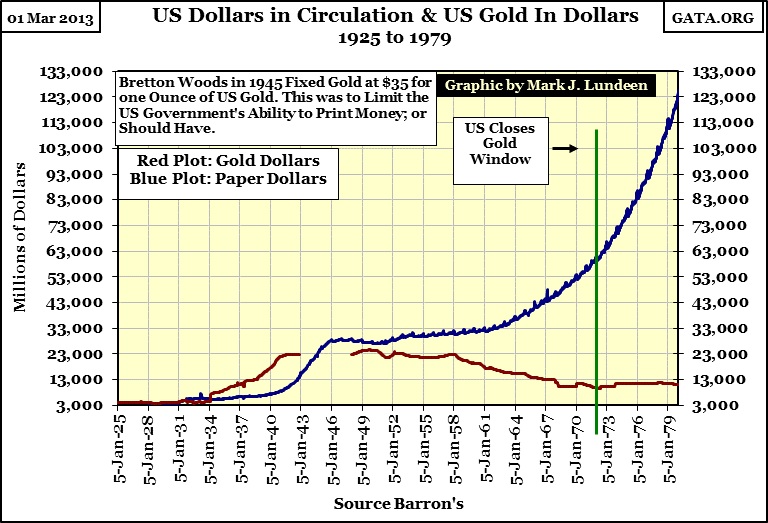
It’s important to realize that the general population of the United States never demanded that gold and silver be demonetized. What happened was the Federal Government continued over-issuing paper money into the global economy, until the unavoidable crisis finally arrived. During this engineered crisis, the “policy makers” then blamed the gold standard. Being ignorant of the history seen in these charts, the American people were led to believe that the Government should abandon the gold standard. But in fact, it was the academics, politicians and Wall Street bankers who have created one crisis after another for decades, and promoted the erroneous notion that gold and silver were to blame.
However, these charts prove who, and what caused the 1958-71 run on the US gold reserves, the inflationary crisis of the 1970s & 80s, as well our current era of woes. Had our currency and credit creation been constrained by a gold standard, there would have been no High-Tech or Mortgage bubbles, and we would not now be in our current low growth, high unemployment economy.
This last chart of the series tells us why we’ve been having such huge economic problems since 2000: unchecked currency creation and credit expansion, exactly what a gold standard, by design, prevents. Look at the three charts above. Do you believe it’s even possible that gold and silver could go into a bear market from here? It’s just not possible!
But with the universal ignorance of what Wall Street, Washington, and our state funded college systems’ economics departments have done to people’s wages and pension funds for many decades, most people haven’t a clue to what our problems are, or who is responsible for them. This is the sad part, as we can expect the media to continue presenting the same old “experts on the economy,” offering the same old solutions to problems they in fact created, and people will continue to believe them. And damn the media for going along with this.
Mark J. Lundeen
More from Gold-Eagle


