Nothing Like Price to Change Sentiment


Amazing what a week or two can do! Literally a few trading days since Oct 6th, it was “Here we go again! Another day of losses!” as if we had suffered through a daily beatdown of epic proportions for months. (It was 2 weeks and a 10% loss on GDX by the way. Incredibly tame vs what we’ve seen before) and now its overwhelming confidence that the low is in. Another conflict erupts, everyone fears WW3 (again) so clearly you must FOMO buy gold up $180 in 10 days RIGHT NOW or you’re going to miss “it.”
This is truly an example of FDR’s famous quote in action. “The only thing we have to fear, is fear itself.” Here we are, civilization still chugging along with the doomsday “end of the world” fear-mongering crowd being 100% wrong on every ‘end of world’ prediction so far. But now we’ve drummed up some fear and markets trade on emotions of greed and fear, so there is bound to be some price movements based on that fear, that we need to, well, fear. And the only way to better the markets emotional moves is to be calm and strategic about our own moves.
The fact is, there have been conflicts with Israel and Gaza in 2008, 2012, 2014, 2021, 2022 and again now.Each time was very different, but none resulted in the “end of the world” or “WW3” that everyone harped on. So, much like I treat investments, I’m choosing to side with the highest probability scenario vs the very low probability option that sees nuclear war, $400 oil and $10,000 gold. If that’s how you approach your investments, stop lying to yourself that you’re “investing” and just call it what it is and go buy Powerball tickets.
News driven headlines, as it relates to gold, especially regarding war fears, almost always completely unwind. Now, we have some planets lining up here like incredibly bearish sentiment that has been ongoing for weeks, well before this waterfall drop that we saw starting late September. That’s certainly pared off a bit after this week or so, but not enough to give us room to drop back to last October’s lows at 1600, in my opinion at least. But let’s break down what’s going on here so we can have a strategic game plan amidst all of this emotion.
I’ve said before, price action is what’s most important but really its price x time. We live in a market where volatility does nothing but increase and that results in huge price movements in short periods for a lot of assets, but can those price movements hold for any significant period? Or was it all just algos slamming markets around a bit to have an excuse to make some quick profits? Gold rallied $180 since Friday, Oct 6 retracing more than all of its losses for the previous 2 weeks. But what is driving this? Sure, war is a factor, but I don’t think it’s as significant as incredibly bearish sentiment and price action that has been obvious short covering. The problem with short covering is, it leads to fast rallies, but is anyone else adding longs here? Because that’s what’s needed to sustain a move higher. If not, we’re going to lose some of those gains, and big money doesn’t chase. So, we need to patient and see if buyers are coming in as we retrace a bit. THEN we have an opportunity.
2 weeks ago, DSI, the daily sentiment index, for gold was 8. A week earlier it was 12. The week before that, 17. This is an extremely bearish sentiment on a market that has been hated for a while and continued to get worse as prices collapse. Short term traders and algos piled in short on a weak market and hit a brick wall because there was no one left to sell.
That is the definition of “capitulation” which is why I said exactly that on twitter as gold began its waterfall down move. Capitulation is the excessive drop at the END of a downtrend, in an already hated market, It’s the last people left standing, finally throwing in the towel. Granted, I said that too early for it to be the low, and its VERY difficult to nail them in those situations but the point remains true. When it DOES bottom, we have a great buying opportunity on our hands.
Let me rephrase that, we MOST LIKELY have a great buying opportunity on our hands, but things can get chaotic. The market is shaky and it’s October and for some reason, it loves to crash in October. Rates are driving the panic in stocks, but that’s another market with extreme bearish sentiment, ready to flip.
If that is the case, and rates move lower as bonds rally, SPX may not be out of the woods and we could continue to see some weakness, proving it isn’t JUST high interest rates people are scared about. So, there is another underlying fear there. High rates are going to wear on the economy. While the initial reaction now is celebrating that the rate hike cycle may finally be over and we could be looking at holds and eventual cuts in the coming months, wait until the market finds out WHY the fed may be cutting, because it’s never been because everything is just fine.
Now, as I just said, I have no interest in betting on the low probability situation like trying to predict a market crash. But I’m certainly going to look at it as a very real risk. Could we see a recession like last year, in name only, 2 quarters of declining GDP, a bit of job losses and other than that, nothing to write home about? Of course. The problem is though, when you “punish” the entities who blew up the entire world by being overleveraged by bailing them out and then giving them money at 0% interest, encouraging them to do it all again, it is a very likely scenario that on any given Tuesday, someone is about to make a $600 billion mistake that could have serious ramifications. In fact, that begins to be the more probable scenario than just a “normal” recession, which is probably why we haven’t seen a “normal” recession in 30 years. They are somehow ALWAYS once-in-a-lifetime catastrophes.
But back to gold. The point of this is if something big goes wrong all normal expectations are off the table. Unlike the perma-bull, “gold to 10,000” crowd, most normal and mentally stable people view gold as an insurance policy, not a lottery ticket. If something goes wrong, you’re going to cash in on your insurance policy, which is why in 2008 and 2020, we saw gold crash with everything else. Margin calls don’t discriminate. There is an order of operations most will follow when trying to raise cash. First, you cover your short positions. Most don’t care about these long term. Then you sell things like gold and other hedges, like some oil futures, euro futures etc. Finally, if you absolutely must, because your broker is threating to liquidate you, THEN you sell your longer-term holdings of stocks like APPL, AMZN, etc.
So, while sentiment in gold, with DSI at 8 could be insanely low, in a market panic you begin to find sellers who maybe a week ago, we’re not in any way, shape or form bearish or had any intention of selling, and if fact would buy if they had the cash, but they don’t, and that’s the problem.So, things could get worse. The good news on that is it’s still a buying opportunity, it just will be a deeper, longer drop. But we know what the playbook will be: Cut rates, print money. We know stocks and gold benefit from this. So, take your cash, develop a strategy and layer in, like 10% at -20%. 20% of cash at -30% etc.
There is the other side of this though. The side I’ve been pointing out for 2.5 years, over exaggerating to get my point across. That this may not be the END of something, it may be the START of it. Yes. This is the most oversold we have been on gold since 2018 and 2016, as I mentioned on twitter a little over a week ago and seen many others saying the same thing. 2016 was the low in a bear market in gold that lost nearly 50% from highs printed 5-years earlier. 2018 was the last drop before the new bull market began sending us to new all-time highs. Those oversold events came at the end of a brutal bear market. Is this the end of a bear market here?
Possibly. I have been of the belief we HAVE been in a bear market, a “stealth” bear market. Looking at gold itself, we are simply consolidating in a big range for 3 years. Multiple retests of all time highs that haven’t broken yet, but certainly doesn’t look like a collapse, yet at least. But take a look over at silver and miners and it’s been a different story. Silver down 30% from highs, GDX down 35% with a nasty 50% low between 2020 highs and now. It’s not surprising gold has maintained a bid in a time of high inflation, uncertainty, multiple wars and bank failures. You’d expect that. (In fact, you’d expect better than that, which is partly an issue in itself.) But when big money is worried and wants to protect themselves, they go to gold, not silver and not gold stocks either.
I say, “watch the miners” for a reason. We’ve seen reversals in them mark lows and highs ahead of metals. Under-performance can be a warning sign. Out-performance can be an opportunity. Well, the major miners got cut in half and jrs have been slaughtered. We’ve had some promising rallies along the way, but it’s been a mostly down market last 2.5 years, and that was exactly what I was warning about in June 2021 when I turned bearish, and a big reason being miners underperformance, that “this isn’t what a bull market correction looks like or behaves like. Something is wrong.”
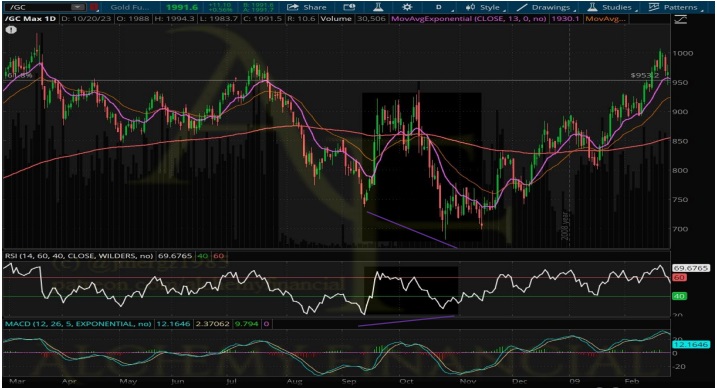
There are other metrics that I think prove the point that we’ve been in a bear market and not a bullish consolidation. One of which is COT reports. Right now, gold is pretty flushed out. We are looking at the lowest large spec long positions since last October’s low. That’s a bullish sign that a rally is coming, but by no means tells us how much or how long it could last. As you can see by the gold COT chart, we had multiple occasions of very low large spec long positions that resulted in quick rallies that broke to lower lows over 2 years.
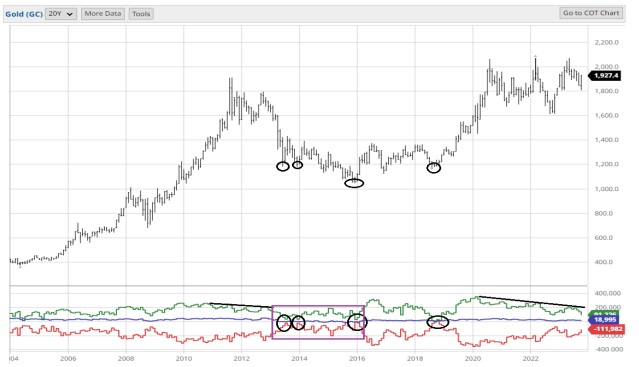
Another warning was that peaks in long positions was steadily declining since the peak in 2011. Interest was fading before price broke down then got very low, had fast rallies that never saw big position sizes increase much, then continued lower. We can see the same today since the 2020 high. Long positions have been declining at peaks. This last attempt at 2100 saw half as many large spec long positions as the first attempt. We made a similar picture on the last rally to 1800 in 2013 before completely collapsing.
So again, we have to ask the question: are we seeing the flush out low of positions after declining interest in gold in a “stealth” bear market, or are we seeing the warning signs that the flush out is just beginning?
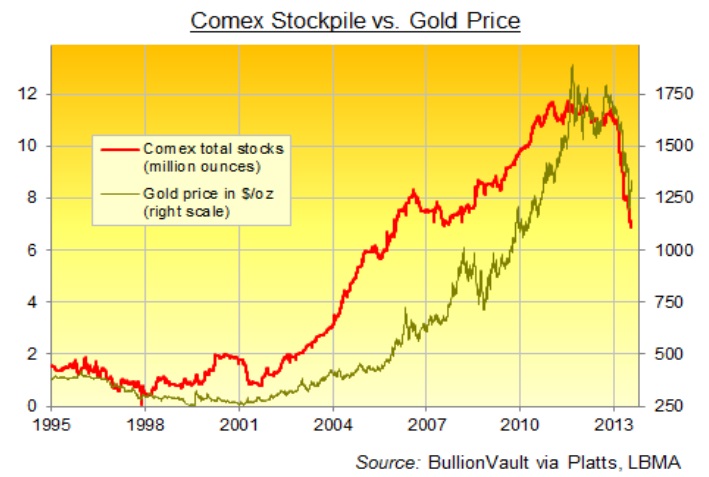
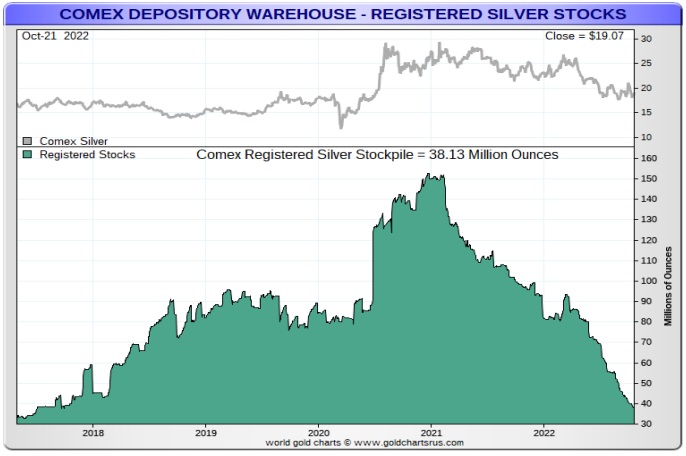
Another issue has been something the “perma-bull” #silversqueeze guys have been harping on for a while too, they just don’t realize it means the exact opposite of what they think it does. Comex inventories have been declining. No, this doesn’t mean a squeeze in price is imminent. Comex inventories declining to a low level does not mean there is no supply. It means there is not enough demand to rationalize holding more supply.
For those #silversqueeze guys who slept through business 101 in community college, what do you do if you are the owner of a store, and a product is not selling anymore? Take up warehouse space holding large inventories there is no demand for? Of course not. You discount the product and try and get rid of it to make space for in-demand products. In the same way, when price is declining, it’s a representation of demand declining, and comex inventories decline along with it. When price is going higher and demand is increasing, they increase the holdings in inventories to balance it. It’s really that simple. It’s not a “squeeze.” You don’t see beanie babies on shelves anymore either, it doesn’t mean there is no supply and a squeeze to much higher prices are coming, its simply because nobody wants beanie babies anymore.
In other words, they are proving the exact opposite point they are intending to. If inventories are declining, it’s a sign of decreased demand and that is something that occurs when you are in a bear market. It doesn’t mean higher prices, it in fact means lower prices. When price turns higher, inventories increase. They rose 2001-2011, declined 2013 to 2016, increased from 2016 to 2020, and are declining now right along with price, as shown by these 2 charts. If anyone is claiming this means anything other than very simple “Intro to Business” week 1 stuff, they either are pumping a narrative they’re trying to sell you, or they simply have no idea what they are talking about, and you should probably disregard most of what they say. They are going on social media and telling on themselves, “I don’t know the basics of business and markets.”
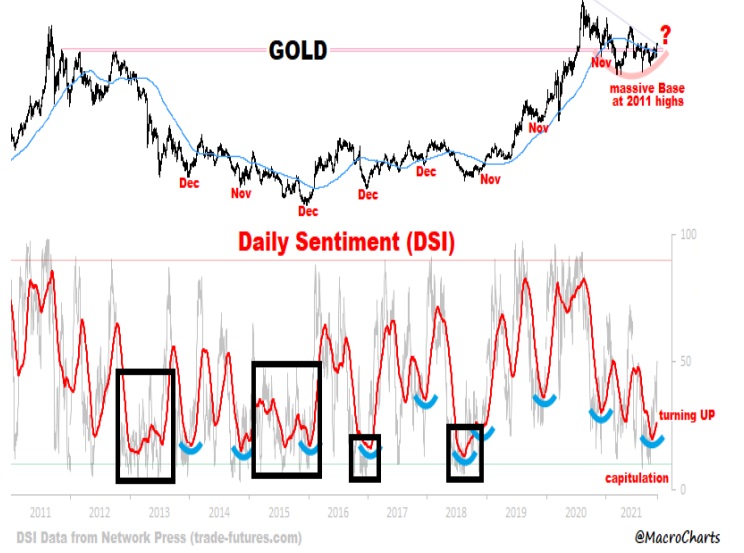
Another warning COULD be sentiment as well. Yes, as of right now it is very bearish (probably significantly less after last 2 week’s gains) and that is usually a fool proof sign of a rally coming. But again, how long or how high is not determined. And we could easily fall right back to very bearish sentiment levels and not recover much as prices continue to decline. Again, this is TYPICAL of a bear market. Look at the chart below of gold with DSI, (courtesy of @Macrocharts from a google search.) In 2013 sentiment was at incredibly low levels as price collapsed and stayed there near 10-20 for most of the year. Hundreds of dollars lost on gold and DSI never moved above 50, then right back down again. 4 moves in DSI above 50 at bear market rally peaks from 2013 to 2016. In general, the entire bear market saw DSI range lower vs 2018 onwards, in which saw bullish peaks were near 100 and would stay there and never dropped below 20 for 2 years, keeping in a higher range during the bull market.
Again, this becomes a question of is this the end of something, or the beginning? We saw prolonged low levels in DSI as gold was making its final bottom in 2018 then never back to those lows at all, let alonefor a prolonged period of time. So, is this a flush out in bullish sentiment that is about to push to new highs, or is it the first warning shot in a series of extremes in bearish sentiment that will go on to repeat after lackluster rallies until we finally bottom, at who knows where or when?
Another point on the “warnings”is RSI. RSI on this drop bottomed at 18 on the daily chart. The last time it was this oversold was July 2015. Note, July 2015 was NOT the low, Dec 2015 was. The extreme in RSI bounced then dropped to a lower low with less extreme RSI, giving us positive divergence (when price makes a lower low and RSI makes a higher low.) We did the EXACT same thing last year. The most oversold point was not the low in September. It was July, then dropped to a lower low with less extreme oversold RSI readings. So even if there is no “warning” here of danger ahead of a prolonged bear market, that this IS a low and the trajectory will be higher, I caution those who are so certain now that the low is in. MOST lows do NOT coincide with the most oversold RSI readings. That was the case in Oct 2022, Jun-Aug 2018 and July-Dec 2015. (Worth noting, after the more oversold point at 1680 in July 2022, Gold also rallied $120, in 15 days, only to break to new lows anyway 2 months later.)
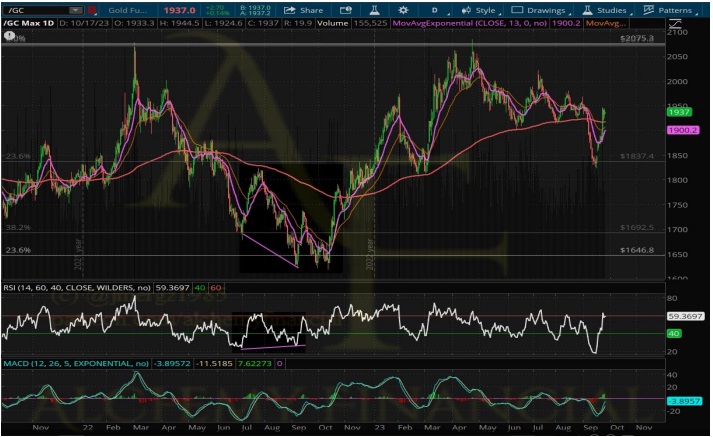
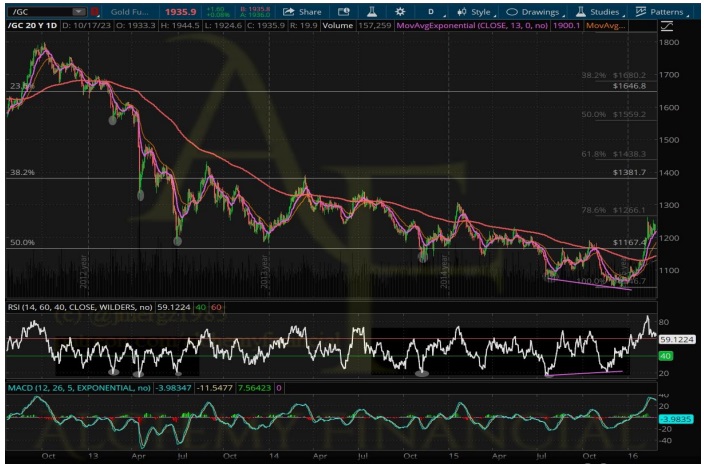
My point with that is, this is, don’t be so certain “the low is in” because history tells us a significant amount of time it is not. But that’s not the only “RSI warning” here we need to worry about. The last time we we’re this oversold was in 2018, the final drop in the bear market. The LAST time. That was the 8th, and final time we saw RSI move to 20 or less on the daily gold chart, at a price of 1200/oz in May 2018.
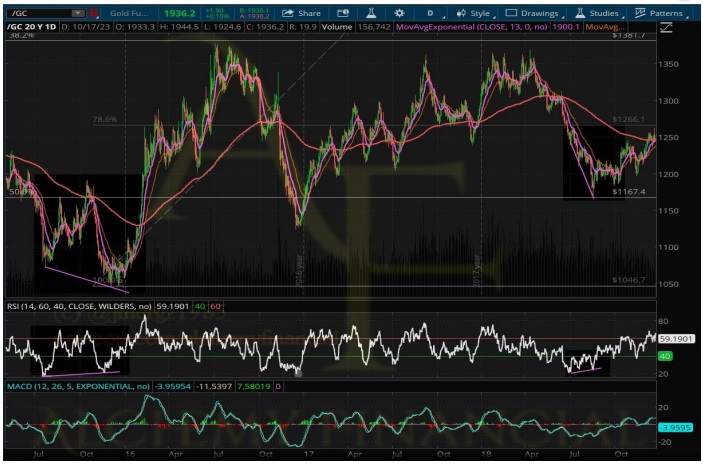
The FIRST time it happened was in February 2013, at 1550 an oz. It would go on to happen 7 more times over the course of 5 more years as gold lost $500 in between, because that’s what RSI in a bear market does. It gets VERY oversold to levels you do not see in bull markets. Then rallies are lackluster, and then it does it again. And again. And every “buying opportunity” because things are “so oversold,” just kept dropping to new lows while investors get massacred.
In addition to RSI, there is price action itself to consider. You’ll be hard pressed to look back at gold over the years and find similar waterfall down moves that rebounded in sharp, strong, very fast rallies, EXCEPT in the 2013-2018 period, when we were in a bear market. They didn’t occur practically ever in a bull market, with the exception of the 2008 and 2020 crashes, in which every asset got smacked hard and rebounded after. But after every instance of extreme oversold levels in RSI from 2013 onward, we can see they came with very strong waterfall down moves that were countered by very sharp, fast, strong rallies. Each of those rallies proved to be short lived, burnt out fast, and dropped to new lows. Today, after another waterfall down move, we have a very sharp, fast and strong rally, on a scale we have not seen since the bear market. This is also a concern that shouldn’t be ignored.
We are seeing ALL of these things right now. Sentiment is the worst we’ve seen in a very long time, and that’s unusual in a bull market. COT large specs are less enthusiastic about being long gold, and that is typical in a declining market. RSI is hitting levels that we last saw during the previous bear market, at the lows when it concluded, and also BEFORE we broke support at 1550 which was a warning sign. That first hit at RSI 20 in Feb 2013 resulted in a weak rally that fell back down in April, and then in 2 days, Fri April 13, 2013 and Mon April 15, 2013, gold dropped $220. That drop was half of the entire $500 from 1550 to 1050 that gold lost in the bear market after breaking support, but a) it would drag on continuing to drop for 2 more yrs, then sideways for 3 years after that, and b) despite 1/2 the damage being done, GDX went on to drop ANOTHER 55%, despite ALREADY being down 60% from 2011 highs.
And why shouldn’t it? After all, miners are leveraged plays on gold. Here is a perfect example: Dec 2014. Gold is 1175. If you were looking at it then and thinking, “This HAS to be close to the bottom.” You were right. Gold dropped another 10% over the next year to 1050 and that was the final low. The problem occurs if you said, “This HAS to be close to the bottom” and then bought leveraged gold miners, GDX at 18-20 at that time. At 1175, the biggest miners were producing for around 1,000/oz, giving them $175/oz in profit per oz. At 1050, their profit margins are reduced to $50, a more than 70% drop. So, it should not be surprising to see GDX drop about 35-40% from that level, given miners profit margin reductions, which is exactly what it did versus gold’s mild 10% drop in the same time frame. That leverage cuts both ways, but most don’t want to talk about that. They only want to tell you about the profit opportunity. All opportunities involve some level of risk, and if you’re not looking at what your risk could be, you’re only doing half of the equation.
I am not saying this to be “doom and gloom.” I’m not saying this because I am bearish either. This is not what COULD happen, based on Jonathan Mergott’s theories. This is what DID happen just 10 short years ago and I have spoken to countless investors that were wiped out because of it. There are similarities still today. We are seeing COMEX inventories decline, RSI go as oversold as it did in the bear market, COT reports show large specs are less and less interested in buying. DSI is going to extreme levels we typically don’t see often in bull market corrections, but do see in bear markets. Price action is also at extremes, moving sharply and quickly up and down, just as it did then as well. I’m not saying a 50% drop in gold with 60-90% losses in producers and Jrs is going to happen, like it did then. I’m not even saying that we’re going to break lower from here. I am simply saying this:
There are similar factors today. I think we stand to have a good, sustainable rally coming soon, one that could finally break 2100, but while you’re counting your chickens and multi-bagger gains on jrs before you actually have them, THIS is your RISK side of things. PLEASE consider it. There are 2 sides to the coin, not just profit potential, but what your logical risk is that you are taking to get it. Disagree all you want, just HONESTLY consider what that would mean for your money if we do break lower. If that’s too much for you to take, please change something. Everyone THINKS they can ride out 50% losses until they are staring at HALF of their hard-earned money, evaporated. When it comes to miners, what matters is margins. And even if there is a much more mild “bear market” or deep correction, if producers see margins decrease by 50-60% or more, it’s not unreasonable to expect similar in their stock prices. Everyone wants to do what the rich successful big boys are doing. Well, fact is, Eric Sprott is a billionaire. His house(s) are paid for. He has cash in the bank. He’s diversified, unlike most people in gold. If he’s very wrong, he’ll be just fine. Can you say that? Fact is, most just want the 10x potential idea, then ignore the rest. There is a lot more to being successful in investing than just picking the right stocks.
Ok. I’ve said my piece. I do feel a responsibility to followers and readers, and I like to be able to sleep at night. Make your own decisions, but unlike most out there in the gold space, I am not trying to “sell” you on any view, and any view of my own that I do express, I’m going to say both sides of it, both the potential AND the risk. Moving on...
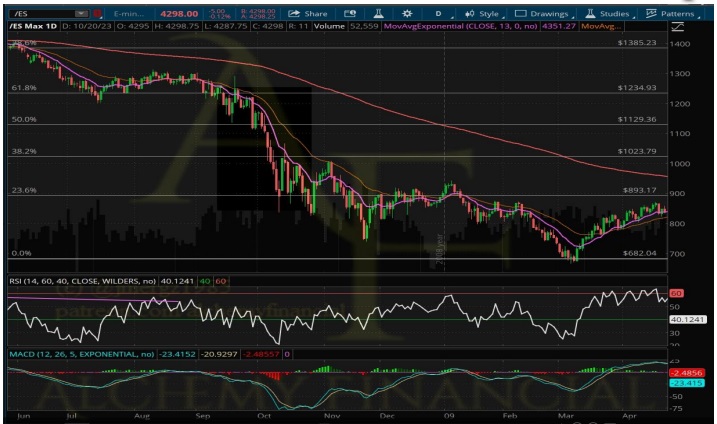
Life comes at you fast and over the couple of days that I’ve been writing this, Gold continues ripping. Now closing in on $2000. That’s nearly $200 in 10 days flat. Daily RSI has swung from 20 to 70 in that time. This is growing more and more concerning to me. 1) As I previously mentioned, most examples of fast, very oversold swings higher that are comparable happened from 2013-15, and rightly so. Bear markets are defined by big moves higher that convince everyone the low is in, then grind them down till they all get stopped out in a “death by a thousand paper cuts” way. Bull markets are the opposite. Take the stairs up and the elevator down, scare everyone into selling then force them back as you climb higher. 2) the MOST comparable move from the standpoint of time, came Sept 11, 2008. After a sharp waterfall decline from 1000/oz down to $750, gold ripped back up to $920/oz, a move that sent RSI from 20 to 66 in 6 days. It lost all of it and then some, breaking to lower lows at $700/oz 5 weeks later and bottomed on Oct 24, 2008.
What happened in SPX during that time is what is interesting. SPX was 1250 Sept 11, 2008. 5 weeks later on Oct 24, it was 850, a 32% loss. The MASSIVE tank in the market took gold and everything else down with it as margin calls hit everyone. But it STARTED as a panic that had people rushing INTO gold, until it became a liquidity scramble and a “sell anything” event. I posted a tweet about the risky behavior of the stock market and similarities to 1987 in the end of Sept. Nothing has changed. In fact, many things have gotten worse. There is a VERY high risk of panic here, and that can burn over eager gold bulls.
What I want to see, is a reasonable pullback where buyers step in and are eager to buy in size and we see that supporting price. And not just for a day or two, for a decent period of time. Hold the line, and show the short term, momentum chasers (who inevitably will turn against us and flip bearish as soon as momentum wanes,)that there is no room for profit here trying to push price lower. They will exit when it proves unproductive, and we will be in a place to take another leg higher.
I worry about IF they will step in though. If it was ME, and I HAD cash right now, I’d be reluctant to spend it no matter how much I liked gold simply due to the risks we may have here. (It actually IS me. I DO have cash right now and I DO like gold, and I AM hesitant to spend cash in front of what could be a freight train headed our way. I just don’t manage $60b, so I am small potatoes in the market.)
Our goal here at Alchemy Financial is to identify the big swings. The turns higher or lower that repeatedly give good evidence the market is turning and position to hedge or add leverage to long term holds on high probability, multi month, big gaining swings and tune out the noise of the shorter-term gyrations. What is reasonable and probable? That is our thesis and our goal.
Since 2020, I’ve made 7 bullish or bearish directional calls on gold. Over that same time, there has been 6 big moves higher or lower. Each averaging 3-6 months. Everything else was noise. That’s all we want. The big profitable moves when there is good evidence indicating a high probability of a turn lower or higher. Then taking profits, walking away and being patient for the next one. Some have been better than others and every couple of years, one is MASSIVE.Nailing 2016’s 175% rally in GDX in 9 months and doing NOTHING ELSE is STILL a 15.5% annualized gain 7 years later, vs SPX’s 13% a year in the same time. You don’t need any more than one or two huge rallies every few years to have it be a game changer for your overall annual gains.
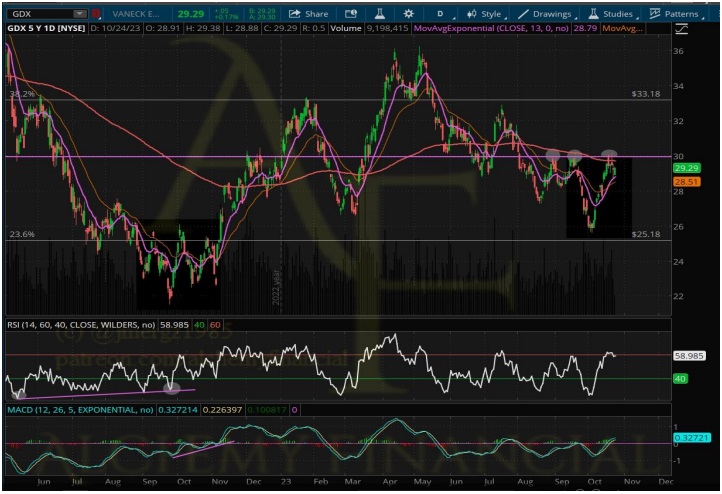
Right now, a lot is similar with 1 yr ago. GDX took a dive, that move was overdone at a time when sentiment was incredibly bearish and we snapped up, hard. It wasn’t “off to the races” though. We consolidated for over a month as bears kept trying to push us lower. We dropped but refused to break lower. Eventually, shorts flipped from selling rallies to buying dips and THEN we took off. We just burned a lot of shorts and that’s great, but when the short covering dies out, are buyers seeing value during pullbacks? THAT is what we need to have a sustained move that breaks 2100, and that is what I want as a major factor that evidence is building for a high probability opportunity of a very good rally. Worth noting, the RSI move to 20 like we just saw, came in July, but PRICE bottomed in Sept with a higher print in RSI (positive divergence). We aren’t out of the woods for a possible lower low, especially if there’s a panic.
And I think that “break” is finally coming soon. I find it interesting when I expressed bullish views a few weeks ago, many weren’t so sure. The number one thing I heard was “I’m concerned about US dollar strength.” DXY is unchanged mostly in the past few weeks at ~106 and gold just rocketed up $200 after dropping. From 2014 to 2020 DXY ranged from 90-100 and gold went from 1050 to 2100. A strong uptrend is a headwind, a downtrend is a tail wind, but when the US dollar is simply consolidating, gold can do, will do, and has done, whatever it wants plenty of times. It will do it again now, too.
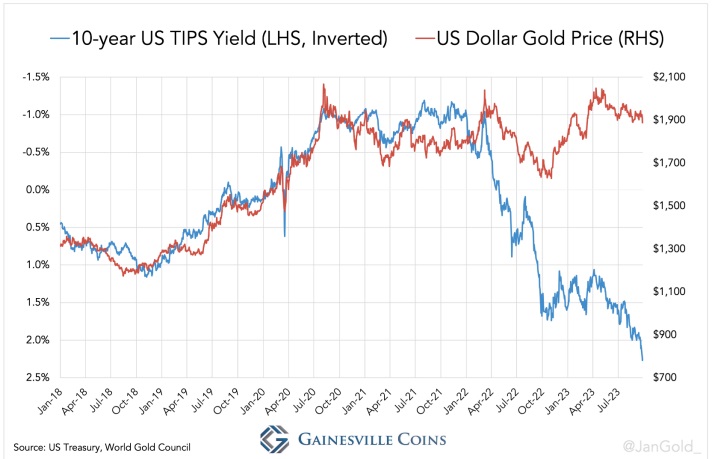
I was bearish at tests of 2100 in April that failed, and that was the right position. Gold had screamed and failed at the same 2100 level yet again, on the back of news driven headlines of “bank failures.” The 2 things that really drive panic into gold is war and bank failures and we got the one last year and the other this year. When that panic dies down, gold is bound to unwind, and did. Furthermore, Gold had been correlated very closely with bonds, but soared WAY out of proportion. While treasuries bounced around near lows and finally just now broke lower, 1 yr later, gold soared to all-time highs and continued to hold this excessive premium. If gold were to fall back in line, it could have been a big drop.
But while it was the right call and a profitable hedge at those levels, the result was nothing similar to last year. Instead of a $500 drop in 6 months, we slid $200 then held, and had boring sideways action at 1900 for 4 months as sentiment tanked. There’s 2 ways you can kill bullish sentiment. You can have BIG drops over months that force bulls to run, or small corrections then nothing and just bore them to death. The former, like last year, is how you get major lows. The latter, like we’re seeing now, is how you get major breakouts, like we had in 2009. 1 year after the disproportionate gain in gold vs bonds and the premium is still holding. I don’t know why, but I do know this sudden change is significant. If gold was going to fall back in line and drop significantly, it’s had MORE than enough time to do it and hasn’t.
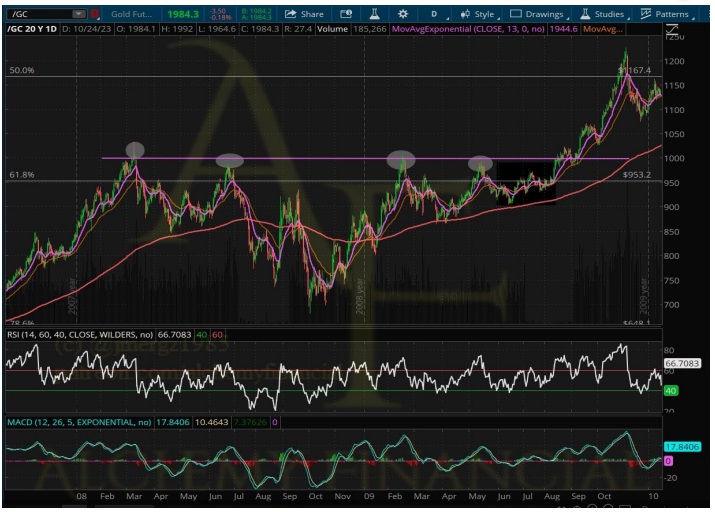
After 4 attempts and nearly 2 years pushing up against $1,000/oz, the last thing gold did before finally breaking out, was correct about 10% then move sideways for the next 4 months quietly while everybody lost interest. We consolidated in a 5% range from 900-950 then exploded. Over the course of the following 3 or so months, we rocketed up in a parabolic fashion 20% to 1225 an oz. We were also very quiet and boring now before this capitulation crash, but that really shook out bulls. This is VERY significant. We saw capitulation in 2016 at 1050. We saw it again in 2018 at 1180. We saw it in 2022 at 1600. We’ve never seen it before within 12.5% of all-time highs. We may need a bit of time to cool off after this short covering rally, but we finally have the room to break and run hard. A similar move up 20% as we had in 2009 would bring us to 2500. And between 2400-2500 I think is quite reasonable and probable.
In such a situation, you have miners that are currently sitting on $200-300 profit margins per oz or less in some cases, that stand to see those increase by 2-3x at 2400-2500. A lot of these high-cost miners already did 200% just since last October’s low, swinging from losses to profits. It’s not unreasonable to expect similar 2-3x moves in their stock prices. HMY in Jan 2016 was 50c a share, because they had costs ~1300 an oz when gold was selling for $1050/oz. 9 months later, gold rockets to 1375 and HMY swings from a very big loss per oz, to a profit. The stock went up 900% from 50c to $5. THOSE are the situation where you want the leverage miners have to offer. While that was one for the record books, we certainly have a few similar slim profit margin miners today that could easily get doubles and triples at 2400 gold.
Gold is an emotional investment because it does nothing for long periods then takes off. There is always that fear of “missing it.” But majority of the time, that emotional panic buy ends up being the exact high of the move. We need to be calm and strategic. We need to be patient. We need to see evidence buyers are coming in on pullbacks and the tide is turning in bull’s favor. We are only trying to swing at the good pitches when probability is on our side.
At the Alchemy Financial site, we have a database of gold stocks, currently 82 producers and Jrs, updated periodically and constantly adding more companies. It has fundamental data, technical data, the key points I find significant, and all of that compiled with a weighting to give a signal to determine who is leading their peers and the indices, and who is not. How much do you produce? How much of that is gold or silver or base metals? Copper is great if you’re bullish commodities in general, but its not money. Silver equivalent is not silver. When I want a silver miner, I don’t want 60% gold or 40% zinc. What is your cost? Who stands to have a 200% increase in profit margin vs a peers 50% increase. What is your cash level? Your debt? Above or below the 200 day MA? Near support or resistance? How much profit potential on a rally to resistance? What’s the risk vs that profit potential? Who’s outperforming?
We’re singling out the best miners. The outperformers with the best leverage for a rally and a break to new highs. The ones that stand to make 200% to GDX’s 50%. We’re being strategic about buying them too, because that knife cuts both ways. A $200 profit margin at 1900 gold is a big problem if gold drops 100-200 from here instead of gaining 100-200. It’s fine not to catch the exact low. The emphasis is on a good risk/reward with a high probability, and we are simply not there yet.
We have a portfolio management spreadsheet, with various “mock” portfolios and how they have performed over time with various weightings to gold in general, vs index funds, as well as what assets within the “gold sector.” Physical gold? Physical Silver? Royalty companies? Miners? Jrs? What has done best over 5 years, 10 yrs, 15 yrs, all the way to 35 yrs? What portfolio weightings to “gold” works? What assets in gold have done the best for buy and hold? Which ones should you never touch for long term holds? What works best when gold is declining or consolidating? What works best when it’s moving strongly higher and how to rebalance when that shifts? All, with performances over those time frames. The results of these balances may be surprising to you. If your portfolio isn’t coming close to these, maybe you need to do something different. As they say, “past results are not an indication of future success” and while that’s true, it’s amazing the consistent performance in the right weightings continue to be, as everyone says, “it’s different now” and always thinks THEY can outperform but NEVER do.
In addition to this, we have the private discord server, where we are discussing everything day to day in the markets. What I personally see and am looking for, we’re sharing information we find from all corners of the world, opportunities we see in other markets, and we’ve had a few good ones this year, including +100% on BTC miners and a great hedge on SPY puts in Aug that continues to pay off. All buys and sells on gold and GDX when adding leverage when we’re looking to rally, and hedges when there is risk are posted in real time.
If what you’re doing isn’t working, there is no better time than now to make a change. If you want something different, you need to DO something different.
*********


