Oops…A S&P500 Surprise!


The good Non-Farm Employment number on Friday came as if it were pre-ordained in order to be the hammer that was urgently needed to knock the gold and silver prices back into submission –- and to lift the S&P500 above what I had called an all-time high, based on a long-term analysis (barely 2 weeks ago)! Not pleasant at all to be proven wrong so soon. However, when we expect something else, the markets have always shown they have a will of their own. More so where gold and silver are concerned. Now we have to wait to see whether the minor break higher on the S&P500 is a sign that the bull market on Wall Street has resumed…or whether the break will fizzle out as merely a small and temporary aberration on the back of suspiciously and out of the blue very good employment numbers –- much similar to what had happened in 2012 not long before the election that year, painting a rosy picture of the economy, which helped to ensure the Obama re-election. (ref: Brian Maher in ‘The Daily Reckoning’)
It is of course de rigeur that gold and silver have to take a beating going into and on the first Friday of the month. Non-Farm data is reputed to be the most watched sign of the state of the US economy. It would not do to have the birth/death adjusted Non-Farm number competing with a strong gold price that is indicating a growing concern about the US economy! On the other hand, if gold retreats on that day, it confirms the good news about employment.
The yield on the US 10-year Treasury Note made yet another immediate about turn – this time to become bearish again. This reversal coincided with new weakness in the US dollar as measured by the Dollar Index, largely influenced by the strong yen. Japan and the US probably vie for the ‘honour’ of printing the most money - and it is strange that the yen suddenly gained so much against the US currency. Can it be that the Japanese are discovering that money printing does not help the economy if consumers save the excess cash flow and refuse to spend as much as they can?
Just as the US finds that pouring money into the financial system to stimulate more spending by consumers has much less than the expected results, because consumer households have little left to spend on anything after paying for essentials. As long as current trends point to worsening impoverishment of working households, there is little hope that the US economy can be resurrected over even the medium-term. This is the trend that will cause the collapse on Wall Street, which is currently being predicted by nearly every off-Main Street commentator.
There is still three months to go before the election…and much can still happen. As promised, Wikkileaks could come forth with surprises, while I find it suspicious that Trump is becoming ever more contentious in his oratory – almost as if it is intended to have the RNC drop him as their Republican Presidential Candidate, as is rumoured. That would enable him to stand as independent with no pre-established party policy chains to bind him to a certain course of action, while he could draw on a very large pool of most disgruntled voters in both parties. An interesting speculation!
Note that the DJIA chart is this week replaced by the long term chart of the S&P500.
Euro-Dollar
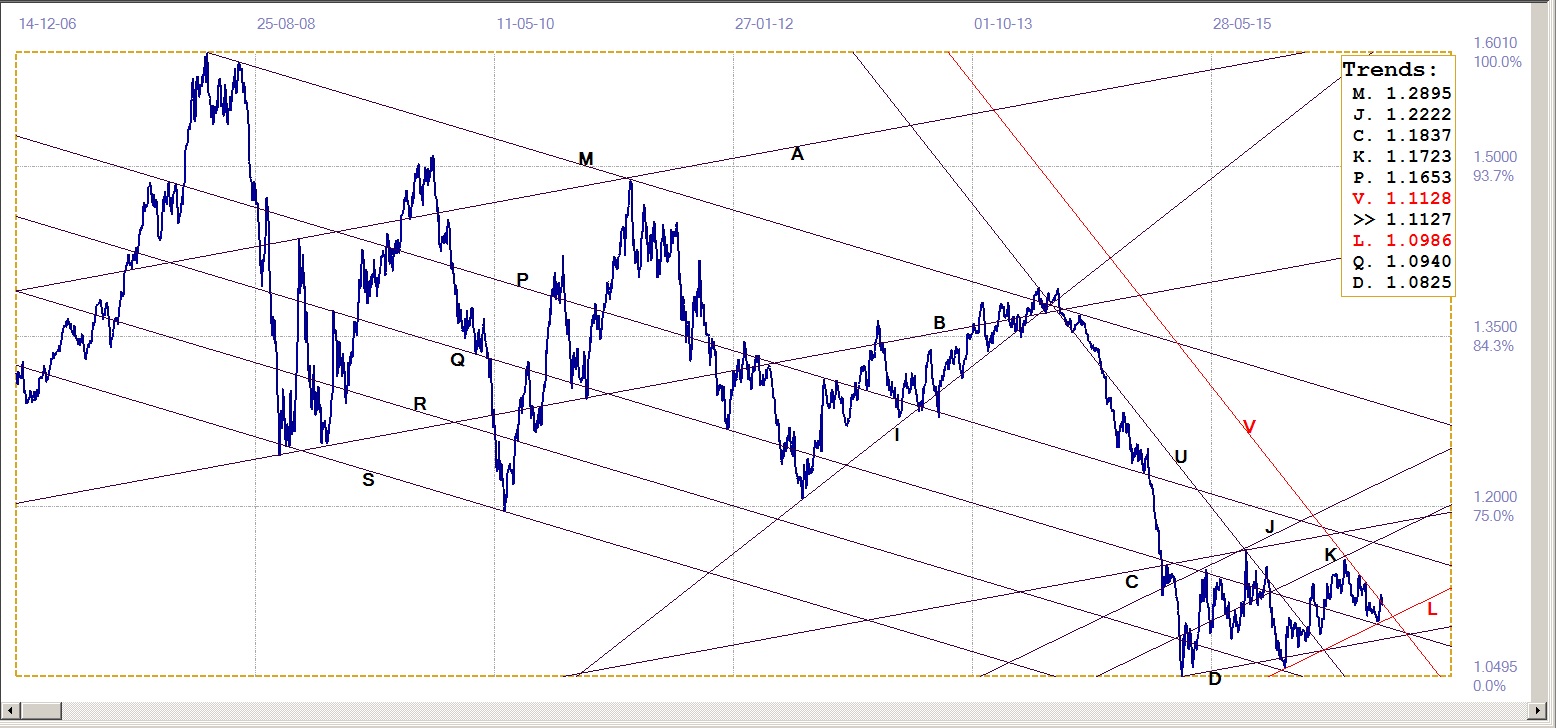
Euro-Dollar, last = $1.1127 (www.investing.com )
The rebound higher off support, at line L ($1.0986) has – so far only? – failed to break above bear channel UV ($1.1128), ending right on that resistance. The range of freedom between resistance of line V and the support at line L is narrowing quite rapidly and we should soon know in which direction the break will take place. The odds seem to favour a break higher, if general dollar weakness is to continue.
S&P500
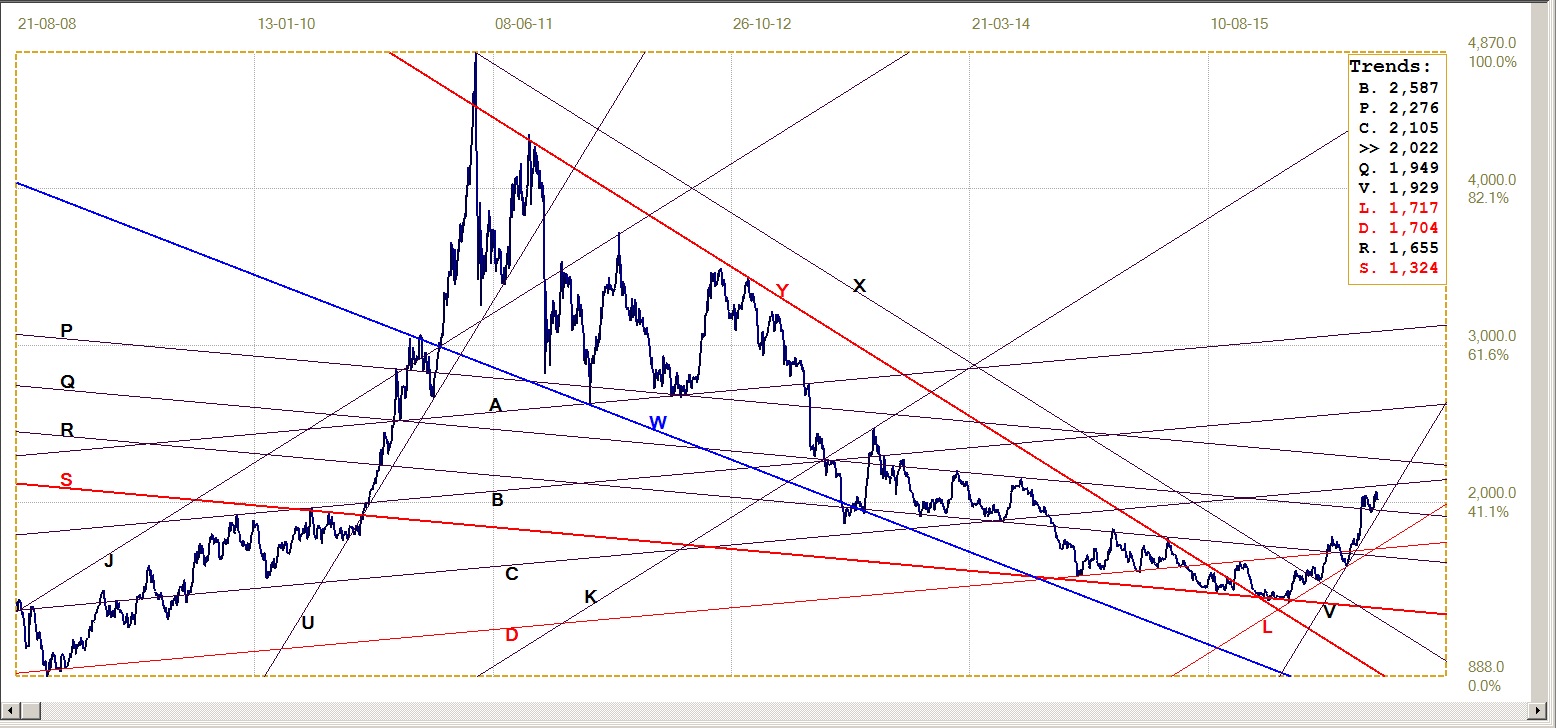
This week the chart of the DJIA – which has not yet challenged its all time high at 18595.03 reached on 20 July – is replaced by the long term chart of the S&P500. The data begins in 1950 and the master gradient M is defined in the early history before 1960. Line T, with its origin in the may 2015 high, has a value of 2179 for Monday. This is just 4 points lower than the close on Friday, which implies the break above the trend line is – not yet! – of any significance.
Last week it was suggested that key pivot points were moving into place. Gold and silver reacted higher off support, but have to confirm this after the Non-farm hit. The dollar may well have topped out after its recent rally, while the DJIA failed to set a new high (so far!). The S&P500 has just done so, but now has to confirm.
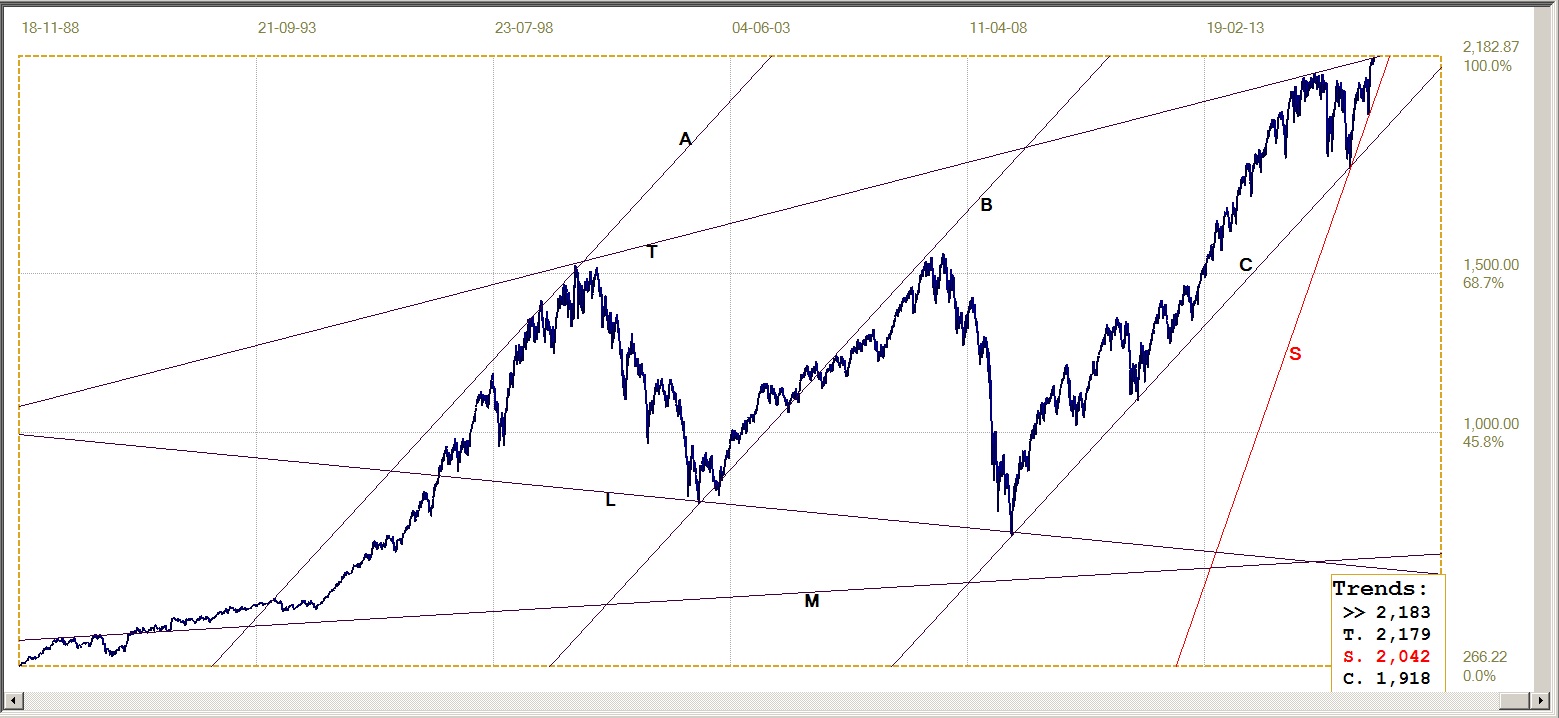
SP500 Index, last = 2182.87 (money.cnn.com)
Gold PM Fix - Dollars
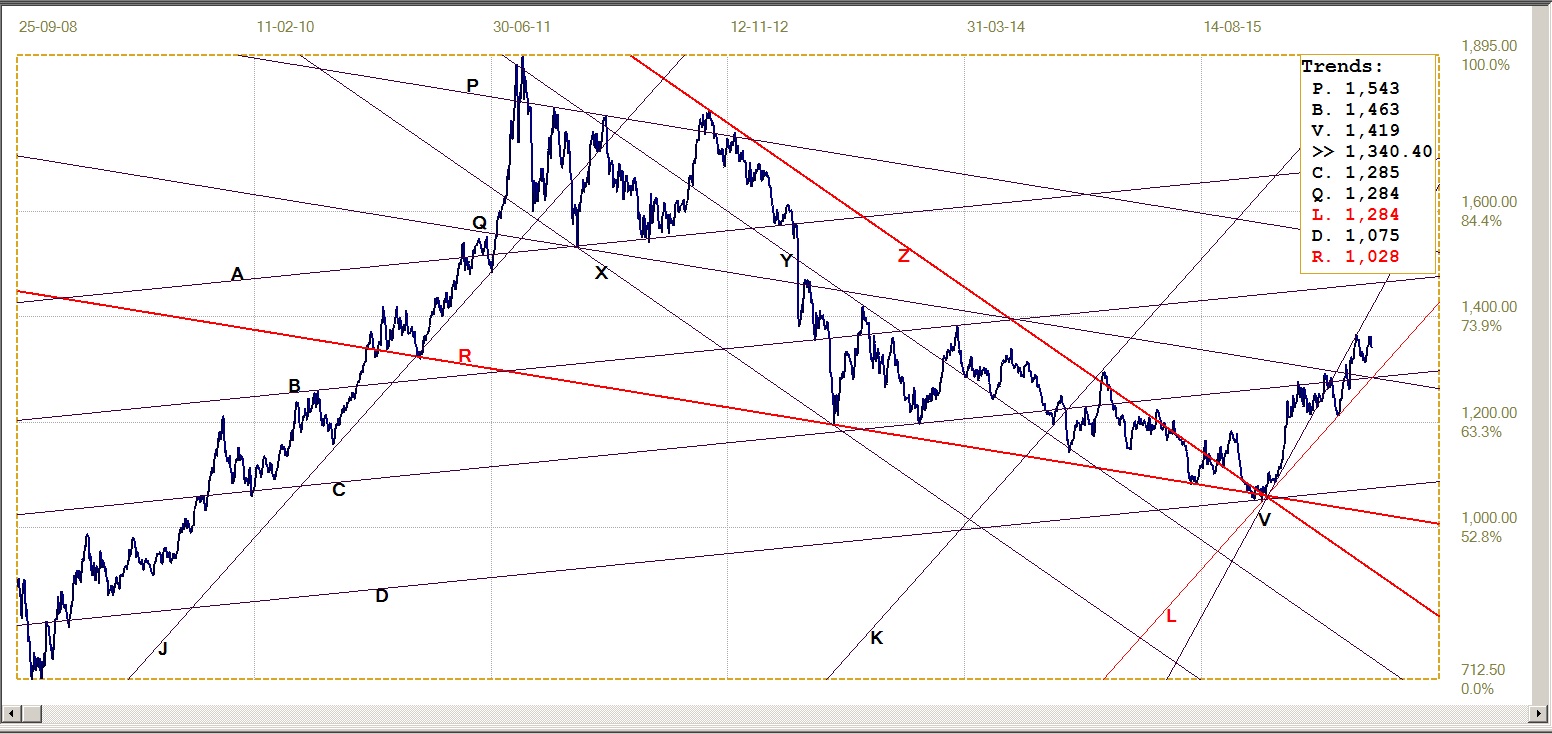
Gold Price – London PM fix, last = $1340.40 (www.kitco.com )
Traditionally, the gold price is attacked into the first Friday of the month to prepare for the big hit on the day of the announcement. After failing to break above steep resistance at line V ($1419) while setting its new recent high, gold slipped lower under persistent selling. However, this time the weaker trend did not extend into August in anticipation of the payroll number. It rallied to make a near double top. It was only on Friday, with an unexpected good number, that the metal gave way and closed on a low for the week.
In the news and statistics dominated markets of today, the unexpected good news on Friday has to be followed up by more similar news if the effect on the gold price – and on silver and the SP500 – is to last and perhaps extend through to the end of the week. Perhaps the new pivot points are really settling in place?
Gold PM Fix – Euro-Gold
As shown earlier, the euro is testing resistance after a rebound off support. Despite a stronger euro, the gold price is holding high enough to keep the euro price of gold in positive territory after the break above resistance at line R (€1205). There was a minor break below the support after setting the new recent high, but since then the price has held firm above the support line.
A break below line R has to confirm at line W (€1180), which has a history of good support.
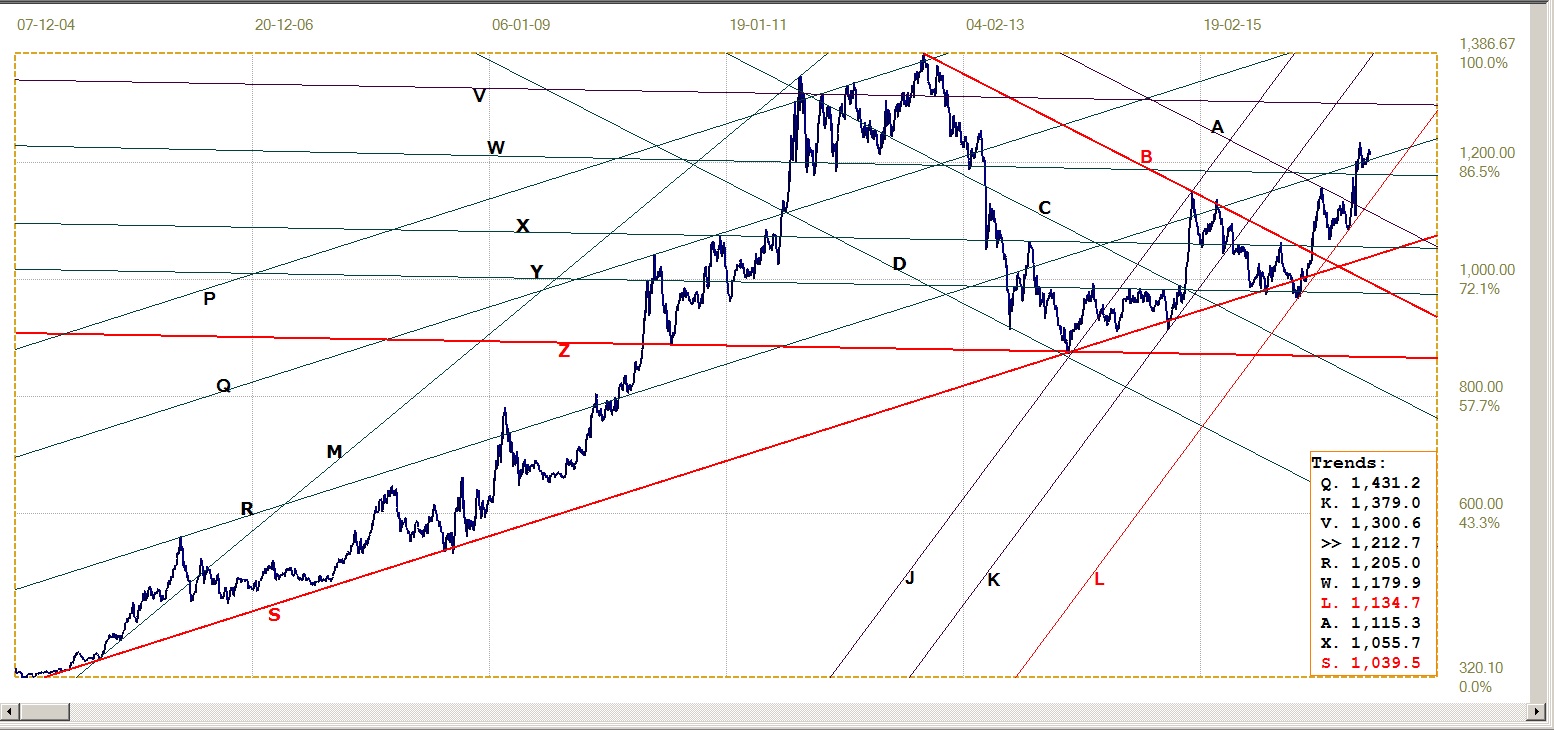
Euro Gold Price – PM Fix in Euro, last = €1212.7 (www.kitco.com)
Silver Daily Fix Chart
The price of silver also corrected after breaking above line Q ($19.49) to set a new recent high. The correction broke marginally below line Q, but quickly recovered and – just like gold – started off the new month on a firm note. It was only the very firm non-farm payroll number on Friday that broke the rising trend. The fix on Friday is well above the support at line Q, but, since it is done in London in their AM, it is a good deal higher than the close in the US, at $19.78 – which is still well clear of the important support at line Q.
Line U was major support for corrections during the very steep bull market into the 2011 high in the price of silver. Line V ($19.29), parallel to line U, has not yet been tested following the rebound high at its intersection with line L ($17.27) and it is in no immediate danger of a test. However, that steep trend support should be seen as the main indicator whether the new bull market is intact.
A break lower at line V will not mean that the bull trend has ended, but that would imply that the bull market is to settle at a lower gradient – and take longer to reach the very important resistance at line P ($22.76). Line P is the lower boundary of the large pennant, YP. The price of silver broke lower at the end of leg 4 of the pennant – which is against the normal development of this kind of chart formation; the price should have rebounded into the bullish leg 5, to break above its top at line Y.
Silver Daily Fix, last = $20.22 (www.kitco.com )
US 10-year Treasury Note
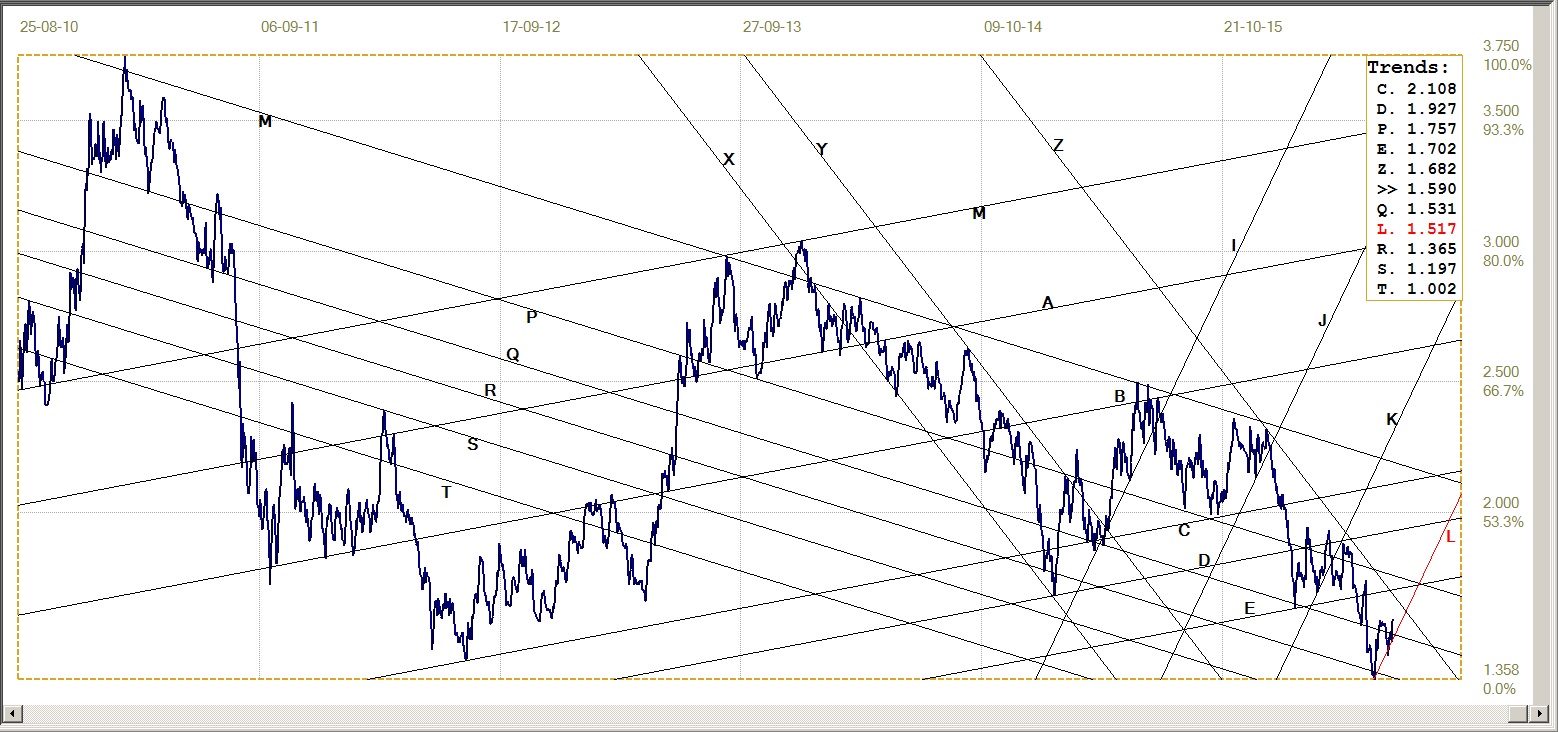
US 10-Year Treasury Note, last = 1.590% (www.investing.com )
Line L (1.517%) has been moved to the recent low in the yield as lower boundary of bear channel IJKL. Following the rebound higher that then carried the yield back above the market support at line Q (1.531%), a quick rally broke back below line Q, but then failed to break lower from bear channel KL.
The new break above line Q is holding to the steep bear channel, for a bearish bias. However, bull channel XYZ (1.682) is still intact and it would be premature to think of a bearish bond market while that channel holds. Further market support can also come into play at lines E (1.702%) and P (1.757%). The yield is also still quite far from the congested area around and just above the 2.0% level that was so strongly contested late in 2015 and for the first few months of 2016.
West Texas Intermediate Crude. Daily close
Concern that the global economy – perhaps outside of parts of Asia – is still steadily cooling off, meant that demand for oil is still has less than supply, giving increasing supply from Iran and other producers that are slowly recovering to earlier levels of output and thus sustaining a growing surplus.
The bearish trend in the price of crude, after failing to hold above key psychological support at $50/bbl, was halted last week at support of line G ($40.12), followed by a small rebound. It still remains to be seen whether this is only a technical reaction within the bear market, or whether the support at line G can now hold. To become more bullish, the price of crude first has to break clear above support from steep bear channel JKL, currently at $44.88 for Monday, but declining quite rapidly.
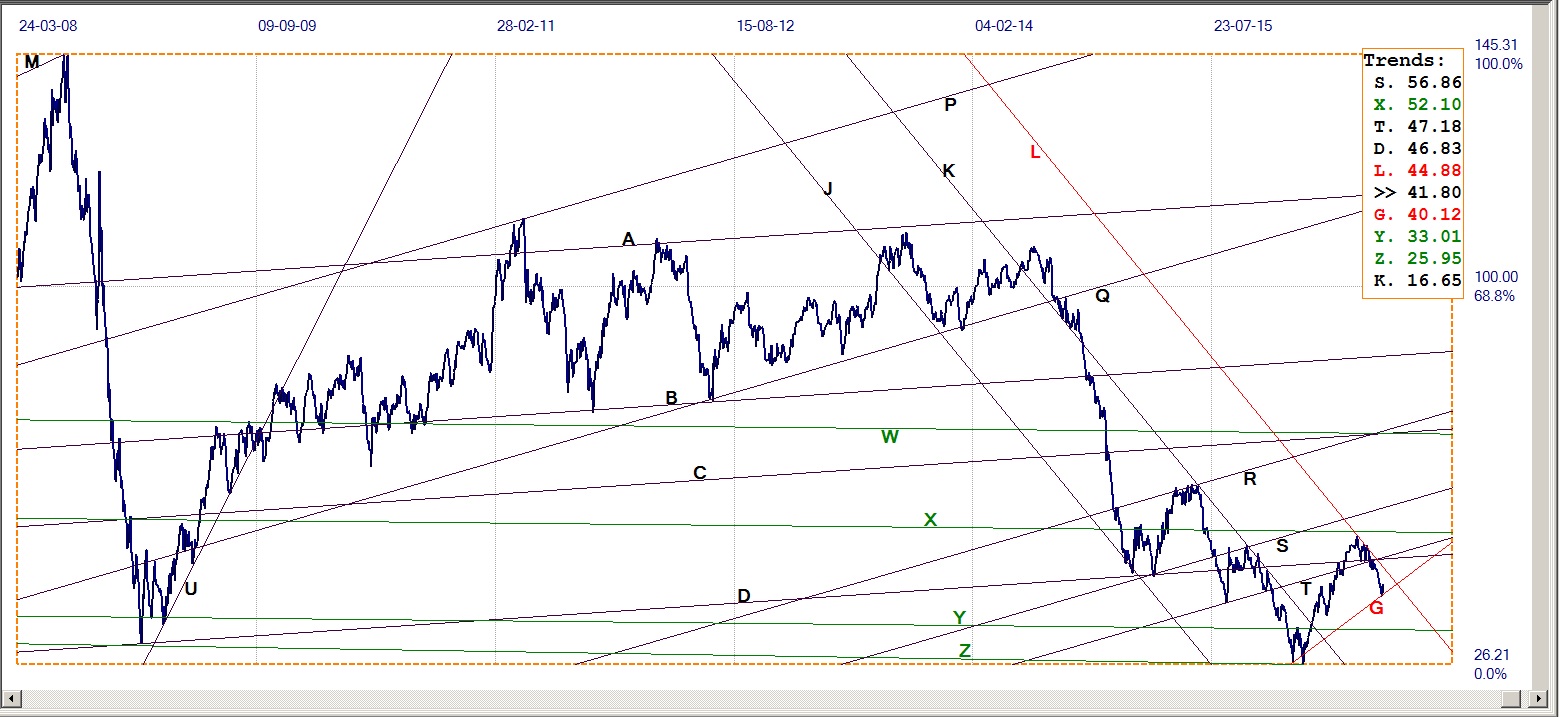
WTI Crude – Daily close, last = $41.80 (www.investing.com )
©2016 daan joubert, Rights Reserved
chartsym (at) gmail(dot)com


