Optimum Entry Point For Gold And Silver Stocks


When you are following the markets closely day after day it can be easy to lose sight of the big picture. So with the "everything bubble" getting closer to bursting, leading to universal mess and mayhem, there could not be a better time to look at the long-term picture for gold and silver, in order to see whether they are going to salute and go down with the ship, as they did in 2008, or constitute a lifeboat and a profitable means of escape for more fortunate investors.
I am therefore pleased to be able to report that it will almost certainly be the latter, for reasons that we will now elucidate on the respective long-term charts for gold, then silver.
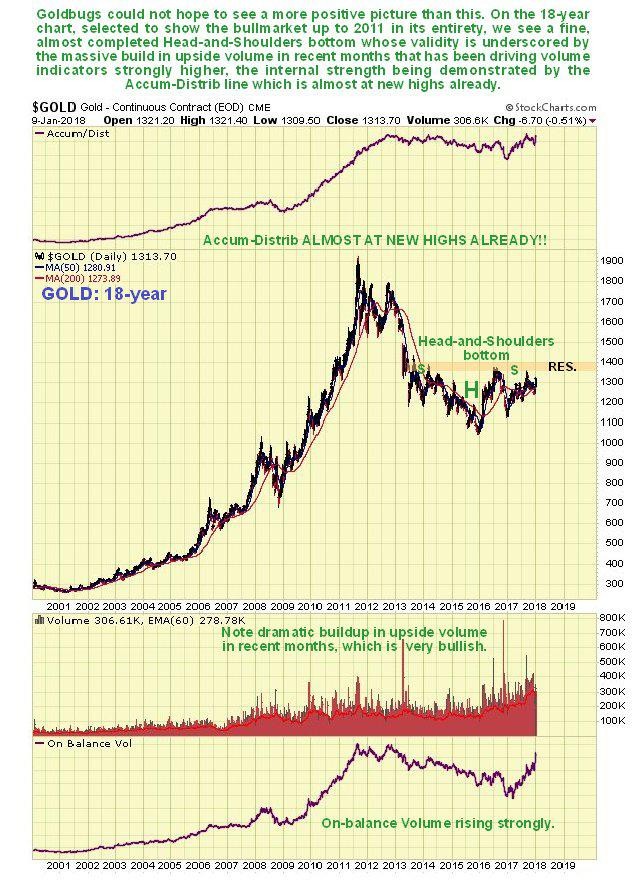
On gold's latest 18-year chart—a time period selected to show the prior 2000's bull market in its entirety—we can readily see that a potential Head-and-Shoulders bottom has been forming since 2013, and the probability that this is the genuine article, the "real deal" is vastly improved by the dramatic increase in upside volume over the past two years as this base pattern has approached completion, which has driven volume indicators strongly higher over the past year, such that, rather incredibly, the Accum-Distrib line is already close to making new highs, which is a very bullish indication indeed.
It's pretty much the same story for silver, with two key differences—silver's Head-and-Shoulders bottom is down-sloping and the volume indicators are not quite as strong. However, these manifestations are not negative, for it is normal for silver to underperform gold towards the end of a sector bear market and during the early stages of a bull market.

Are there any precious metals stocks showing similar bottoming patterns? There certainly are—loads of them, and we will have a look at two examples here, one for a larger gold stock and one for a larger silver stock, to illustrate the point, so that you will understand that this is not just an academic exercise—and that you are currently being showered in opportunities to make big money in this sector.
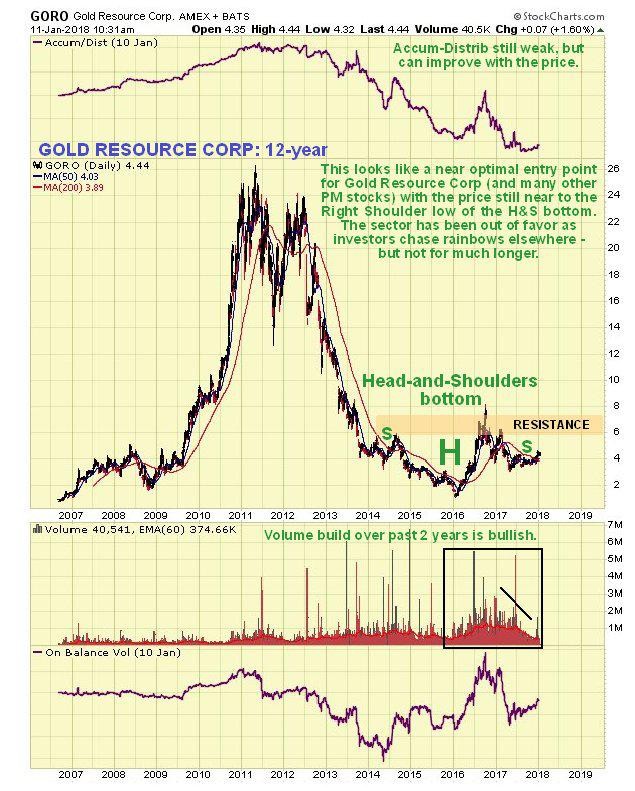
The long-term chart for Gold Resource Corp. (GORO:NYSE.MKT) shows that it is completing a giant Head-and-Shoulders bottom that parallels the one in gold itself, and since the price is still quite close to the low of the Right Shoulder low of the pattern, it is at a good entry point.
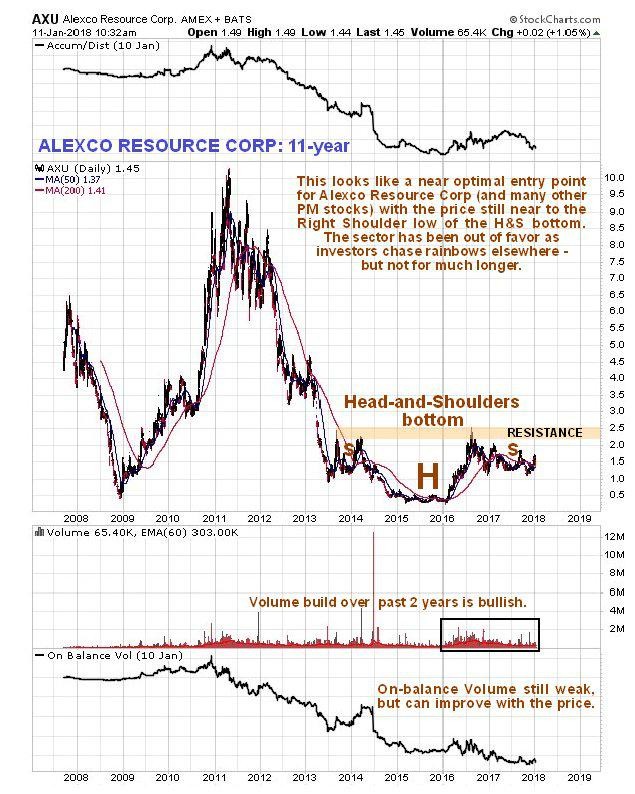
The long-term chart for Alexco Resource Corp. (AXU:NYSE.MKT; AXR:TSX) shows that it is completing a fine giant Head-and-Shoulders bottom that parallels the one in silver itself, although it is not downsloping, and since the price is also still quite close to the low of the Right Shoulder low of the pattern, it too is at a good entry point.
Gold and silver have not done well in recent years, having been completely overshadowed by the broad stock market and more glamorous sectors like Biotech, Cannabis, Cryptocurrencies and the FANGS, etc. If they go roaring up, then it means that something else is going to have to go down, and that probably means most everything else in a market crash, which is already being predicated by action in the bond market and other factors, and all the easy money momentum chasers who are now almost everywhere are going to wind up being slaughtered en masse like Pilot Whales on a Faroes beach. We are not going to let that happen to us.
*********
Clive Maund has been president of www.clivemaund.com, a successful resource sector website, since its inception in 2003. He has 30 years' experience in technical analysis and has worked for banks, commodity brokers and stockbrokers in the City of London. He holds a Diploma in Technical Analysis from the UK Society of Technical Analysts.

Clive P. Maund’s interest in markets started when, as an aimless youth searching for direction in his mid-20’s, he inherited some money. Unfortunately it was not enough to live a utopian lifestyle as a playboy or retire very young. Therefore on the advice of his brother, he bought a load of British Petroleum stock, which promptly went up 20% in the space of a few weeks. Clive sold them at the top…which really fired his imagination. The prospect of being able to buy securities and sell them later at a higher price, and make money for doing little or no work was most attractive – and so the quest began, especially as he had been further stoked up by watching from the sidelines with a mixture of fascination and envy as fortunes were made in the roaring gold and silver bull market of the late 70’s.
Clive furthered his education in Technical Analysis or charting by ordering various good books from the US and by applying what he learned at work on an everyday basis. He also obtained the UK Society of Technical Analysts’ Diploma.
The years following 2005 saw the boom phase of the Gold and Silver bull market, until they peaked in late 2011. While there is ongoing debate about whether that was the final high, it is not believed to be because of the continuing global debasement of fiat currency. The bear market since 2011 is viewed as being very similar to the 2-year reaction in the mid-70’s, which was preceded by a powerful advance and was followed by a gigantic parabolic price ramp. Moreover, Precious Metals should come back into their own when the various asset bubbles elsewhere burst, which looks set to happen anytime soon.
Visit Clive at his website: CliveMaund.com


