Our Politicians And “Media Experts” Are Clueless…Time To Buy Gold, Silver And Have A Look At Mining Shares
A venerated elder once said to me, “you can pick your nose but you can’t pick your family.” These are wise words indeed that best explain my attitude toward the current who’s who now running for the highest office in the land. And in case you missed it on the nightly news, it’s once again presidential election time. But the truth is that in America the presidential election cycle never ends. With only seventeen months until the election the media will now focus on the trivial and mundane aspects of each candidate’s position. I’ll make an effort to avoid this as best I can.
Without a doubt the legacy print and broadcast media are dedicated organs of the Democratic Party; how else could someone as ethically challenged as Hillary Rodham Clinton be considered by mainstream media for the highest office in the land? And then there are the Republicans running for POTUS; most of them are decent people, but they’re allowing their consultants to manage their message to the electorate, meaning that none of them will be addressing the issue that will soon overwhelm the nation: How Wall Street and Washington DC have been financially abusing the American people for decades.
With the stock market currently near all-time highs and bond yields at historic lows, this will sound extreme to about 95% of the electorate. But realize that most of those 95% have no idea that the US Treasury is now eighteen-trillion dollars in debt, not to mention “unfunded liabilities” of more than 100 trillion dollars in pension, social security and Medicare obligations that will inevitably be adding trillions more to the national debt each and every year. These entitlements will soon be consuming 100% of tax revenue, requiring all other federal government expenditures (including the military) to be funded by borrowing (issuing even more US Treasury debt).
And then there’s the Wall Street OTC derivative situation. Just as we saw happening during the sub-prime mortgage debacle, when bond yields once again begin to rise, the big NY banks will find themselves in a position where they can’t make good on interest-rate derivative contracts they’ve sold to money managers. This time their fraudulent activities will amount to over 500 trillion dollars – ten times that of the mortgage crisis. What are the candidates’ positions on another Washington bailout for Wall Street when the derivative market craters? No media outlet will be asking this question.
Although those in positions of power and authority will inevitably continue fiddling until Rome ultimately burns, I’m not obligated to sit idly by as they do. But before I go into detail on individual investments, let’s review the inflationary history of the US dollar. The data used in the charts below was compiled from decades of Barron’s magazine, though Barron’s didn’t begin publishing weekly CinC data until February 1931. Prior to 1931 CinC data is from Milton Friedman and Anna Schwartz’s Monetary History of the United States.
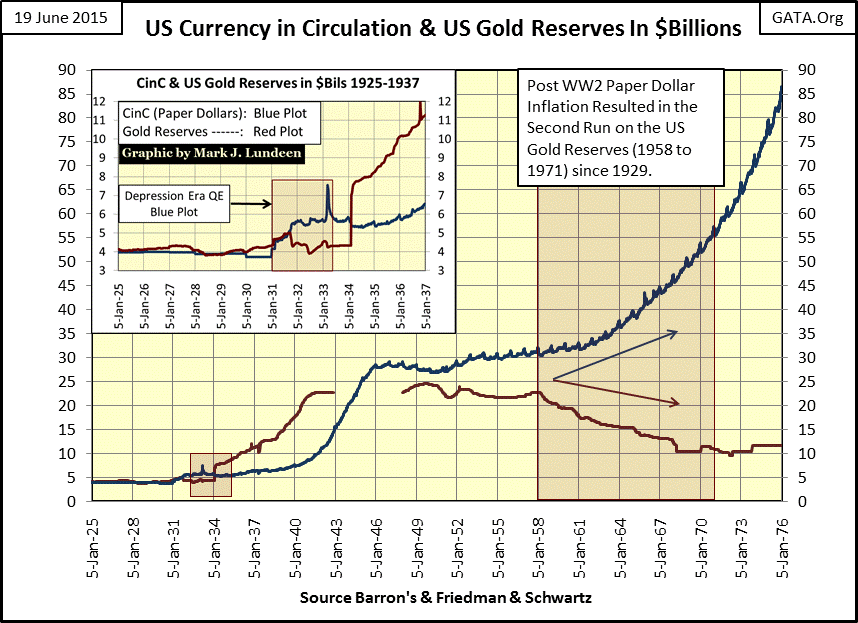
By January of 1925, the US Treasury had issued $3.96 billion paper dollars based on $4.14 billion dollars in gold reserves, as seen in the insert in the chart below, and so it remained until February 1931 when the US Government began what today would be called a program of quantitative easing (QE). Quantitative easing solved none of the economic malaise of the early 1930s, but did result in the first run on the US gold reserve of the 20th century; thus we see the Red Plot (Gold Dollars) falling below the Blue Plot (Paper Dollars) in the chart’s insert. The newly elected Roosevelt administration’s solution to restore the gold standard was to:
- Confiscate the American people’s gold at $20.67 an ounce from 1933-34;
- Make it illegal for private citizens to hold gold bullion;
- Devalue the US dollar from $20.67 to $35 an ounce in February 1934 – almost a 70% haircut in the value of paper dollars.
In the chart’s insert the jump in the Red Plot marks this devaluation, after which the US Treasury once again held more dollars in gold than paper dollars in circulation (CinC).
US gold reserves increased from $7 billion dollars in 1934 to $22 billion dollars in January 1941. This period of history spanned the rise of Adolf Hitler as Chancellor of Germany in January 1933 through the first sixteen months of World War II; European central banks shipped their gold reserves to the NY Federal Reserve bank for safe keeping.
With the US Treasury now flush with European gold, Washington financed its war production with inflation (Blue Plot above). When considering the blood and treasure the United States spent fighting WWII, this doesn’t really bother me. But there is no doubt that this increase in CinC, even though backed by gold, had inflationary consequences. The following Barron’s editorial comments appeared in 1950 and 1951.
“We hope that the government of the United States, despite the big spenders, and the gold tinkerers, maintain a sound dollar, a dollar worth saving, a dollar worth earning, and a dollar that can be traded in any part of the civilized world.”
- Barron’s World at Work, 02 January 1950 issue, Front Page
* * *
“November 15, 1951 (the dollar) reached a new low of 53 cents in terms of 1935-1939 dollar value. In extended comment on the shrinkage of the dollar, the National City Bank’s December Letter says: ‘From the standpoint of the creditor—the buyer of Savings bonds, the pensioner, the insurance beneficiary, the school teacher with lagging pay—the experience during and since World War II has been disheartening. Inflation is a concealed type of tax and these are the people who took the brunt of it.’ In line with the repeated views of Professor Sumner H. Slichter, the City Bank adds: ‘People reconciled to a dollar of wasting value look around for real estate or other equity investments as a hedge against price inflation and dollar shrinkage.’”
- Barron’s Editorial, 31 Dec 1951
The genesis of our current economic and monetary problems goes back many decades.
For the next seven years (1950-57 above) CinC increased slightly as gold reserves ebbed. Then in 1958 the second run on US gold reserves of the 20th century (1958-1971) began for the simple reason that the US continued to issue an ever increasing volume of unbacked paper dollars in excess of the Treasury’s gold reserves. Europe’s central banks had deposited their gold in the US before WWII and were content to keep their gold in New York after the war as long as the US dollar was redeemable at $35 an ounce. But their attitude toward keeping monetary reserves in dollars versus gold bullion began changing in 1958.
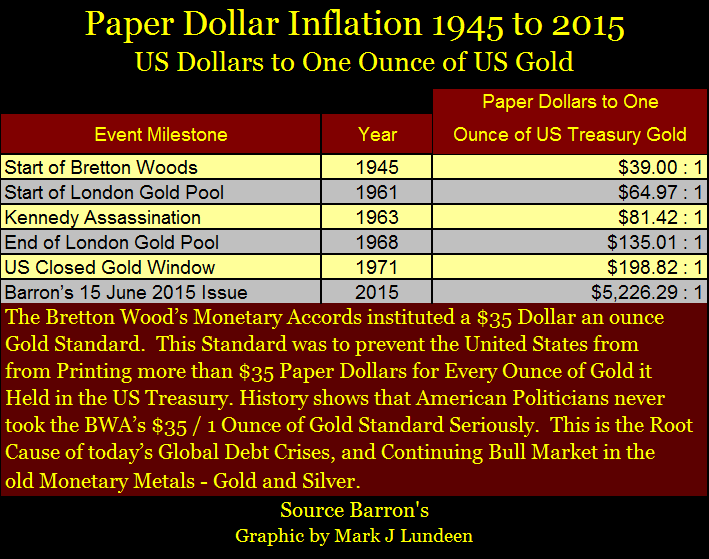
The table below lists the ratio of paper dollars to one ounce of US Treasury gold at key points from the ratification of the Bretton Wood’s Monetary Accord in 1945 to the US Treasury’s unilateral termination of the gold standard in 1971, (plus the ratio in June 2015). Nixon may have closed the Treasury’s gold window in 1971, but what is not generally known is that the Bretton Woods’ $35 an ounce gold peg was already a much abused legal fiction by the time he took office in 1969.
“Bankers know that history is inflationary and that paper money is the last thing a wise man will hoard.”
- Will Durant
It’s important to realize that up until the gold standard was terminated in August 1971, there was no demand from the business community or the general population to unshackle the growth of CinC from the Bretton Woods $35 an ounce gold peg. In fact the press conference announcing the termination of the convertibility of paper dollars into US Treasury gold was met with outrage. Treasury Secretary Connelly’s reply to reporters was cynical and unsympathetic.
“The dollar may be our currency, but it is your problem.”
- John Connelly – US Secretary of the Treasury August 1971.
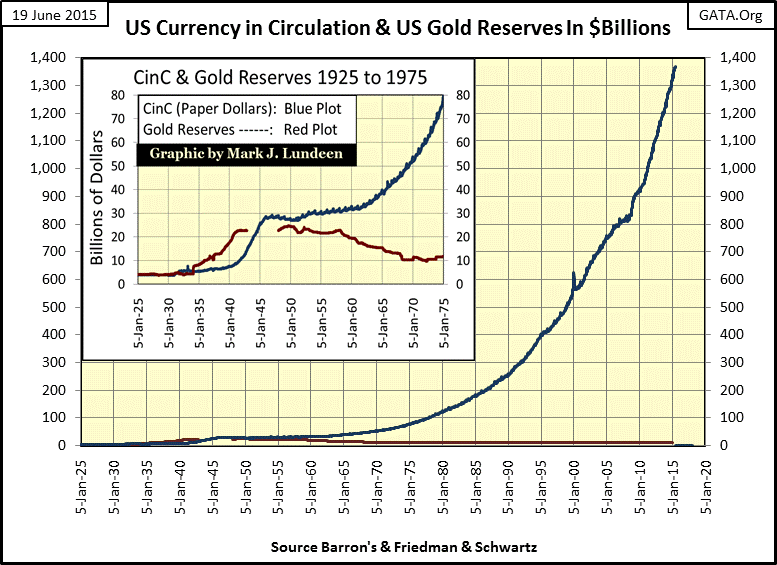
Below I’ve plotted the past ninety years of CinC expansion against US Gold Reserves. Note that reported US gold reserves have changed little since 1970 as the volume of paper dollars in circulation has exploded. With this explosion of dollars in circulation came an explosion of debt in all levels of society, increases in consumer and real-estate prices and one BS bull market after another on Wall Street.
There is good reason to doubt the US Treasury’s claim that it has more than 8,000 tons of monetary gold in its vaults. The Federal Reserve, after several years of searching, can’t seem to locate Germany’s 1,800 tons of monetary gold in its New York branch basement vault. Having followed the work of the Gold Anti-Trust Action Committee (GATA) since 1998, I have good reason to suspect that most of the West’s monetary gold is now long gone, leased to Wall-Street banks who then sold it on the open market to contain rising prices. Alan Greenspan admitted to exactly that in congressional testimony in 1998, a year when the price of gold was generally below $300.
"Central banks stand ready to * lease gold * in increasing quantities should the price rise."
- Alan Greenspan: Congressional Testimony 1998
How much additional central bank gold has been “leased” since 1998 as the price of gold soared to $1,888 at its peak in August 2011? That’s a secret central banks refuse to disclose to the public.
“The last duty of a central banker is to tell the public the truth.”
- Alan Blinder, Vice Chairman of the Federal Reserve, June 1994
What Greenspan didn’t offer, and no congressman asked was how these central banks were expected to recover their leased monetary gold from Wall Street since Wall Street sold it and now it’s gone. Today, in 2015 (two decades after Greenspan’s comments) I consider most central bank gold to be missing in action, including the US Treasury’s gold reserves which have not been properly audited since the Eisenhower administration.
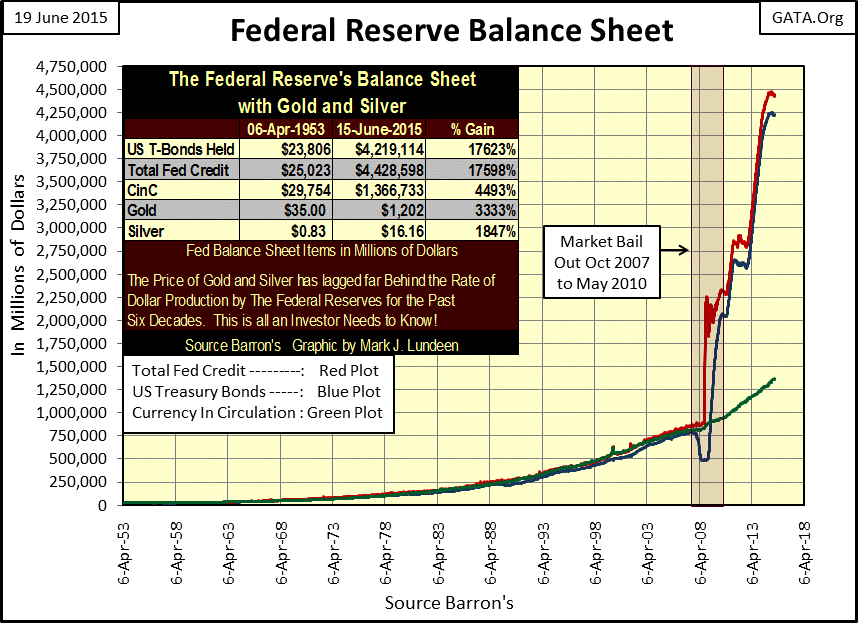
It gets worse. The explosion in CinC since 1971 (Blue Plot above & Green Plot below) is dwarfed by the post mortgage crisis expansion of credit (Red and Blue plots below). The post credit-crisis market bubble in stocks and bonds has been supported by this grotesque expansion of credit.
The point of this article is that since the Great Depression the volume of paper dollars (and dollars in credit) have increased greatly, while much of the gold bullion once available in the Western world has migrated to Asia. Currently dollar inflation is all that is supporting financial asset valuations, but bubble valuations are always at risk of sudden deflation. And looking at the Fed’s balance sheet above, the risk of another Great Depression event when this historic bloom in currency and credit goes bust is extremely great, (not that anyone currently running for President would have any comment on this).
Keeping in mind that I have no crystal ball, but considering no bull market in stocks and bonds can go on forever, the summer of 2015 seems a good time to sell a significant percentage of one’s stocks and bonds, pay your taxes to the people responsible for this mess, and then use the proceeds to purchase what Western central banks have been selling (and Asian central banks have been buying) for decades – physical gold. Silver should also be accumulated. Currently with the silver to gold ratio at more than 70 ounces of silver per ounce of gold, allocating equal dollar amounts to gold and silver seems prudent.
One more investment I think everyone should seriously consider is the precious metal miners. Currently many of these companies are operating in an environment where the cost of production is above the price of the metal they mine, but that can’t last forever.
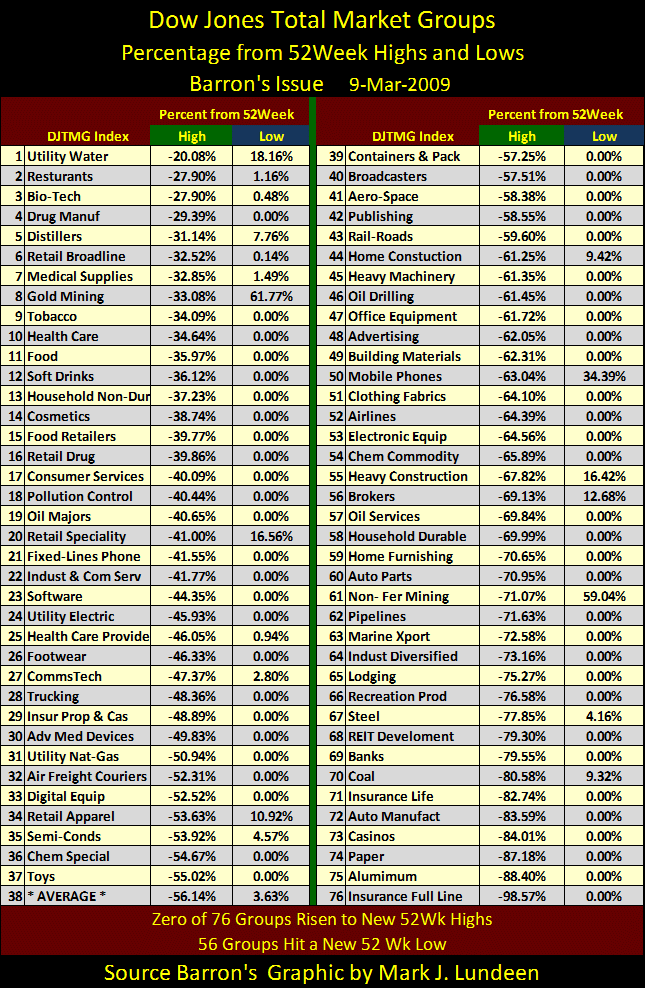
Gold mining has historically been countercyclical to the bull and bear markets on Wall Street. Since 1920 bull market gains in the gold miners have not only exceeded those in the Dow Jones, but have always ended exceeded the rate of inflation as measured by increases in CinC. That was certainly true at the credit-crisis bear market bottom. The gold miners (#8 below), in a week that saw fifty six Dow Jones Total Market Group (DJTMG) indexes make new 52Wk Lows had risen 61.77% from their last 52Wk Lows of 28 October 2008, and would increase to over 100% by June 2009.
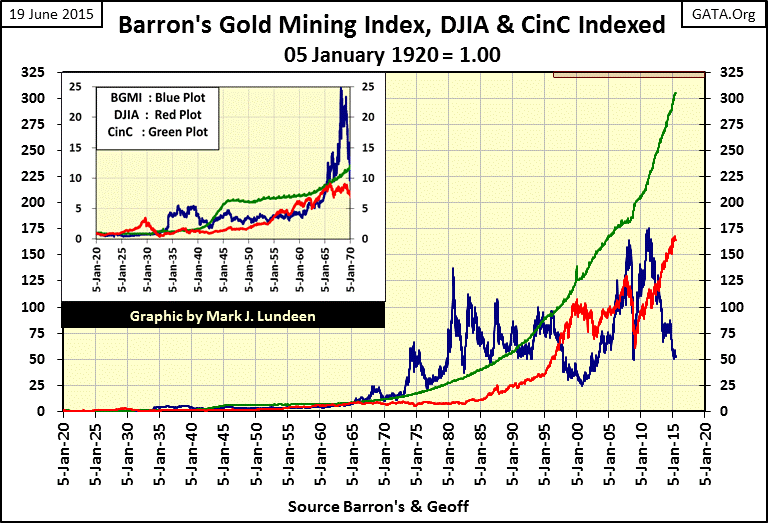
The past is no guarantee of future performance, but the chart below records the past ninety-five years of the Barron’s Gold Mining Index (BGMI / Blue Plot), the Dow Jones (Red Plot) and US CinC (Paper Dollars in Circulation / Green Plot). In the insert we see that during the Roaring 1920s the BGMI didn’t do much while the Dow Jones increased by a factor of 3.5 from January 1920 through September 1929; its Roaring 20s market top. The BGMI, being countercyclical to the stock market, only declined by 14% during the 1929-32 Great Depression crash, and when its bull market began in the early 1930s, shares of the gold miners increased by a factor 5.50 by March of 1936: 200% better than the Dow’s 1929 top.
Returns for both the Dow Jones and the BGMI fell below the rate of inflation (as measured by CinC ) during World War II. However by the 1960s it had become clear that it was the BGMI, not the Dow Jones that was actually providing investors with returns above the rate of inflation and would continue to do so for the next thirty years. But then, from 1966 to 1996, volatility plagued the BGMI, and apparently frightened most investors away from the sector. But note that from 1966 to 1991, advances in the BGMI never fell below the rate of CinC inflation.
Since its bottom in 2001 until its April 2011 top, the BGMI has consistently outperformed the Dow Jones. Note too that since the BGMI bottomed during the 2008 credit-crisis along with the Dow Jones, it has more than tripled from October 2008 to the end of April 2011 (thirty months), a gain unmatched by the Dow Jones over the past seven years.
Currently the BGMI is down 70% from its April 2011 highs, all the way back to where it was in October 2008 – (50). But there is plenty of historical precedent to anticipate that the BGMI will be resuming its bull market advance that will ultimately take it far above the Green CinC plot when the Dow Jones and the general stock and bond markets once again begin deflating as they must when interest rates and bond yield increase.
People living in the dollar economy will soon discover just how little gold and silver are available for purchase after decades of central bank suppression of the gold and silver markets. If people want to invest their dollars in precious metals, they will have to buy gold where they can find it – ore reserves owned by mining companies.
Here’s a speculative exploration play I’ve owned for well over a decade: Eskay Mining (ESK:TSV). The company’s land package is located in British Columbia, an ideal location considering that Canada is a politically stable country unlikely to confiscate foreign investors’ assets. Like the entire precious metals sector, Eskay Mining has fallen on hard time. The company is currently managed by Mr. Mac Balkam, who purchased his shares of Eskay on the open market with several million dollars of his own money. So management with over a 10% stake in the company’s 97 million share float has a personal interest in the company’s success.
To date Eskay has spent $35 million dollars in exploration of its 130,000 acre claim surrounding Barrick Gold Corporation's prolific Eskay Creek Mine in British Columbia, Canada. This mine is no longer in operation, but when it was annual production was 320,784 ounces of gold along with 15.5 million ounces of silver. It’s important to know that Eskay Mining’s land package is located in a region where economic precious metals ore bodies have been found in the past. The company’s geophysical data has been compiled into a 3D model package to be viewed by potential partners, which the company actively seeks.
The current excitement for Eskay shareholders is the success Seabridge Gold and Pretivm have had with their properties sharing Eskay’s Cory Property eastern border. Here is a quote from Mr. Balkam on the potential for our neighbors:
“Eskay management will continue to approach potential JV partners to work with us to fully explore our projects. The closer Seabridge and/or Pretivm are to completing their plans to go to production the easier our task should get. Our neighbors Pretivm and Seabridge's deposits are among the largest, richest undeveloped deposits in the world. It is possible they are the largest in the world.”
As I said; the best place to find gold is where gold has been found before.
Eskay mining, like all exploration shares are not intended for widows and orphans. Keep in mind that there is no guarantee of a profitable outcome investing in Eskay, so due diligence is required. But should Eskay find the proper major to enter into a joint venture to explore their vast property, the prospects for discovery of an ore body similar to the one found by Seabridge or Pretivm are very good. The leverage a small company like Eskay has, should it find a significant deposit of precious metal ore is huge. However, based on the BGMI and Dow Jones chart above, I expect Eskay, and the rest of the precious metals mining industry will have to wait for the next stock market correction before the gold and silver mining industry’s bull market resumes.
********


