Outlook For The HUI Gold Bugs Index
 share
share
 share
share
 share
share
 share
share
 share
share
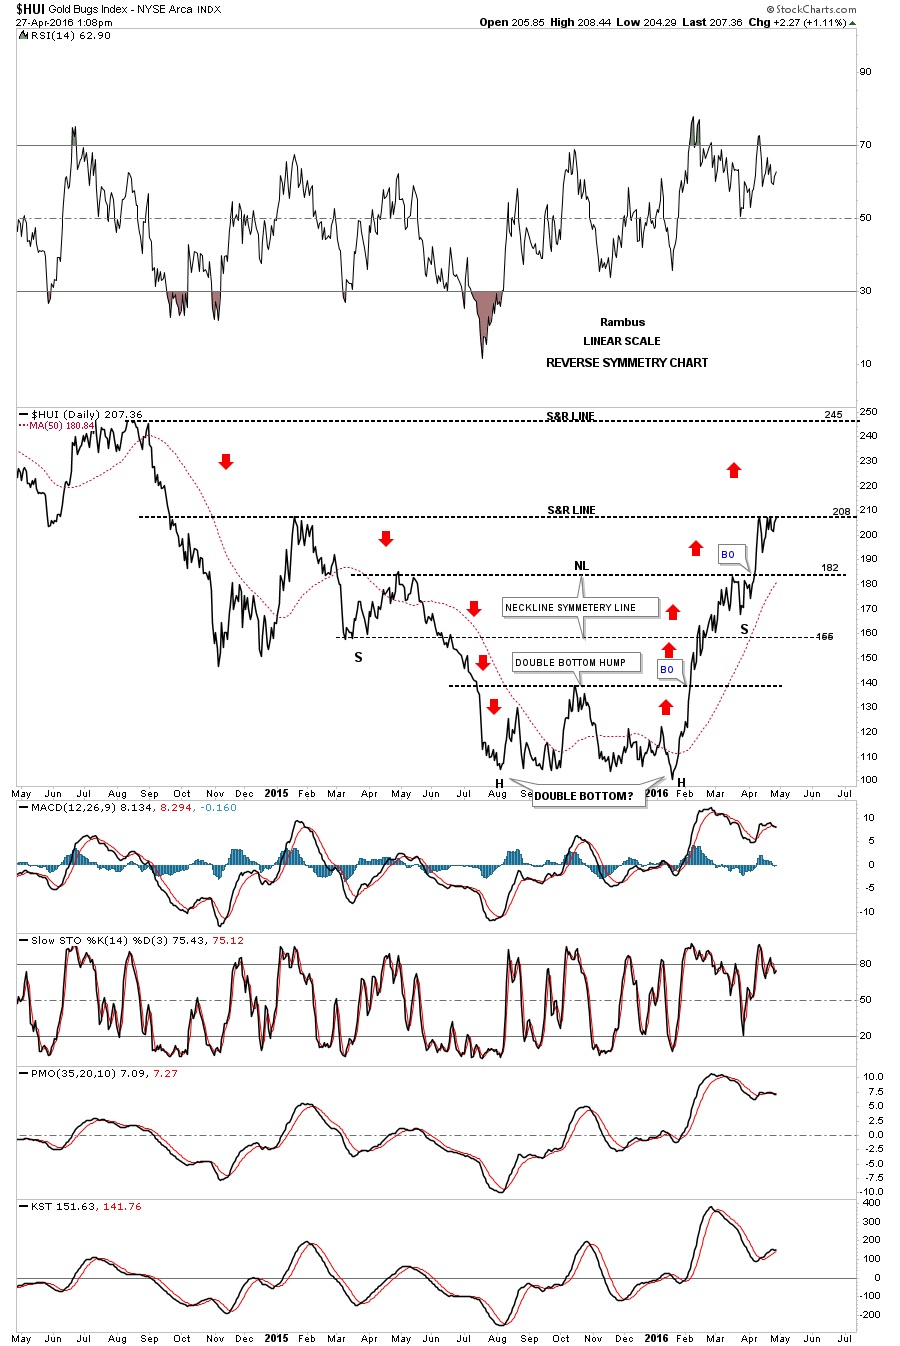
Below is a two-year daily chart for the HUI which I first showed you when it broke above the double bottom hump to start its bull market. I call this chart the Reverse Symmetry chart as shown by the red arrows. How a stock comes down, especially in a strong move, will reverse symmetry back up over the same area. It’s more of an art than a science. You can see the rally off of the mid-January low found a little resistance at 182 before it broke through. Now it’s testing the next overhead resistance line at the 208 area and has been finding some resistance which we should initial expect. Today is the fourth time that the HUI has tested the 208 area from below. A breakout above the 208 area will put the next area of resistance on the map at 250 or so…which would happen fairly quickly as the decline back in 2014 was pretty steep. If the HUI fails to breakout right here at 208, then support will show up at the previous high at 182 or so.
share
share
share
share
share
 Meet Rambus, a seasoned trader and technical analyst renowned for his unbiased and insightful chart work. Through his website, Rambus Chartology, and Substack newsletter, Rambus shares his expertise with a global community of subscribers, providing daily updates, commentaries, and hands-on training in the art and science of chartology. With his calm, humble, and down-to-earth approach, Rambus demystifies complex market trends, helping his followers navigate the challenges of today's volatile markets. Join the Rambus Chartology community today and discover a unique blend of technical analysis, trading expertise, and time-tested protocols. Subscribe now at www.rambus1.com or https://rambuschartology.substack.com/


