Pallidium Ready For Next Big UPLEG and A Way To Capitalize On It...


The reasons for looking at palladium again here are twofold. One is to point out that after a normal period of consolidation, it looks ready for another significant upleg, the other is that the palladium charts provide further evidence that the metals are now advancing across a broad front – and why shouldn’t they given that the dollar and interest rates are set to drop as the Fed positions itself for another even greater round of QE.
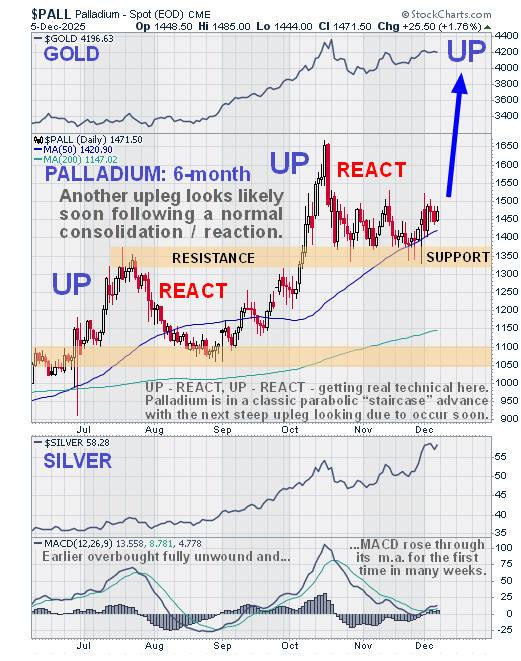
We’ll start by looking at the 6-month chart on which we can see that palladium is set up to start another upleg very soon. You may recall that the last upleg, or the greater part of it, which was the 2nd impulse wave out of its large base pattern, was called on the site at the end of September when it was priced at $1271.50, so it has made a decent gain from that point, even after the consolidation / reaction of the past 6 weeks or so. We can readily see on this chart that it is in a strong uptrend with its moving averages in very bullish alignment and is advancing in a two steps forward and one step back manner – a classic “staircase” pattern and with gold and silver, shown at the top and bottom of the chart, continuing higher, it is in good company. The duration of the 2nd consolidation / reaction has allowed time for the rising 50-day moving average to catch up and thus support renewed advance and it has also allowed the earlier heavily overbought condition to fully unwind, and with the MACD indicator having just crossed its moving average at a low level for the first time in many weeks, the next upleg looks imminent.
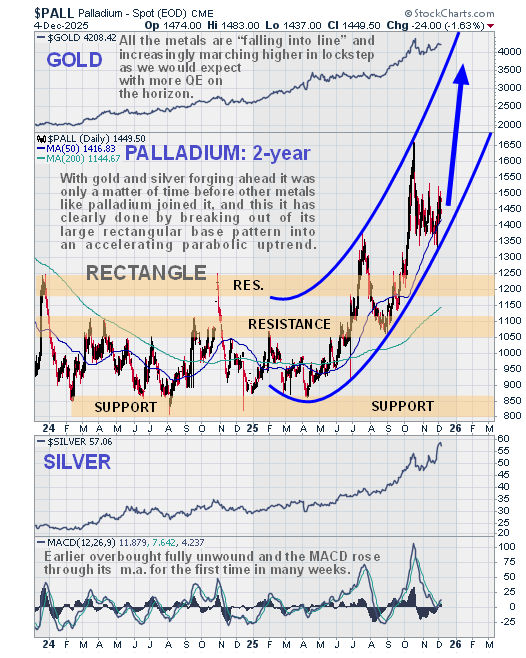
The embedded Cup & Handle base pattern that we observed on a 1-year chart in the late September article which helped us predict the 2nd big upleg remains valid, but we are going to skip now to the 2-year chart to look at something else. On the 2-year chart we can see how palladium is rising out of its large base pattern in an accelerating parabolic uptrend and with the latest (2nd) reaction having brought it back across this uptrend to touch its lower boundary, it looks like it is already on the point of beginning its next major upleg…
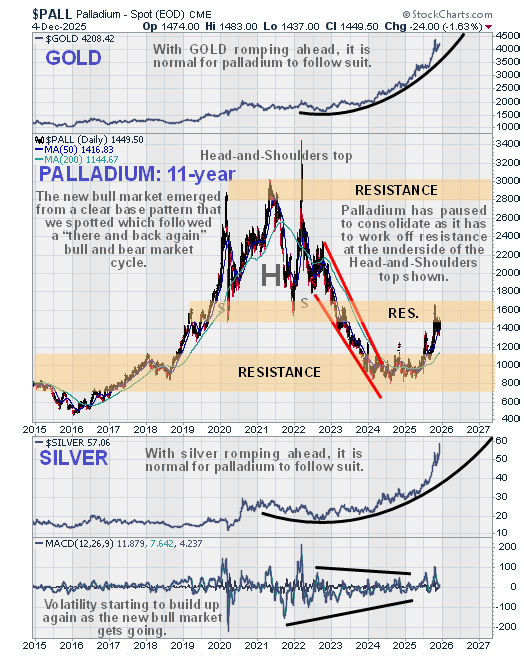
Zooming out again via an 11-year chart, this timeframe being selected so that we can see how it bottomed late 2015 – early 2016, we see that the recent 2nd upleg broke the price clear out of the base pattern that formed from late 2023, after a particularly severe bear market that followed a giant scruffy looking Head-and-Shoulders top that developed between 2020 and 2023. Palladium will have to work its way through some resistance at the underside of this Head-and-Shoulders top which is a reason why the 2nd upleg ended where it did, but given how the metals complex is accelerating to the upside, it should have little trouble breaking above this resistance and forging ahead.
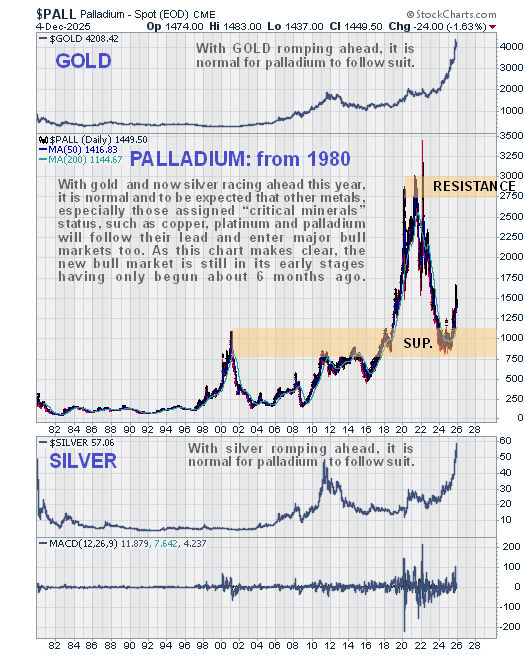
Lastly we will look at a very long-term chart that shows the palladium price going all the way back to the start of the 1980’s. The overall tenor of this chart is positive with a clear upward bias. When the price broke above its 2001 peak in 2018 it ramped up dramatically and then formed a large top pattern as mentioned above between 2020 and 2023. This was followed by a severe bear market decline which stopped right where we would expect it to – in a zone of strong support at and above prior peaks, most notably those of 2001, 2010 and 2014. Then a relatively narrow base pattern formed which led to this year’s breakout into a major new bull market and this chart makes clear that this bull market has just gotten started, especially given how gold and silver, shown at the top of the chart, are at new highs and going parabolic as the latest fiat experiment will soon end up in the dustbin of history.
Palladium, closed at $1471.50 on 5th December 25.
********

Clive P. Maund’s interest in markets started when, as an aimless youth searching for direction in his mid-20’s, he inherited some money. Unfortunately it was not enough to live a utopian lifestyle as a playboy or retire very young. Therefore on the advice of his brother, he bought a load of British Petroleum stock, which promptly went up 20% in the space of a few weeks. Clive sold them at the top…which really fired his imagination. The prospect of being able to buy securities and sell them later at a higher price, and make money for doing little or no work was most attractive – and so the quest began, especially as he had been further stoked up by watching from the sidelines with a mixture of fascination and envy as fortunes were made in the roaring gold and silver bull market of the late 70’s.
Clive furthered his education in Technical Analysis or charting by ordering various good books from the US and by applying what he learned at work on an everyday basis. He also obtained the UK Society of Technical Analysts’ Diploma.
The years following 2005 saw the boom phase of the Gold and Silver bull market, until they peaked in late 2011. While there is ongoing debate about whether that was the final high, it is not believed to be because of the continuing global debasement of fiat currency. The bear market since 2011 is viewed as being very similar to the 2-year reaction in the mid-70’s, which was preceded by a powerful advance and was followed by a gigantic parabolic price ramp. Moreover, Precious Metals should come back into their own when the various asset bubbles elsewhere burst, which looks set to happen anytime soon.
Visit Clive at his website: CliveMaund.com


