Perspective Is Everything


Perspective is everything when it comes to the markets. It is always most important to look at the long term charts first and then work your way back to the shorter timeframes. Long term charts also show where major support and resistance resides that can have a calming effect on one’s emotions when the inevitable corrections take place.
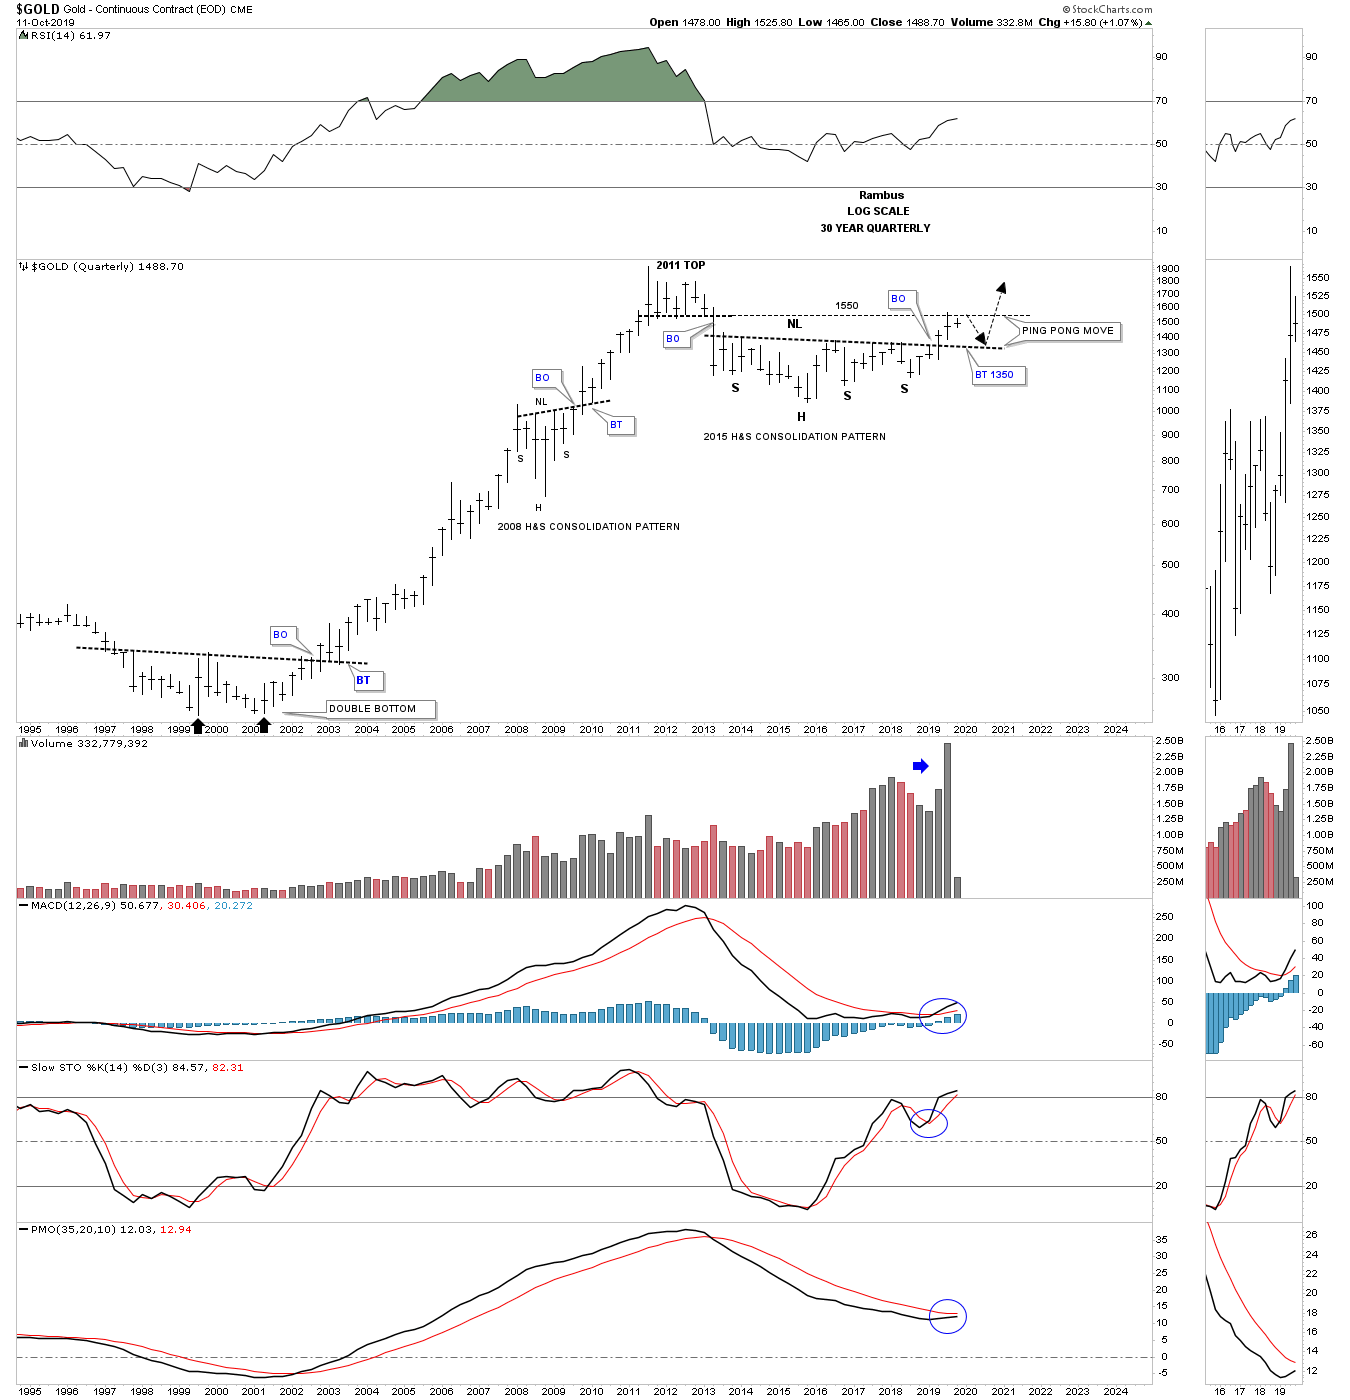
Its been several months or so since we last looked at this 30 year quarterly chart for Gold that gives us very clear roadmap of how the price action may play out over the intermediate to longer term. Looking at the massive double bottom which launched Gold’s 2000’s bull market you can see there were three quarters of price action that took place on the breakout above the double bottom trendline with the final backtest occurring during the 3rd quarter of the breakout.
Now compare our current breakout above the 6 year H&S neckline to the breakout above the double bottom trendline in 2002. How many PM investors do you think were waiting for the backtest to occur in 2002 so they could buy their favorite PM stock? The psychology is no different now then it was during the backtesting phase in 2002. Investors who bought the breakout back then became just as discouraged as many in the PM community are today that don’t understand what is taking place right now.
Everything is big when you look at big chart patterns from the patterns themselves, to the impulse move that follows, to the breaking out and backtesting process. A backtest to the six year neckline around the 1350 area would be perfectly normal and actually should be expected. I’ve mentioned previously that I would prefer to see a backtest to the neckline as that would confirm the massive H&S consolidation pattern and ensure a bull market that could last for years to come.
The last point to make on this 30 year quarterly chart is the ping pong move that is taking place between the neckline and the bottom rail of the 6 point rectangle consolidation pattern that formed at the bull market high in 2011 at 1550. So from a Chartology perspective we couldn’t ask for better price action taking place within the big picture look.
Big patterns lead to big moves.
*********
 Meet Rambus, a seasoned trader and technical analyst renowned for his unbiased and insightful chart work. Through his website, Rambus Chartology, and Substack newsletter, Rambus shares his expertise with a global community of subscribers, providing daily updates, commentaries, and hands-on training in the art and science of chartology. With his calm, humble, and down-to-earth approach, Rambus demystifies complex market trends, helping his followers navigate the challenges of today's volatile markets. Join the Rambus Chartology community today and discover a unique blend of technical analysis, trading expertise, and time-tested protocols. Subscribe now at www.rambus1.com or https://rambuschartology.substack.com/


