Pitchfork Playground - Precious Metals Update


Futures
GC - COMEX Gold – daily
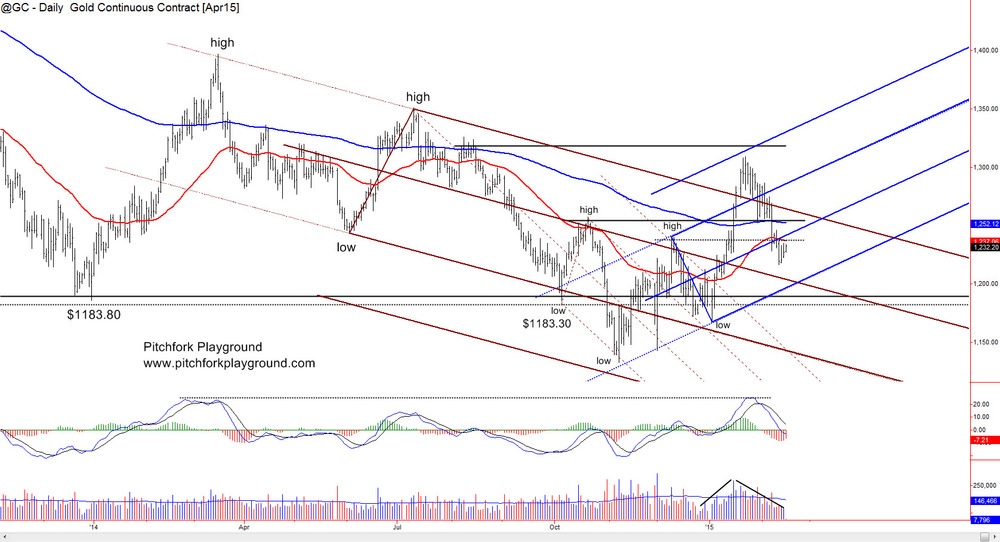
The pullback in Gold continues and price has dropped below the 50 day exponential moving average (EMA). Volume continues to decline which supports our premise that this is a pullback and not the start of a new downtrend. Remember that in an uptrend we want to see volume increase as price rises and then decrease as price consolidates or pulls back. MACD has dipped slightly into bearish mode (below the zero line) but the MACD histogram is rising back towards zero.
~
SI – COMEX Silver – daily
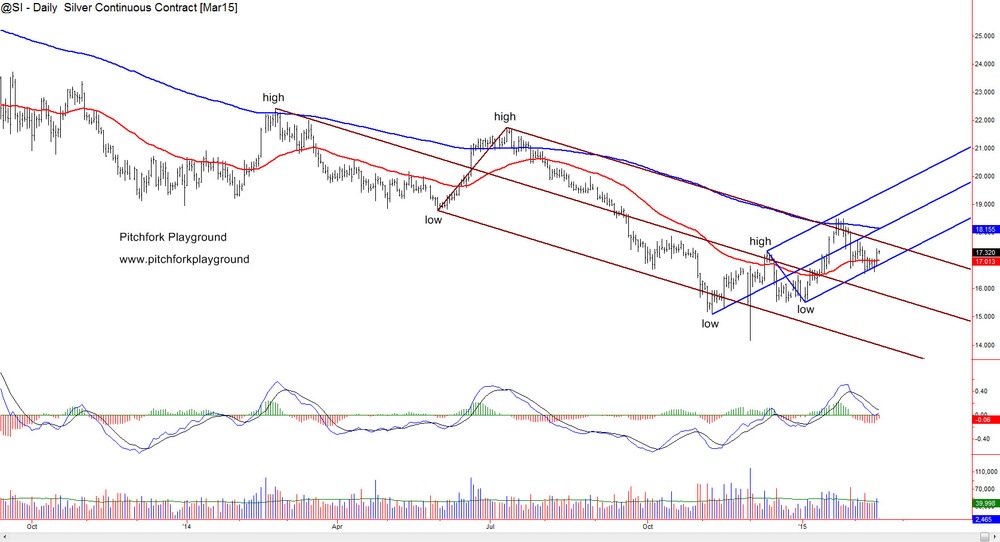
Silver is looking much better than Gold at this point. Price found support along the lower median line of the blue Andrews pitchfork Friday and popped higher on a slight uptick in volume. The upward move took price back above the 50 day EMA and into position for a challenge on resistance at the upper median line of the red Andrews fork (about $17.65). MACD kissed the zero line and turned back up.
~
ETFs & Indexes
GLD – SPDR Gold Trust ETF – daily chart
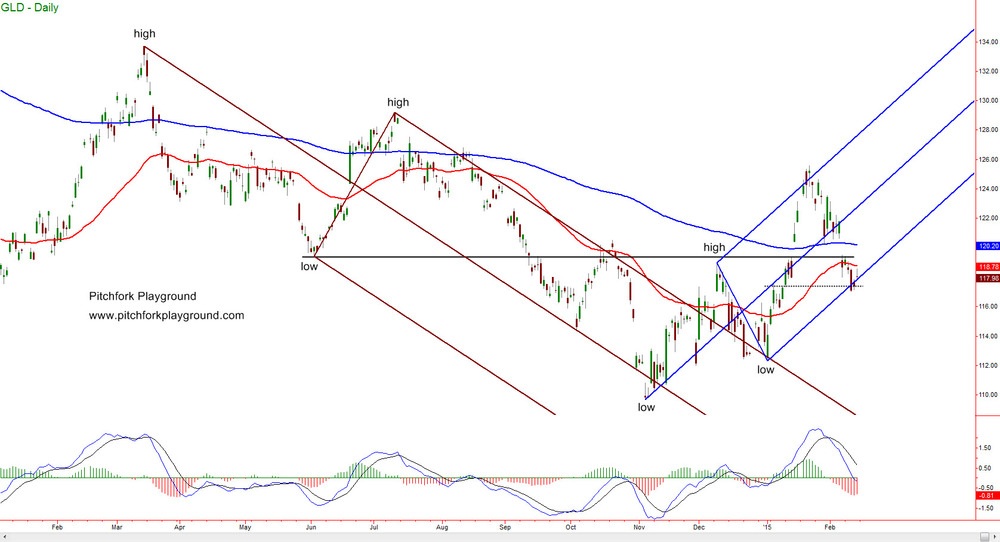
GLD looks a little better than the Gold futures. It appears that price found support along the horizontal support / resistance line and the lower median line of the blue Andrews fork. Price rose Friday to challenge the 50 day EMA but selling pressure came in and drove price back down. The long wick above the candle’s body shows us that the sellers were in control. The doji candlestick on Friday is bearish although it did close above the fork’s lower median line and above Thursday’s high.
~
SLV – iShares Silver Trust ETF – daily chart

SLV gapped up through the 50 day EMA on Friday. This move started from support at the horizontal support / resistance level and the lower median line of the blue Andrews pitchfork. MACD has turned back up and remains in bull mode. We can expect resistance around $16.85 at the upper median line of the red Andrews fork.
~
GDX – Market Vectors Gold Miners ETF – daily chart
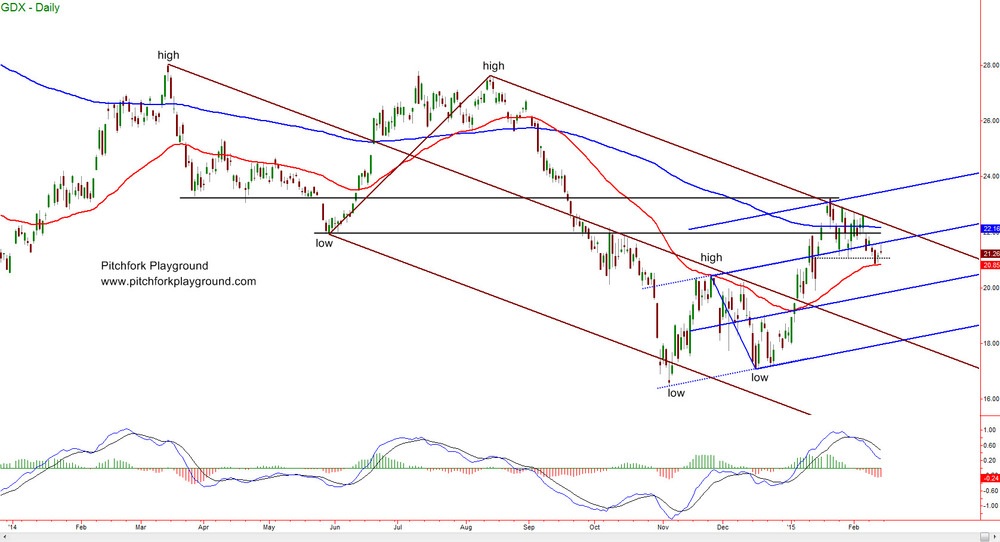
GDX dropped through support last week to test the 50 day EMA. This test was successful and price rose on Friday to challenge the upper median line of the blue modified-Schiff pitchfork. Sellers took control and pushed price back down. Friday’s candle is somewhat bearish with the long upper wick although it did manage to close above the horizontal support level. MACD remains in bull mode.
~
GDXJ – Market Vectors Junior Gold Miners ETF – daily chart
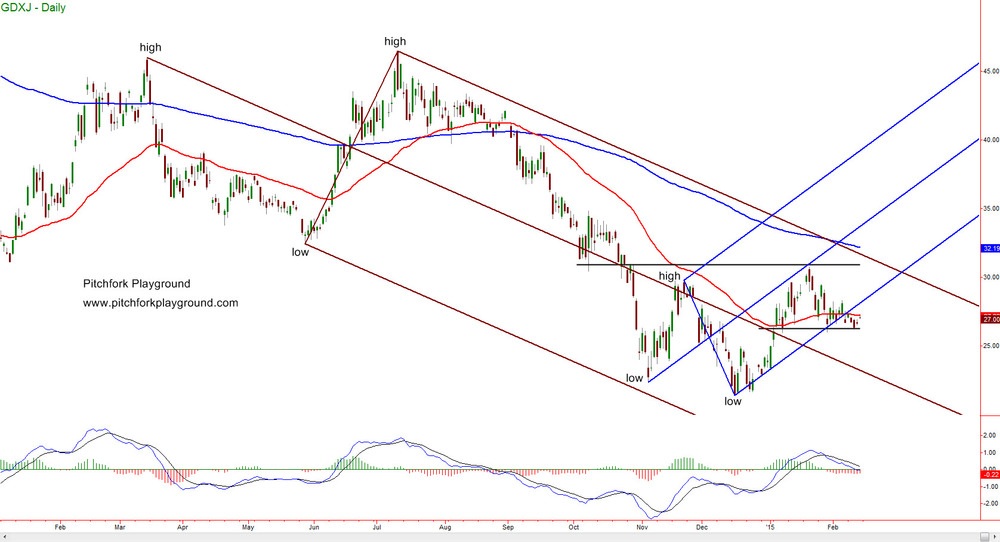
GDXJ waffled sideways last week below the 50 day EMA. This action took price below the lower median line of the blue Andrews pitchfork. It is too early to say that the fork has failed but that is a possibility we will be watching. MACD has kissed the zero line and appears to be turning back up.
~
CEF – Central Fund of Canada – daily chart
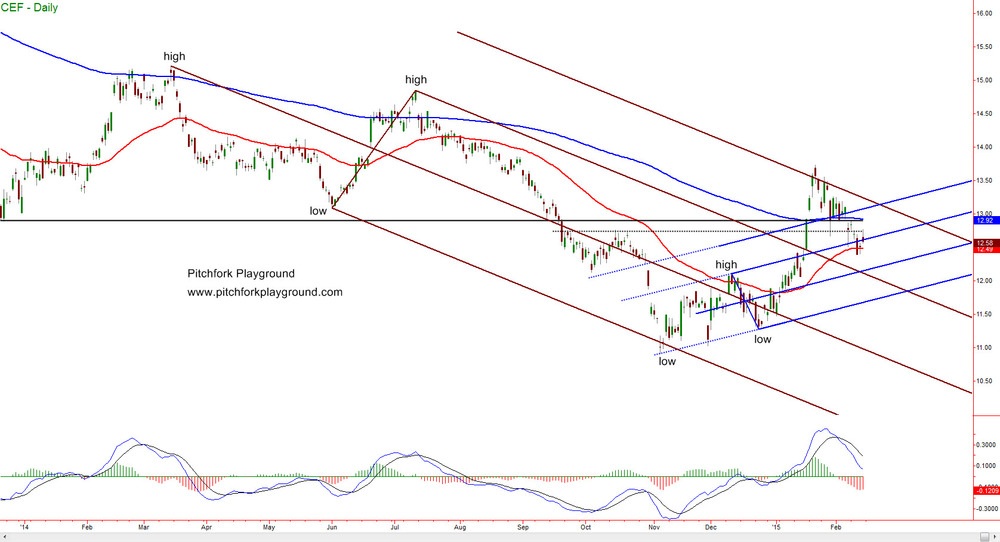
CEF had a rough time last week. Monday’s action wasn’t bad but price dropped below the minor horizontal support level on Tuesday. Then, on Wednesday, CEF dropped through the upper median line of the blue modified-Schiff pitchfork and the 50 day EMA. Price recovered somewhat on Thursday and managed to close above the 50 day average. On Friday price tried to push through resistance but sellers were in charge and the price bar closed just below the fork’s upper median line. MACD is firmly in bull mode. Notice the recent cluster of doji candlesticks in this vehicle. Buyers and sellers are really fighting over whether CEF should head higher or lower from here.
~
HUI – ARCA Gold Bugs Index – daily chart
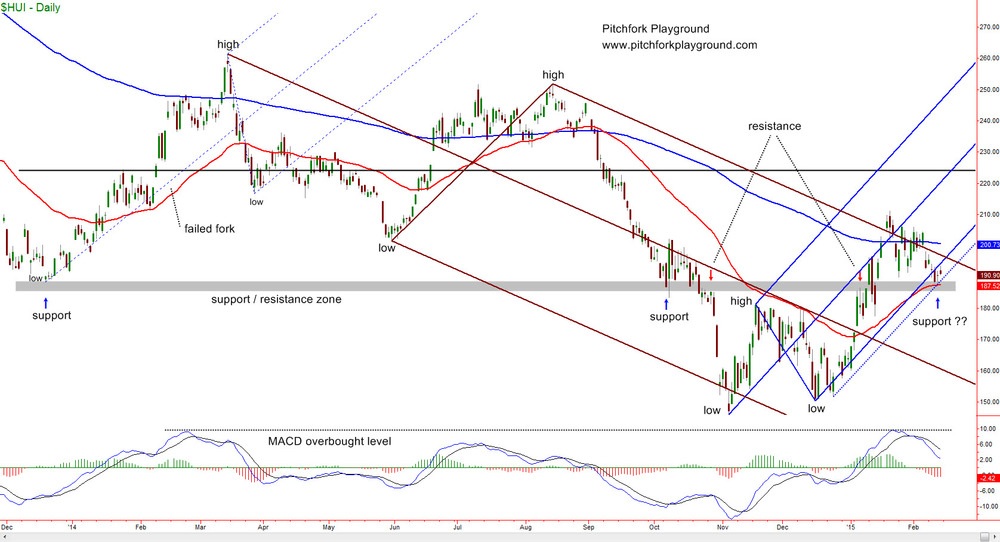
This chart of the HUI is quite cluttered. Please refer to the website for a multi-part examination of the HUI where we discuss this chart in detail by looking at price behavior, Andrews pitchforks, moving averages, support / resistance levels and MACD. HUI Index: Bull Pullback or Bear Rally? (part1) & (part 2).
The synopsis of our HUI analysis is that price has pulled back to a confluence of support levels and then moved higher. The lows on Wednesday and Thursday tested these support levels: the 50 day EMA, the horizontal support / resistance zone, the sliding parallel to the blue Andrews pitchfork and the 38.2% Fibonacci retracement level of the December to January rally (see the website for a chart showing the Fib. retracement). That’s a lot of support and price appears to be moving higher after the test. MACD remains in bull mode.
Junior Miners
We reviewed the charts of more than 100 junior miners this week and found two that we especially liked. When the precious metals finish their bear cycle and return to bull mode, the junior miners are likely to zoom higher. As the saying goes, even pigs fly in a high wind. The better performing juniors today should be the price leaders in a rally.
PZG (AMEX) – Paramount Gold and Silver – daily
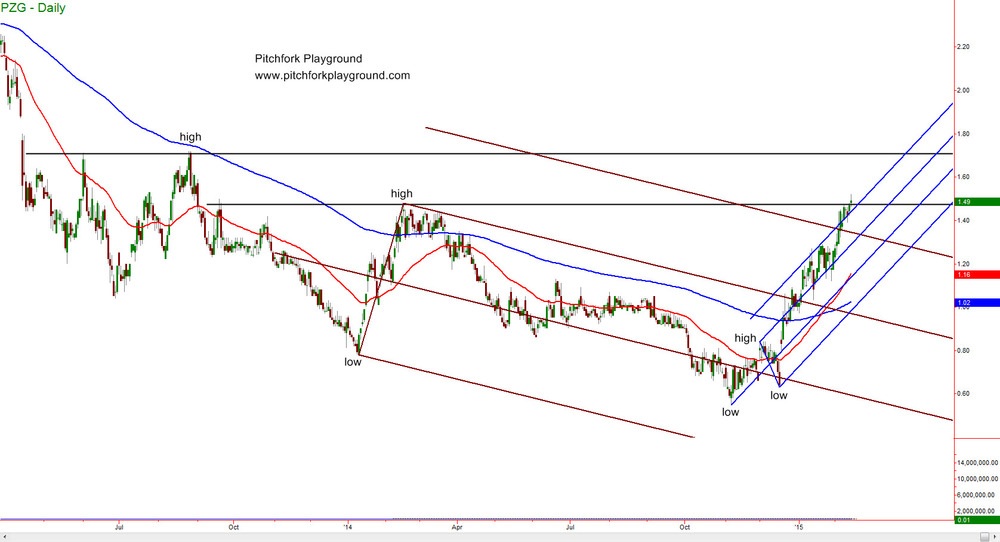
PZG has demonstrated significant strength over the last several months and price broke above a fairly significant resistance level on Friday. The 50 day EMA has crossed above the 200 day average and continues to rise sharply.
We want to be careful with this one – for starters the company is still an explorer and exploration companies tend to be quite volatile. On top of that price is well extended above the 50 day EMA and MACD has reached the same level of overbought-ness that stopped the price rise back in early 2014.
If you are interested in this stock it might be wise to wait for a consolidation or pullback before entering. The stock trades on the AMEX so it should be readily available for trading. As always, do your own due diligence – you are the only person responsible for your trading and investing decisions.
~
CLGRF (OTC) – Claude Resources – daily

For a 30 cent stock Claude Resources has a pretty chart. Volume is running about 100 to 200 thousand shares per day. The modified-Schiff pitchfork is doing a nice job of describing the price action. Price recently pulled back to test support on the 50 day EMA and the fork’s median line – this test was successful and the subsequent upward move has been strong. MACD is firmly in bull mode and the histogram is moving back towards zero. The fork’s upper median line gives us a price target of about 35 cents. Gaining a nickel in price doesn’t sound very exciting but that represents a 15% increase.
This is obviously a junior miner but Claude Resources is in production so it shouldn’t be quite as volatile as the exploration companies. Buying over-the-counter (OTC) stocks is high risk – be careful and perform your due diligence before entering these vehicles.
~
Action in the precious metals and miners remains indecisive. None of the charts we have looked at are downright ugly, but none of them are really exciting either. While we want to believe that a new bullish cycle has begun, the relentless downtrend over the last three years has made us leery. Caution remains the order of the day.
********
Courtesy of http://www.pitchforkplayground.com/


