PM Stocks - Hold Your Head Up!
Hold Your Head Up Original Song from Tom Cellie
http://youtube.com/watch?v=sk68PxILE00
Argent - Hold Your Head Up
The End of the PM Stock Blues?
Part of the difficulty in investing is finding and staying with the fundamentals that are driving a market. The fundamentals will always win out in the end, though sometimes those fundamentals can be easy to ignore. This is especially true in the “information age” where you can read just about anything written on just about any subject. To top it off you can read the gazillions of opinions of others- many based on incorrect fundamentals and many directed at investing in different time-frames. Unfortunately, it even gets tougher in the current environment with its massive deflationary background that is constantly touted by the news media. Today, everybody is a contrarian- just ask them.
In an attempt to avoid all of the noise and to stick with the fundamentals, we recently completed an editorial series attempting to cover the many facets and inter-relationships in play, today. Now, it is time to review some of that material with an eye toward how the fundamentals might affect our Precious Metals investments, especially considering the very negative psychology that has enveloped the Precious Metals Stock complex. After spending some considerable time with the tax season I have reviewed many charts to that end, and I have talked to some very intelligent individuals in regard to where Gold, Silver, and the HUI are, today. To be honest with you, most of those individuals are not particularly positive on the prospects of the PM stocks going forward over the coming months due to the “sharp break” in the Gold and Silver charts; but after the chart review I simply do not share the negativity. Thus I have two choices as I write. I can let the opinions of others sway me toward caution, or I can lay out what I see for you to consider for yourself. I don’t think you will ever have to worry which fork in the road I will take so let’s get to it. In the face of all of the cries of deflation and potential PM stock crashes, the PM stocks have held their head high as I would expect with all of the signs of inflation bubbling around us. What I am seeing in the charts suggests that the PM stocks are ready to take a step up in upward volatility. I think some investors will soon be surprised.
It’s The Dollar
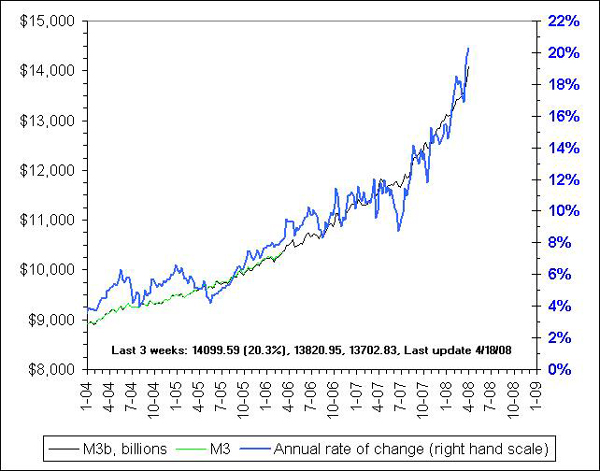
We have discussed in detail how we think the US Dollar is the main fundamental driver of Gold, Silver, and the PM stocks in this environment. All of the other factors are simply modifiers of the markets’ price movements. Does that mean that the price movements in the Dollar Chart will exactly correspond to movements in the PM sector? No. Sometimes we will see lags in price movement as the psychology of investors takes time to come to the correct conclusion concerning the fundamentals. We have seen it all, before. Below, we have a chart of the Dollar Inflation as represented by M3. M3 appears to be shooting for the moon; in fact, it appears that the acceleration of Dollar printing is alive and well. If there was any question about the intentions of the Fed in regard to the “print or die” corner they have been backed into, the JPM- Bear Stearns-Fed deal should have cleared that up. The simultaneous creation of “facilities” where the Fed is willing to trade their own government debt for paper that has no market backs that deal up considerably in terms of more Dollar Inflation to come. In the end it all looks like monetization of private debt to me. The following chart of M3 suggests that Dollar Inflation is rising at around a 20% rate at this time. This chart is courtesy ofhttp://www.nowandfutures.com/key_stats.html.
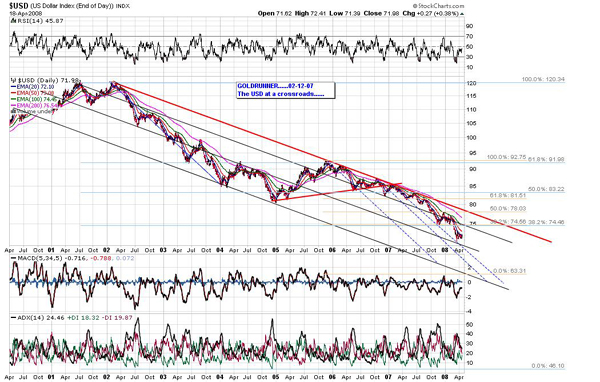
The next chart is one we have been following for months. The USD Index has fallen to hit our target almost precisely where the dotted blue line and the black angled line meet. I am hearing a lot of noise about the US Dollar starting a huge rally, here, but I certainly have my doubts at this time. That recent bottom in the Dollar looks more like a “momentum bottom” to me with more weakness coming with a move at least back to the black line. This is especially true considering the acceleration in M3 as we have shown in the chart, above.
Thus, when we consider the main driver of the PM sector at this time, the US Dollar, we have Dollar printing accelerating while the value of the Dollar is dropping. The Fed really cannot stop the massive Dollar inflation in this environment. In the end, the Dollar inflation will continue its parabolic trek.
GOLD
We have been tracking the movement of $Gold in terms of the movements of Gold in the 70’s Bull because the 70’s was a time of Stagflation. With the Fed using Dollar Inflation to ward off the massive deflationary backdrop of the markets, we expect the current result to be a similar period of Stagflation- and we expect the chart of $Gold to continue to play out in a similar fractal manner as the chart of the 70’s. On the chart of “Long-term Fractal Gold”, below, I have only marked a couple of similar points in the 70’s Gold Bull to the current moves. The current question is whether we have topped out in the spike move at the arrow, or whether the recent 100 point drop in Gold is just a stepping stone in the current spike, upward. There is no way to tell for sure by looking at this type of chart, nor by looking at the long-term fractal comparison. After looking at the charts in detail, I believe that the recent drop in Gold is not the retest of the spike so Gold will be going higher over the coming months.
The next chart of Gold shows the angled lines that we noted on 04-04-08 where we thought Gold would bottom in this time period. There is the potential for Gold to drop to the lower dotted black line, but I do not expect to see it. I still expect for the chart of Gold to resolve very similarly to the move in late 2005 where Gold and Silver ran ahead, retraced, then moved on to higher highs. During that time period as shown in the yellow background on the chart, the HUI held support, and then rocketed off higher as it became apparent that Gold would not move lower. I suspect the reason that Gold made the recent large move ahead of the PM stocks as represented by the HUI Index is that investors have been confused by the outcomes of deflation versus inflation. Investors reading all of the deflationary news were worried about a complete collapse pulling down the PM stocks with it while the metals, Gold and Silver, were sought as the premier safe haven in case of that event. With the Fed clearly reconfirming their stance toward Dollar Inflation as stated, above, an upward move in Gold at this time will find the PM stocks woefully behind all of the fundamentals. The most basic fundamental for the PM stocks is the price of Gold and Silver- the determinant of PM Mining Company profits and reserve valuations. I believe the recent drop in Gold and Silver was primarily an event where traders used the round number “1,000” as a point of trading profit. Now, it will be back to the fundamentals at hand as seen in the Dollar and M3 charts, above. I still expect to see Gold run to our long-term $1,250 target with the possibility of spiking up toward $1,437. Though we have an expiration coming up for the PM metals this week, I expect Gold to soon move higher like it did back in late 2005.
The HUI- Ready to Run?
In the above chart of Gold, you can see that in late 2005 the HUI moved to new highs, then held support as Gold ran ahead- then retraced back to angled resistance. The HUI chart then resolved with the HUI making a strong run to the upside. That is exactly what I expect to see occur in the coming time-frame. We have talked about the fact that most of the PM sites were inundated with fears about deflation while Gold and Silver ran ahead of the PM stocks. So, what will investors do if Gold and Silver do not continue to decline at this time? It certainly appears that the PM stocks are well behind their fundamentals as expressed by the price of Gold and Silver. We expect the earnings of the Precious Metals Producers to continue to show terrific gains on the higher Gold and Silver prices. The reserves of the PM mining companies have not yet been revalued higher, either. So what will happen to the prices of the PM stocks if Gold and Silver run even higher from this point? Well, we would expect to see the PM stocks rise rather dramatically in this time-frame as we have expected all along. We still look for the HUI 640 and 800 levels to come into play over the coming months. Seeing how the PM stocks have not priced in the rise in Gold and Silver at this time, higher Gold and Silver prices might even see the HUI make a run at the channel top, up in the 1250 range.
In reviewing the charts of the HUI over the weekend, I looked at the current chart patterns from several perspectives. I looked at the HUI in comparison to the movements of Gold, the “fractal” relationships to the earlier HUI time-frame, the similarities of the HUI as seen in terms of Bollinger Bands in both fractals, and the HUI compared to moves in the Dow. As far as I can see, all of these relationships look constructive in terms of the HUI going much higher in the coming months. That reflects the fundamental perspective as I have detailed, above.
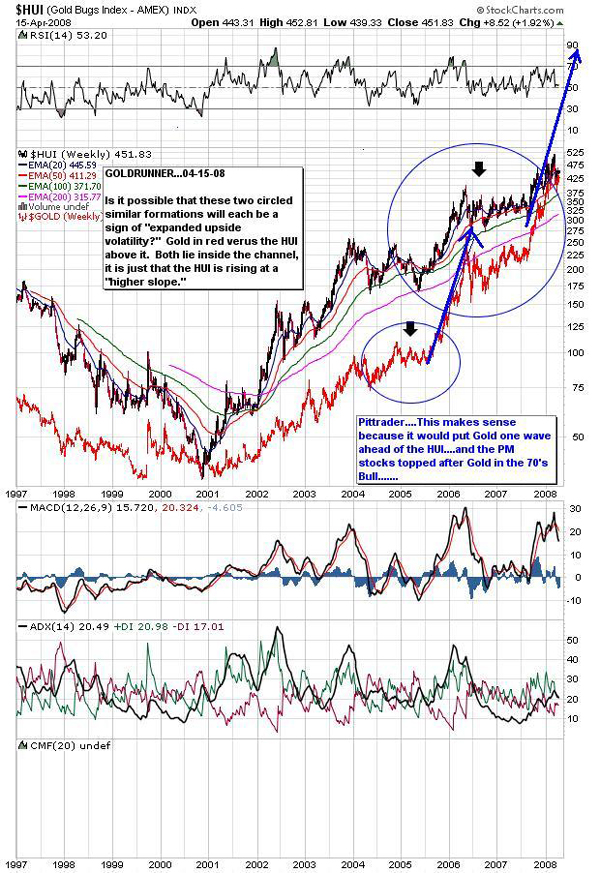
The first chart of the HUI, I find rather interesting. I had never really considered the ramifications of the recent corrective structure in itself, though our fractal work from 2005 had suggested that we might see increased HUI strength in the coming period. In the first HUI chart, below, we also show the chart of Gold in red. I have circled similar-looking structures in the chart of Gold and in the chart of the HUI. In both of the charts the structure moved to new highs, then moved sideways. The structure in Gold resolved strongly to the upside- marking a sharp increase in upward volatility for Gold. Moves like these create recognition points in the long-term parabola. The similar recent structure in the chart of the HUI is uncannily similar, and it comes directly in the time-frame we have been expecting superior HUI strength. Is it possible that the HUI is ready to hit the recognition point of much higher upside volatility like the chart of Gold did in the circle? I think so. This is particularly likely given the outstanding fundamentals for the PM stocks as outlined, above. In considering the above, such a move would force me to make a minor change in the Elliot Wave Count of the HUI going forward that would segregate the HUI EW count from that of Gold, but would put the two counts into a similar relationship with the 70’s Gold Bull.
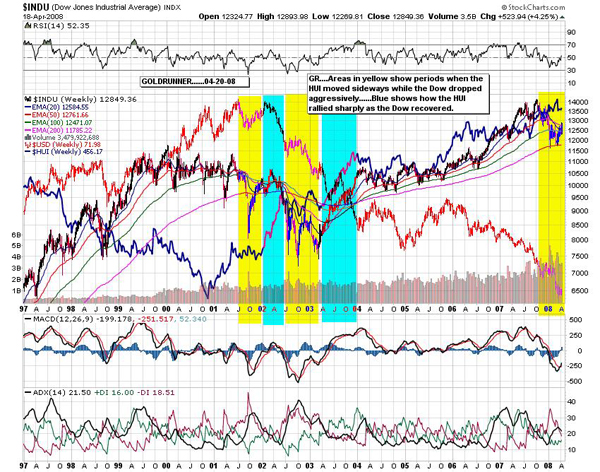
The last chart is of the Dow, the HUI, and the US Dollar. I have highlighted in yellow some periods where the Dow showed aggressive drops while the HUI corrected sideways. Those areas are followed by areas highlighted in blue where the HUI rallied aggressively while the Dow recovered/ rallied. We can see that the MACD for the Dow has turned up from very overbought levels. Though we do expect the Dow to see more weakness into the 4th quarter, we expect we may see Dow strength in the coming months. This would fit in well with the HUI having an aggressive upside run. I used a “solid line” for the HUI in this chart to make it a bit easier to see. We also see that the US Dollar has been basically weak, pretty well dropping the whole time period. That US Dollar weakness matches the M3 chart we showed above very well. We have previously shown that the falling value of the USD has a fairly dramatic affect on the Dow since the Dow is still higher than the 2000 top, but down about 70% against constant Gold. During that time period the HUI is up to around 500 from the bottom at 35. We expect to see these relationships continue into the future.
We will return toward the middle of the week to look at more specific relationships in the HUI charts that suggest that the HUI is on the verge of running much higher. We will also be looking at the Silver chart expecting to see that the lag by the Silver Stocks was due to the premature run higher in Gold and Silver, rather than due to some problem with the fundamentals of the Silver Stocks.
One last comment before we end, though. One might ask the question, “So, what happens if the sharp move shown in the LT Fractal Chart of Gold has completed its upside run?” Well, there is no way to know for sure at this time that it has not, but if that run is complete it would simply mean that our time-table for the coming larger parabolic move in the PM complex is coming sooner than expected.
Below, is a link to the Goldrunner Index which includes links to the recent series of editorials we have posted.
https://www.gold-eagle.com/research/goldrunnerndx.html
As we have noted we will be moving out work to a subscription site, though there has been a delay with the site, itself. I apologize for the delay, but do not have control over creating the site. I would again like to thank readers for the many kind comments that I have received. We are compiling an e-mail list to contact those who wish to be notified when our new site is up. [email protected]
For the moment…………..Goldrunner.
Below, is the link to the Gold-Eagle Forum where many of us discuss the various topics of the Precious Metals sector………..
https://www.gold-eagle.com/cgi-bin/gn/get/forum.html.
Again, I’d like to thank all of the posters at the Gold-Eagle Forum for their daily input. This thank you is especially extended to TQ and to Grininbarrett who have positively affected my growth over the years, along with posters Pittrader, Trader_Vic, and Mr. Aholbroke. Special thanks go to Dr. Vronsky and Westerman for creating the Gold-Eagle site and for editing my work. A very special “Congratulations” go out to Dr. Vronsky and Westerman after Gold-Eagle saw its hit counter ring up to 286 million this last week.
Here is the link to a site I use to research the warrants of Precious Metals stocks. I will be discussing some aspects of the leveraged use of warrants later in this editorial series.
http://preciousmetalswarrants.com/
Another very good site that is dedicated to investments in Silver belongs to David Morgan, and his site can be found here……………. http://www.silver-investor.com/


