PMs Complex Under Siege?
 share
share
 share
share
 share
share
 share
share
 share
share
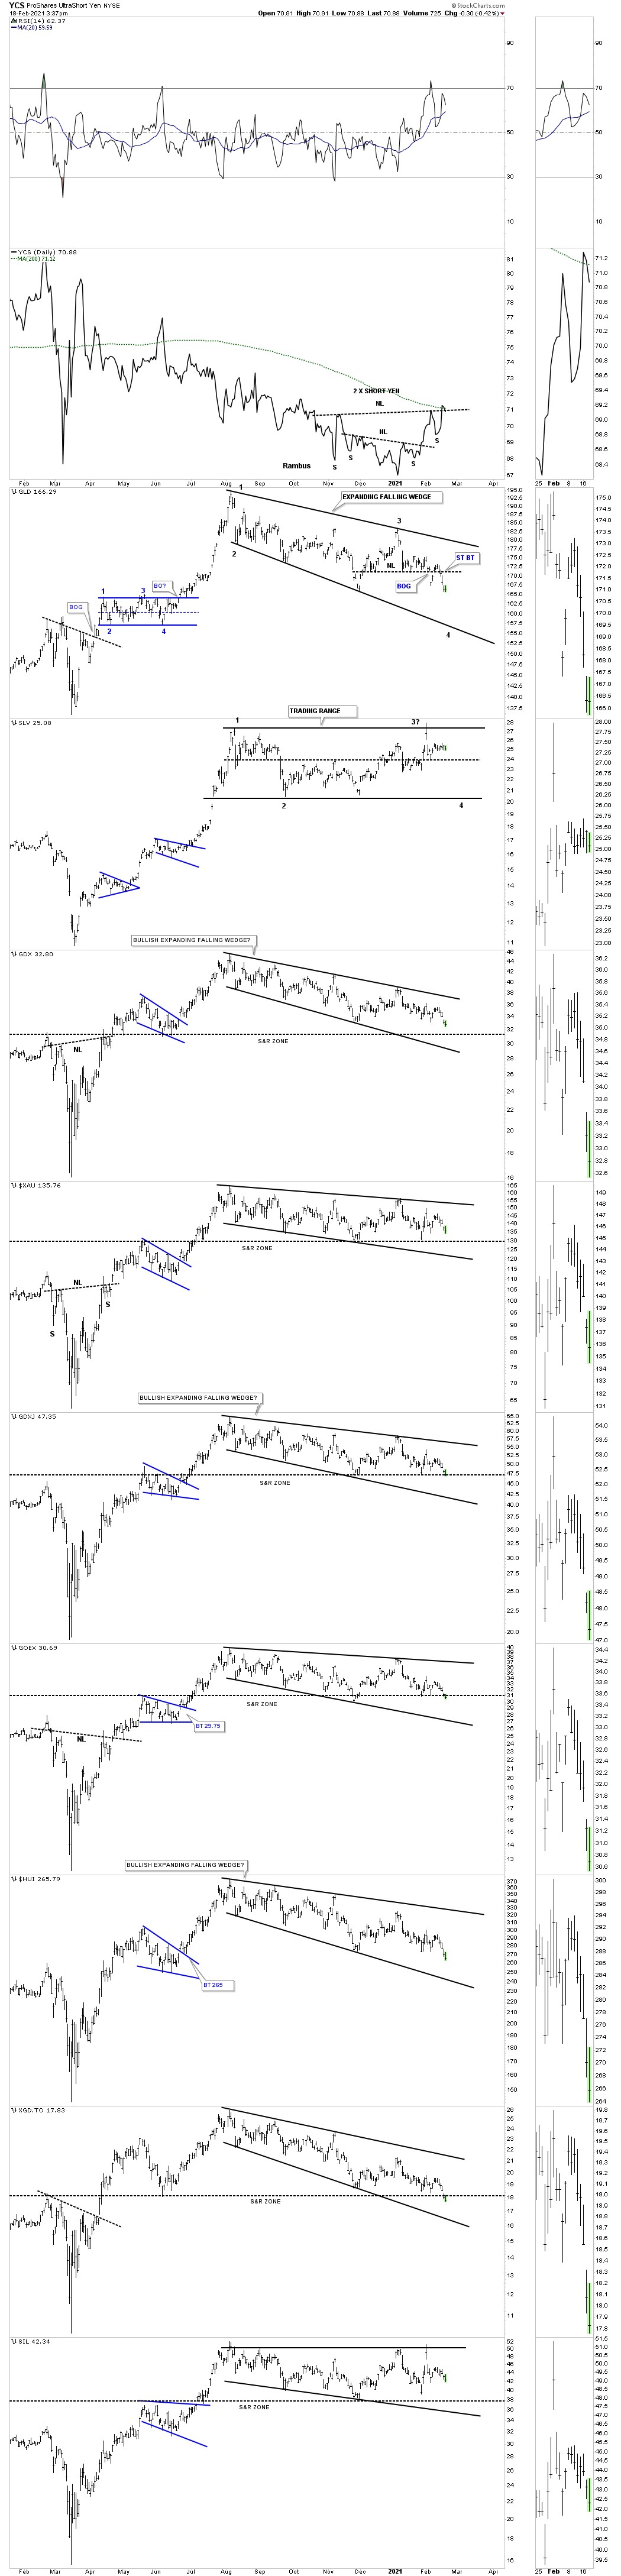
Lets start with the daily bar combo chart for the PM complex which shows the August trading range still under construction making lower lows and lower highs for the most part.
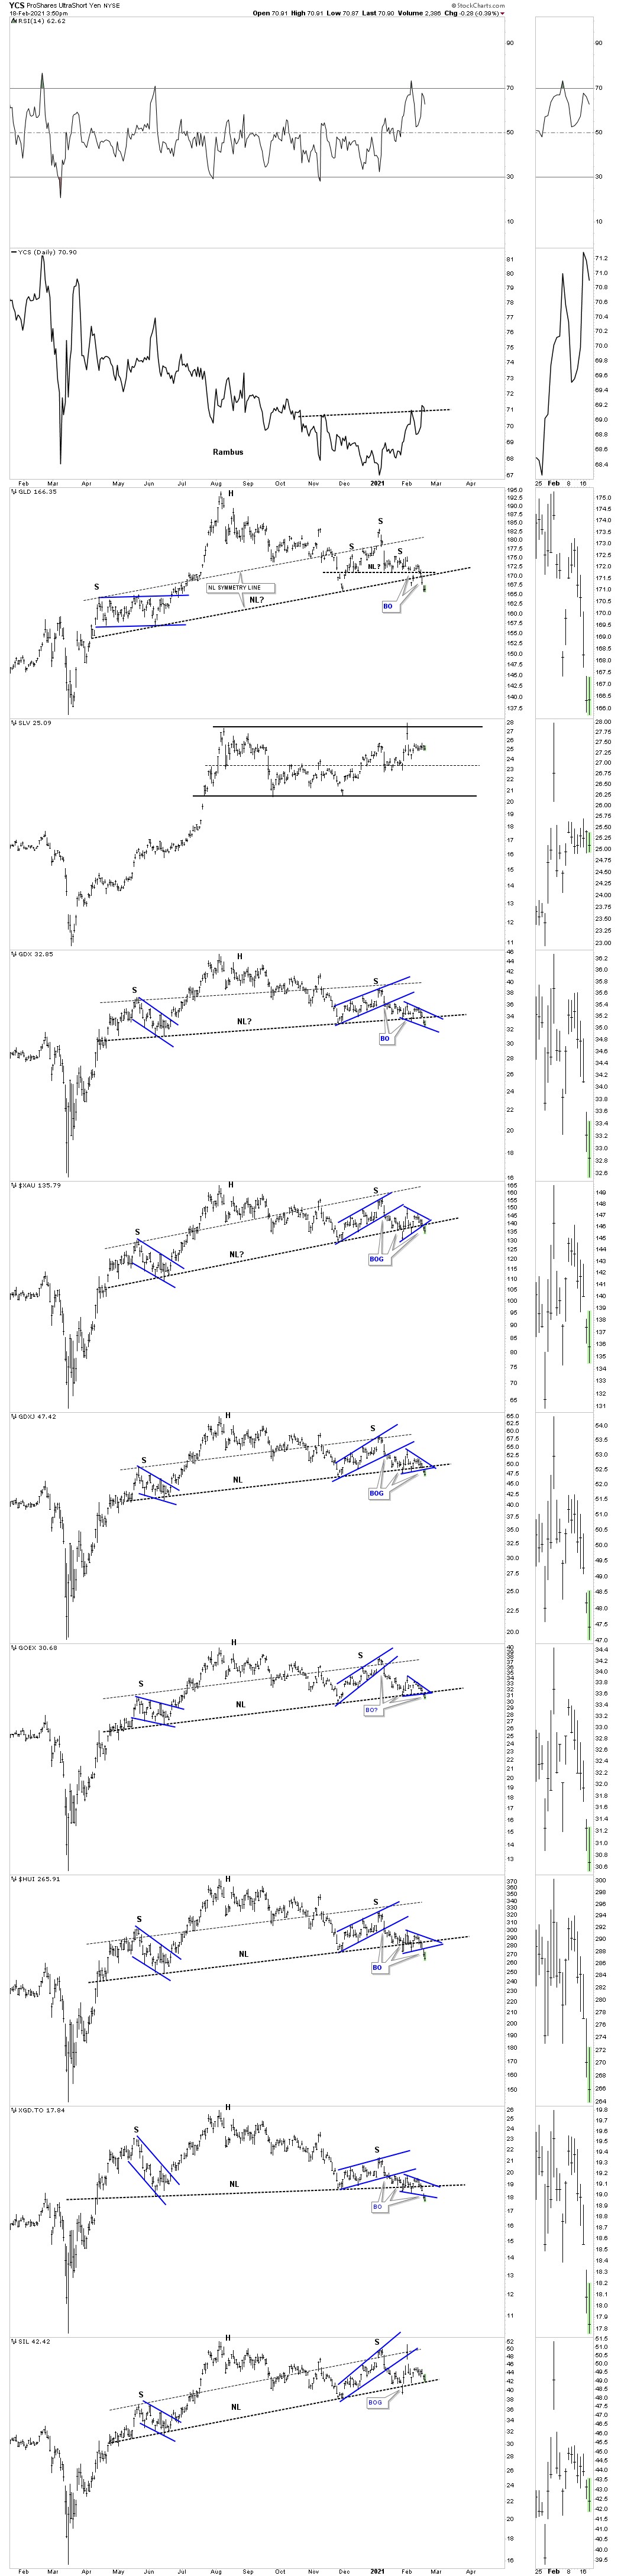
Below is the daily bar PM combo chart showing the possible H&S tops. Over the last couple of weeks most of the PM stock indexes have formed a small blue consolidation pattern right around the neckline with most of them breaking out to the downside today. The thumbnail on the right side of the chart shows a breakout gap yesterday in most cases.
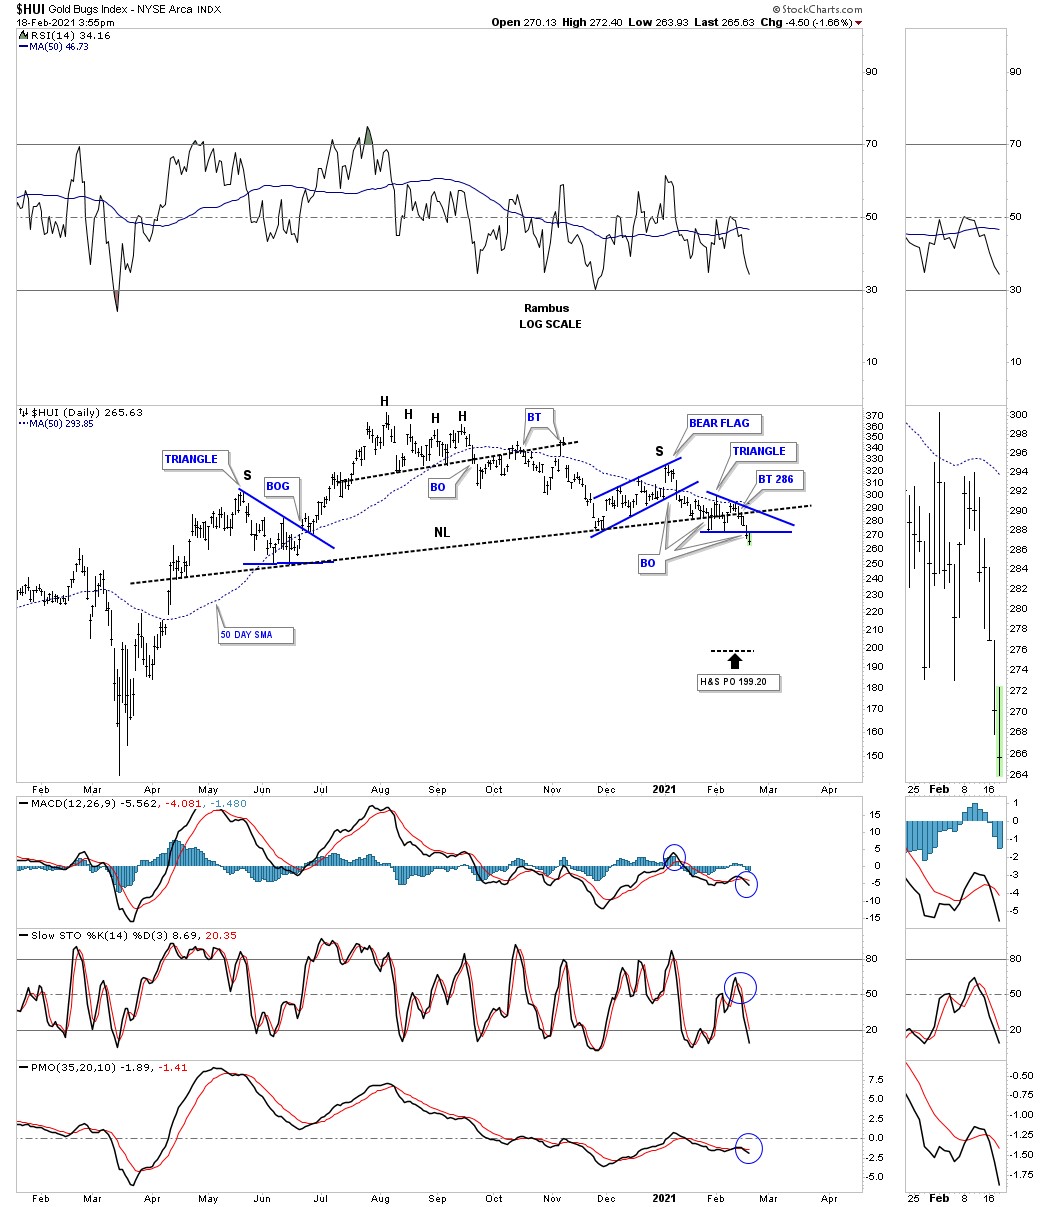
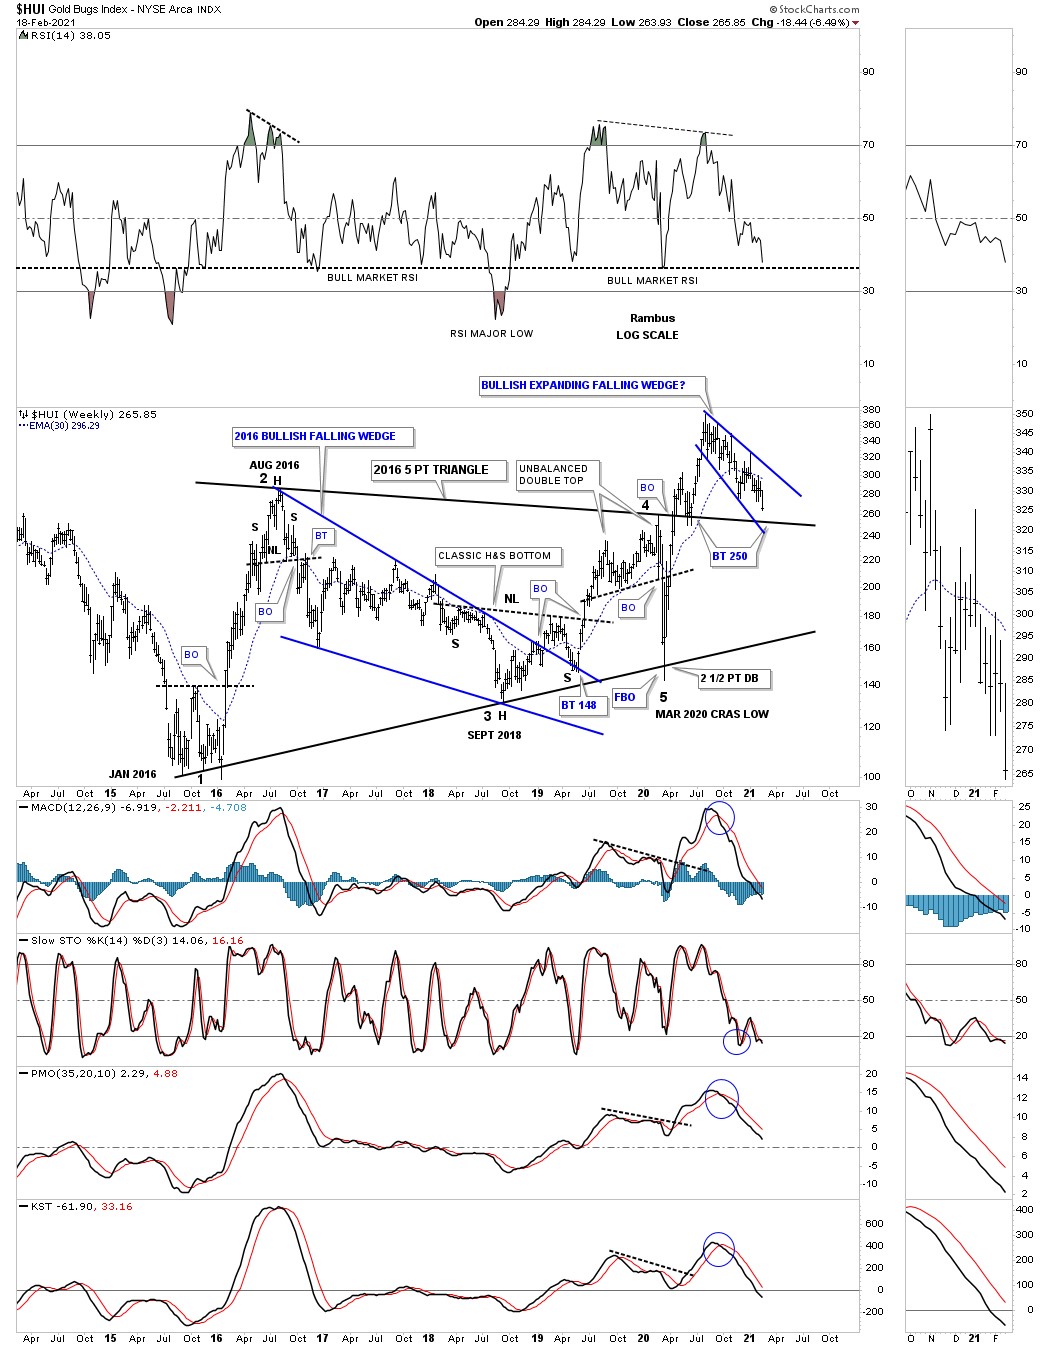
Below are some charts for the HUI that are pretty self explanatory.
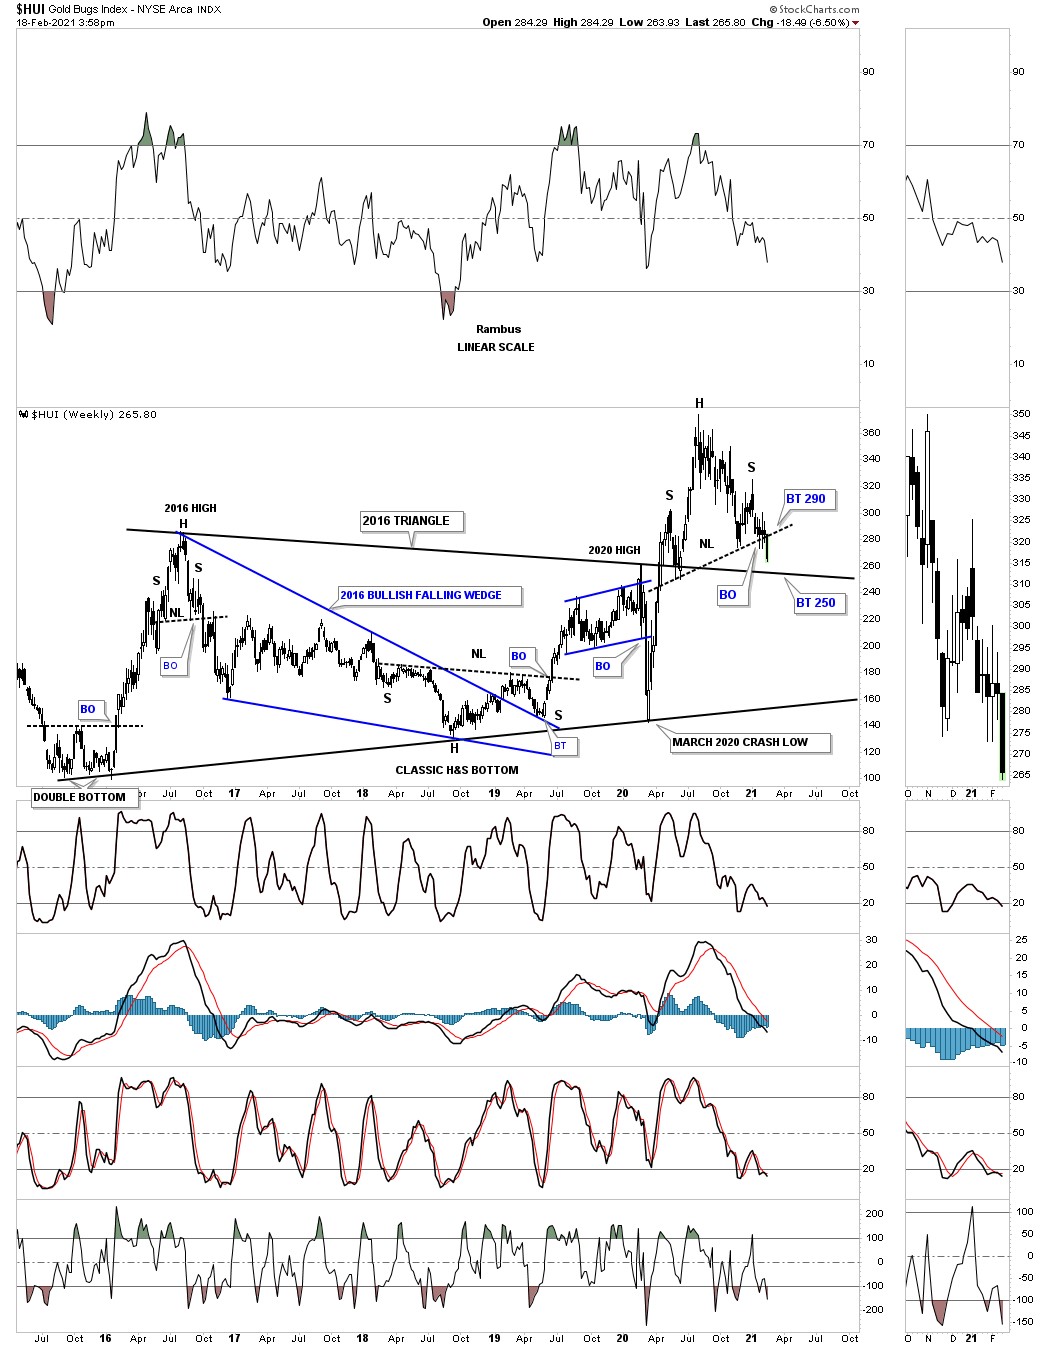
This long term weekly chart shows the HUI in backtest mode to the top rail of its 2016 triangle reversal pattern around the 250 area. What complicates things is the H&S top that has formed above the 2016 triangle. Technically the top rail should be strong support but with the H&S top just above it there could be some strong downward pressure. How many remember the 2016 H&S top that came out of nowhere to reverse that impulse move?
The best outcome for the HUI would be if the August expanding falling wedge finds support on top of the 2016 triangle.
The top rail of the 2016 triangle reversal pattern comes into full view on this long term monthly chart for the HUI which technically should hold support. What you don’t want to see is important trendlines fail as that is a sign of weakness. So far nothing is broken.
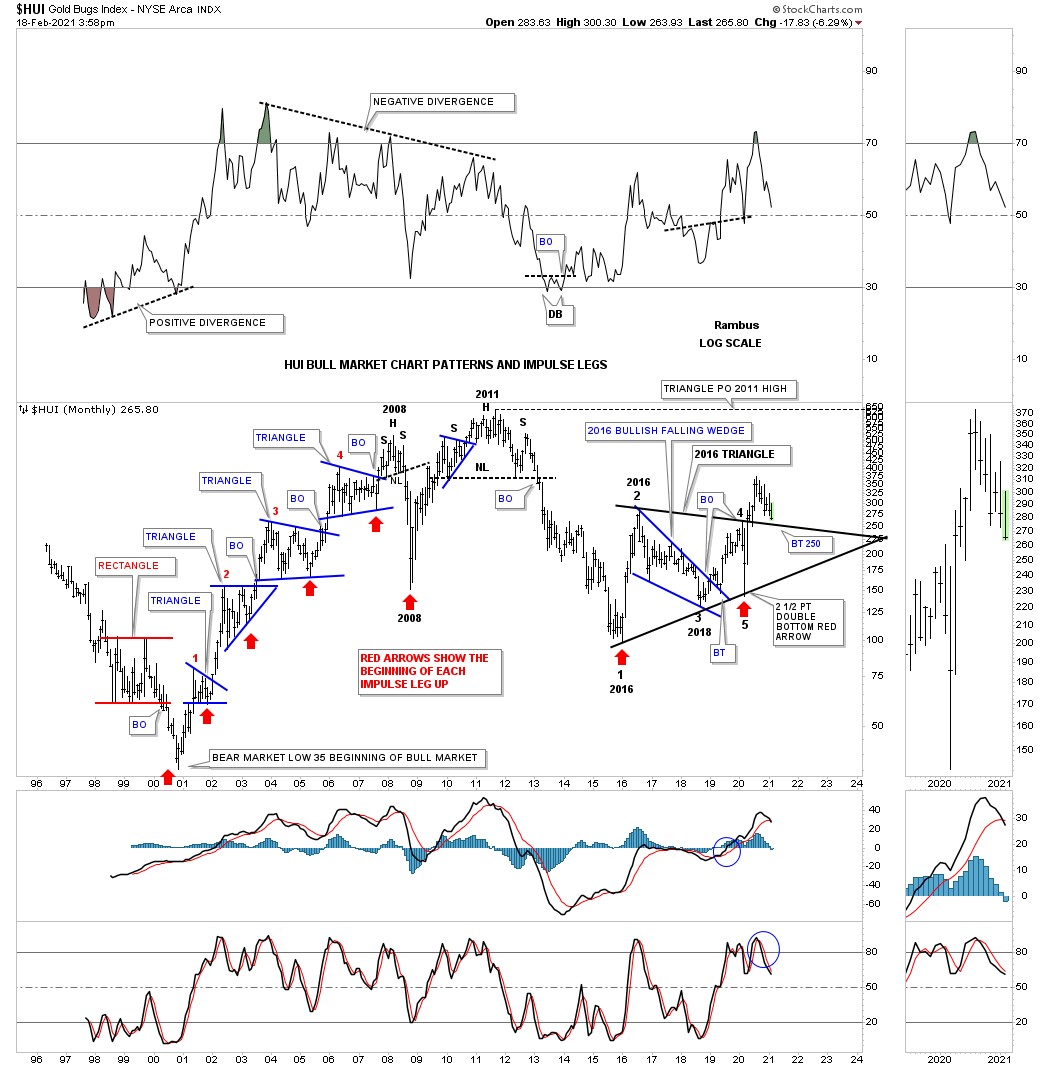
This last long term chart for the HUI is its history chart which shows its secular bull market and all the consolidation and reversal patterns it has formed since 1996. To say the 250 area is an important area of support is an understatement. For those that are so inclined to do some bottom fishing this would be a pretty low risk environment using the top rail of the 2016 triangle as your line in the sand, above is bullish and below is bearish. As I already have my profits locked in I’m content to watch the price action for awhile and see what develops. When in doubt be more cautious.
**********
share
share
share
share
share
 Meet Rambus, a seasoned trader and technical analyst renowned for his unbiased and insightful chart work. Through his website, Rambus Chartology, and Substack newsletter, Rambus shares his expertise with a global community of subscribers, providing daily updates, commentaries, and hands-on training in the art and science of chartology. With his calm, humble, and down-to-earth approach, Rambus demystifies complex market trends, helping his followers navigate the challenges of today's volatile markets. Join the Rambus Chartology community today and discover a unique blend of technical analysis, trading expertise, and time-tested protocols. Subscribe now at www.rambus1.com or https://rambuschartology.substack.com/
More from Gold-Eagle


