Positioning Ahead Of Additional Dollar Weakness


Through the first three weeks of 2018, one of the key stories has been the falling US dollar. Expect this trend to continue and even accelerate as we go through the year.
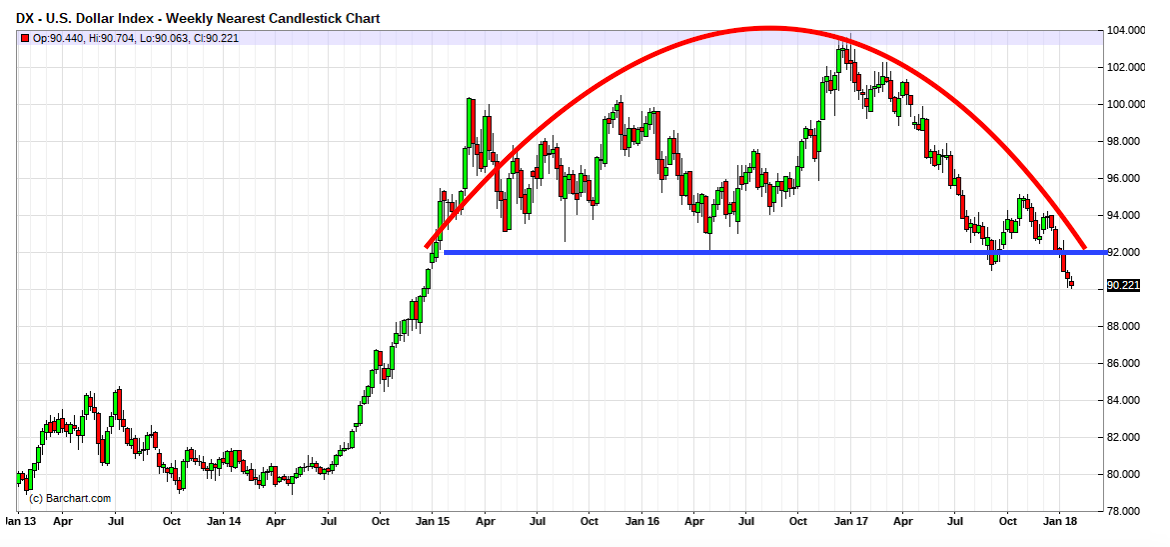
After peaking with a false breakout near 104 in early 2017, the US dollar (as measured by the Dollar Index) has continued to plummet in 2018. As I type, the index is near 90 and already down over 2% year-to-date. Dollar weakness has traditionally been positive for commodity prices, and the evidence of this can be seen below.
First, check the clear and obvious top in the Dollar Index. Note the breakdown through 92, and the most recent drop through the 2017 lows near 91.
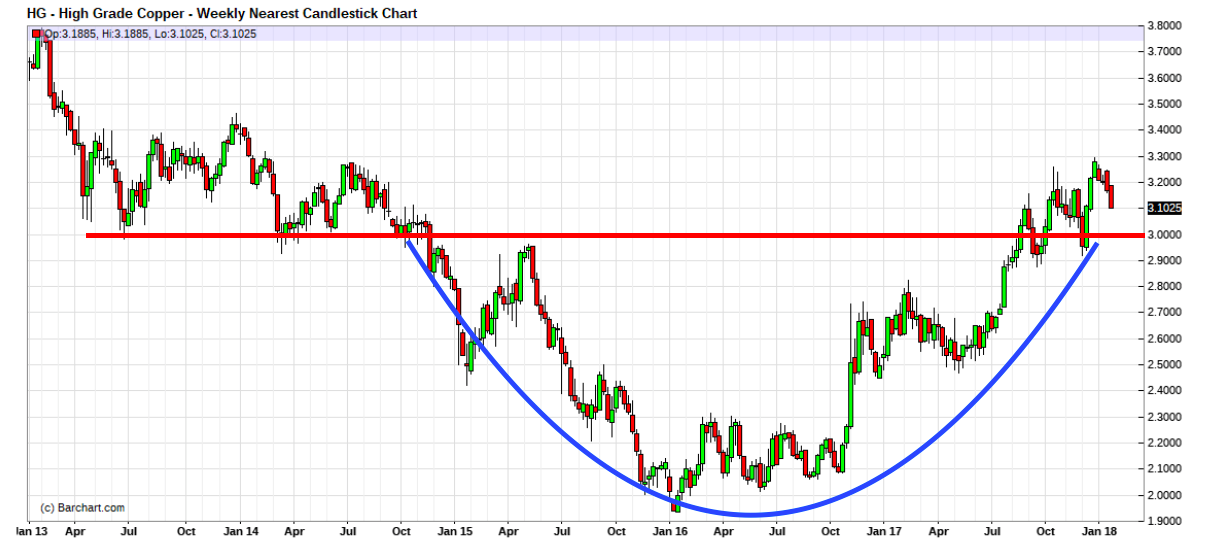
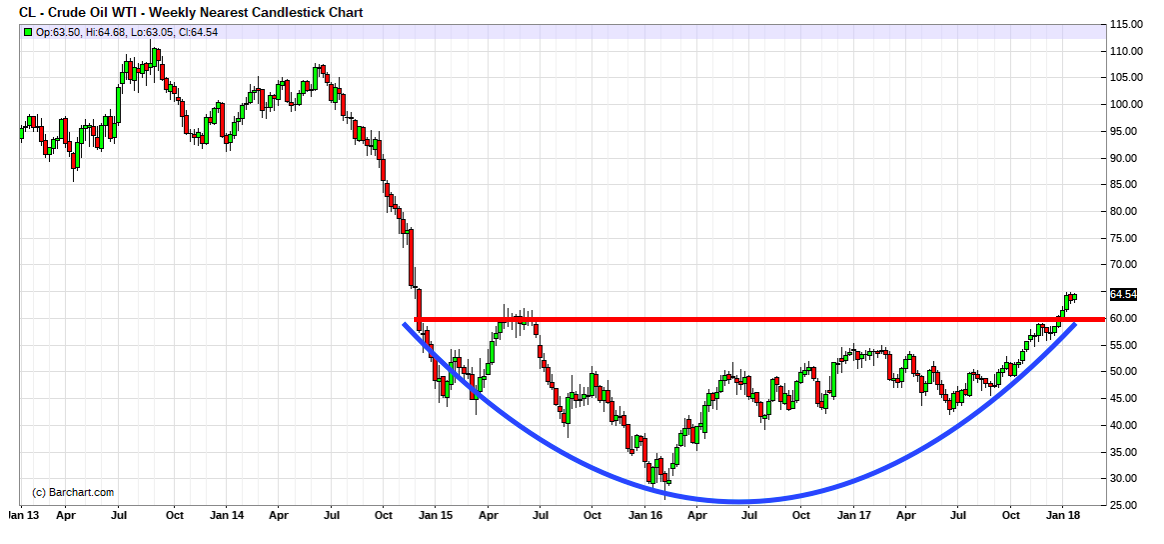
In a reaction to this, note the clear bottoms and breakouts in the two most important global commodities, copper and crude oil:
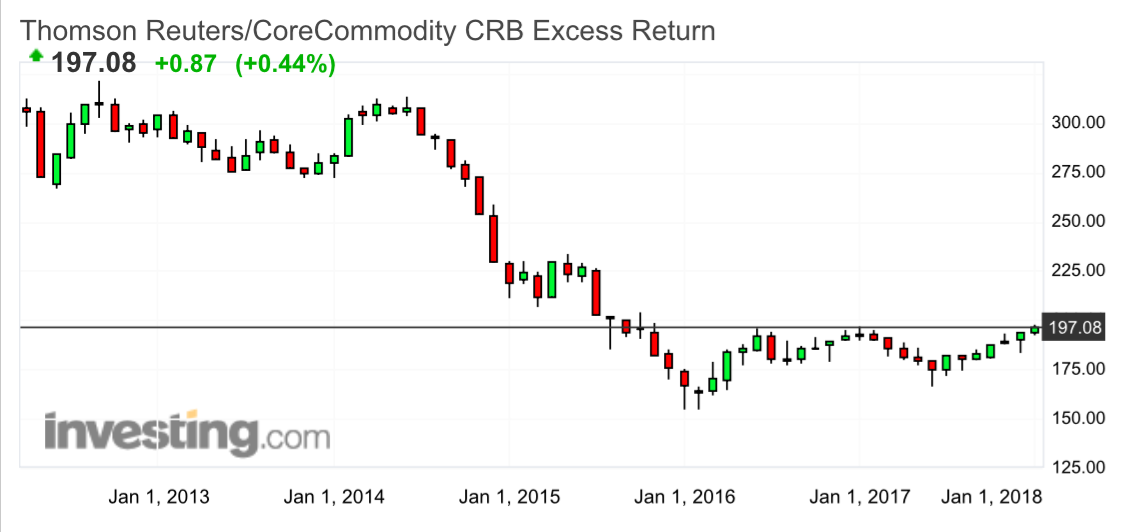
You can also see this early-stage commodity rally in the broad-based CRB Index. Note the recent threat to move above the 200 level for the first time since mid-2015:
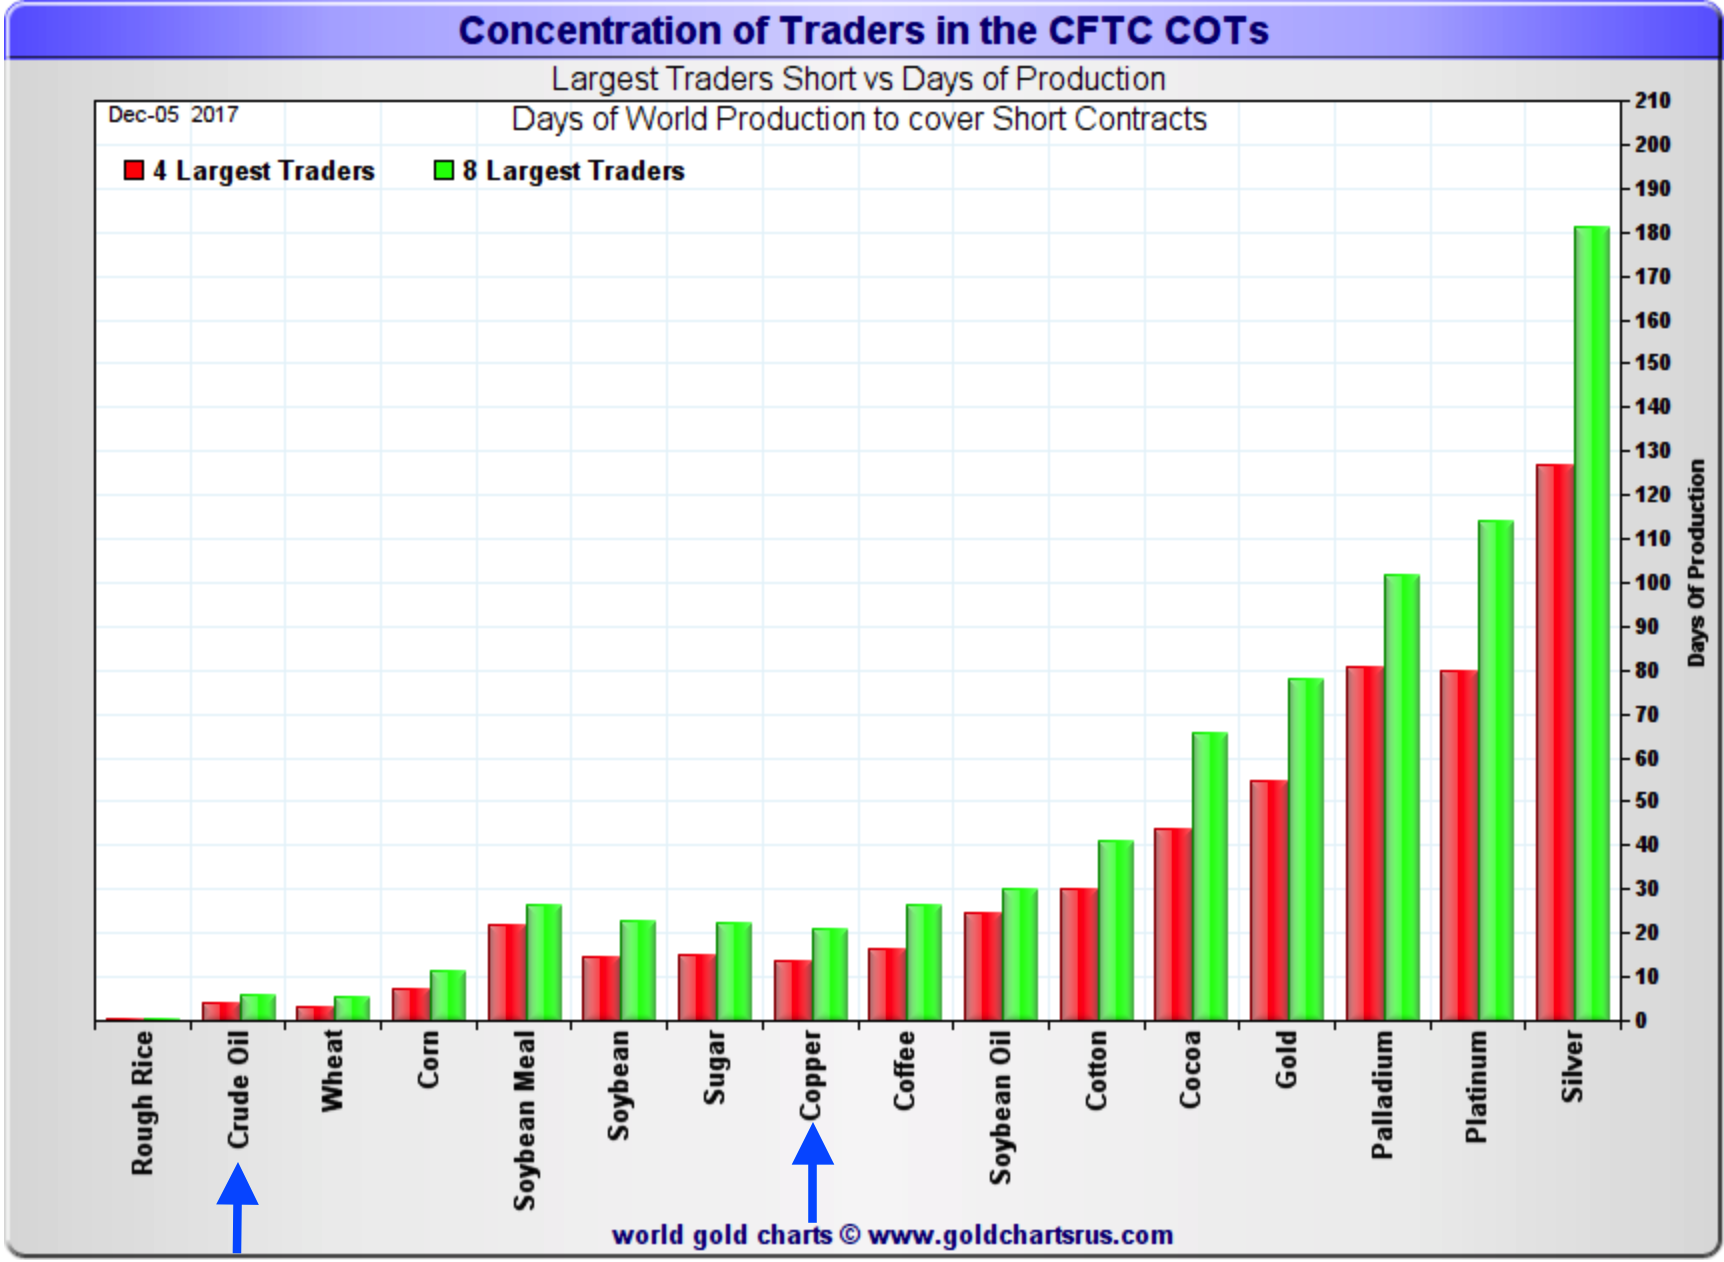
So far, nearly the only "commodity" unaffected by the falling dollar is silver. This is no surprise, as the silver "market" is easily the most manipulated in the world. As you can see below, in this chart from Nick Laird at GoldChartsRUs, the monopolistic concentration of positions held by a small handful of Bullion Banks stands in stark contrast to other markets such as crude and copper:
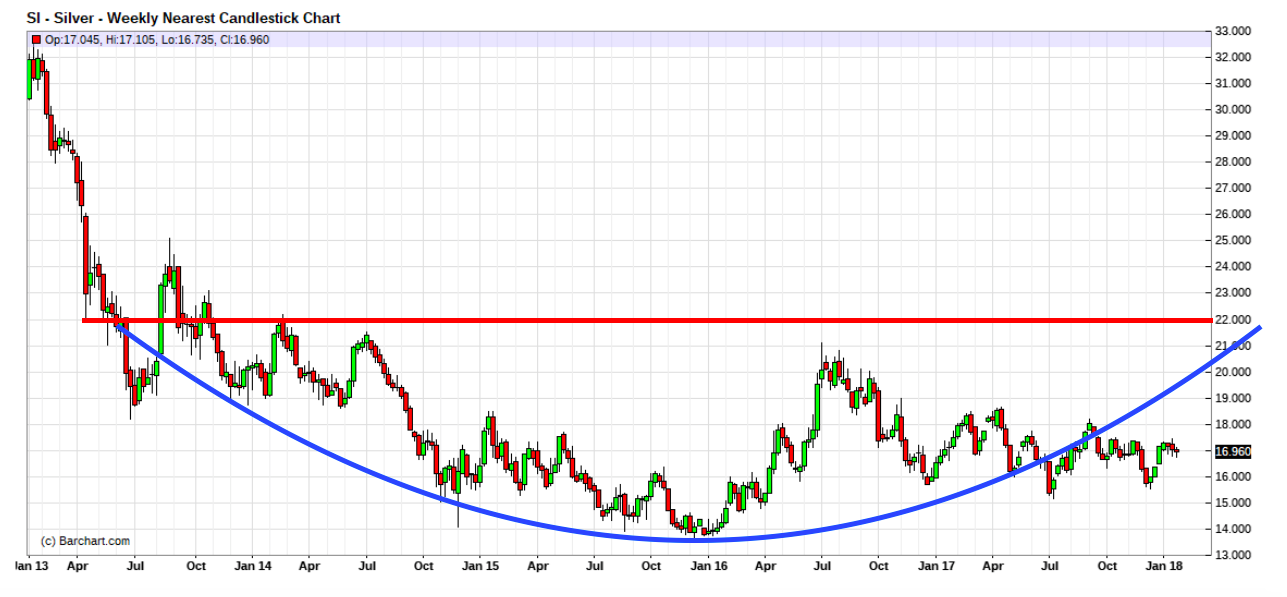
But this collusive manipulation does not mean silver can never rally in price. Recall the price action of 2010-2011 and consider the possibilities for 2018, as the dollar continues to fall and global interest in the sector gradually returns. Could silver be on the verge of breaking out and playing "catch up" with crude, copper and the rest?
The most recent CoT structure suggests there's certainly some room to run before The Banks would attempt to halt the advance. Note that the current structure is nowhere near the bearish extremes seen at the price tops of 2016 and 2017:
Date: 1/16/18 Price: $17.19 LS NET LONG: 37,200 COMM NET SHORT: 50,100
At the price peak of April 2017:
Date: 4/11/17 Price $18.50 LS NET LONG: 105,500 COMM NET SHORT: 114,400
And at the price peak of August 2016:
Date: 8/2/16 Price $20.50 LS NET LONG: 93,400 COMM NET SHORT: 109,100
So perhaps we are on the verge of a decent rally in silver that could take the price 30% higher and up, toward the breakout level of $22. The dollar weakness suggests it. Other commodities suggest it. The CoT structure suggests it. But will The Banks allow it?
Only time will tell, I suppose. But the ongoing trend of US dollar weakness certainly supports the notion of higher silver prices in 2018.
 Craig Hemke began his career in financial services in 1990 but retired in 2008 to focus on family and entrepreneurial opportunities. Since 2010, he has been the editor and publisher of the TF Metals Report found at TFMetalsReport.com, an online community for precious metal investors.


