Potential Bottoming Patterns In The Precious Metals Complex


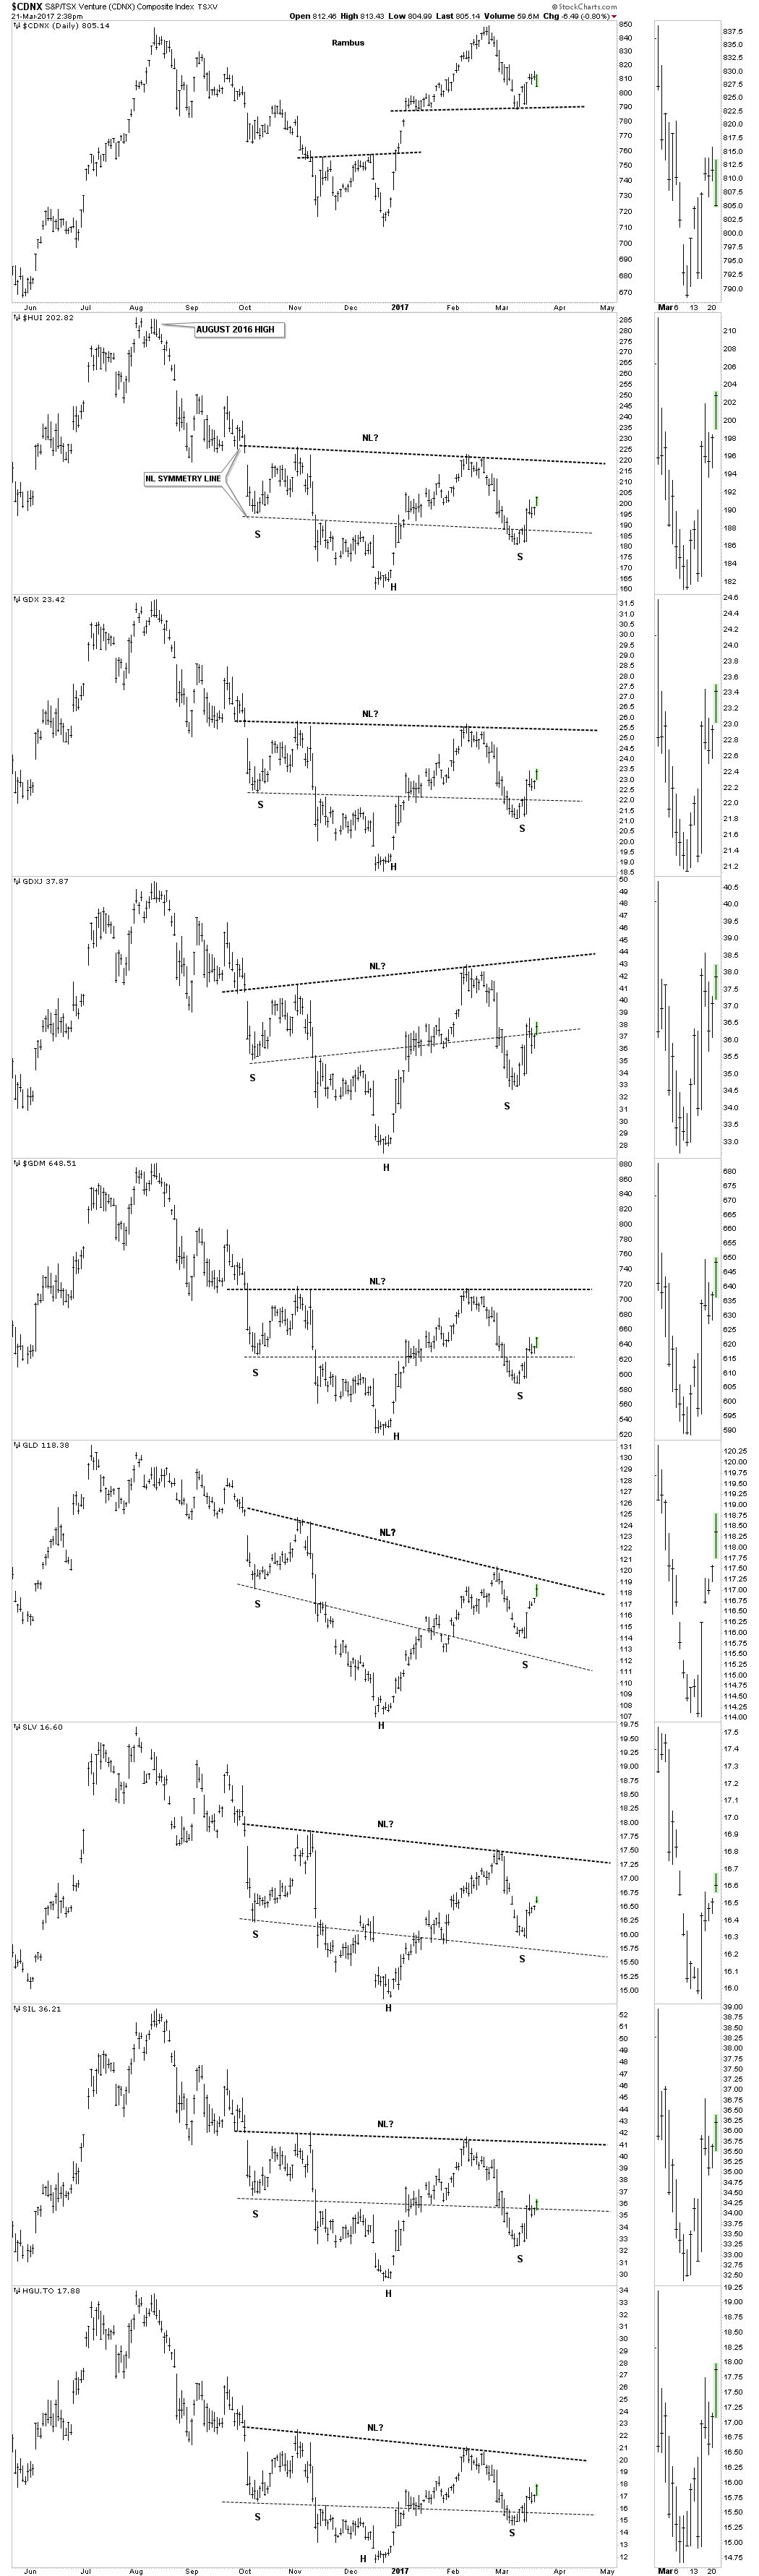
There is a combo chart for the PM complex I’ve been following, on the short term 10 month daily look, which shows a potential H&S bottom forming. I put a neckline symmetry line on the charts to get a feel for where the low for the right shoulder may form. Some are fairly parallel to the neckline like GLD, SLV and the HUI with GDXJ and SIL being the most unparalleled. The CDNX is showing the most weakness as it probably has to do with some of the small cap energy companies.
GLD is trading the closest to the neckline so it may give an early heads up for the PM stock indexes. Keep in mind these potential H&S bottoms won’t be complete until the necklines are broken to the upside.
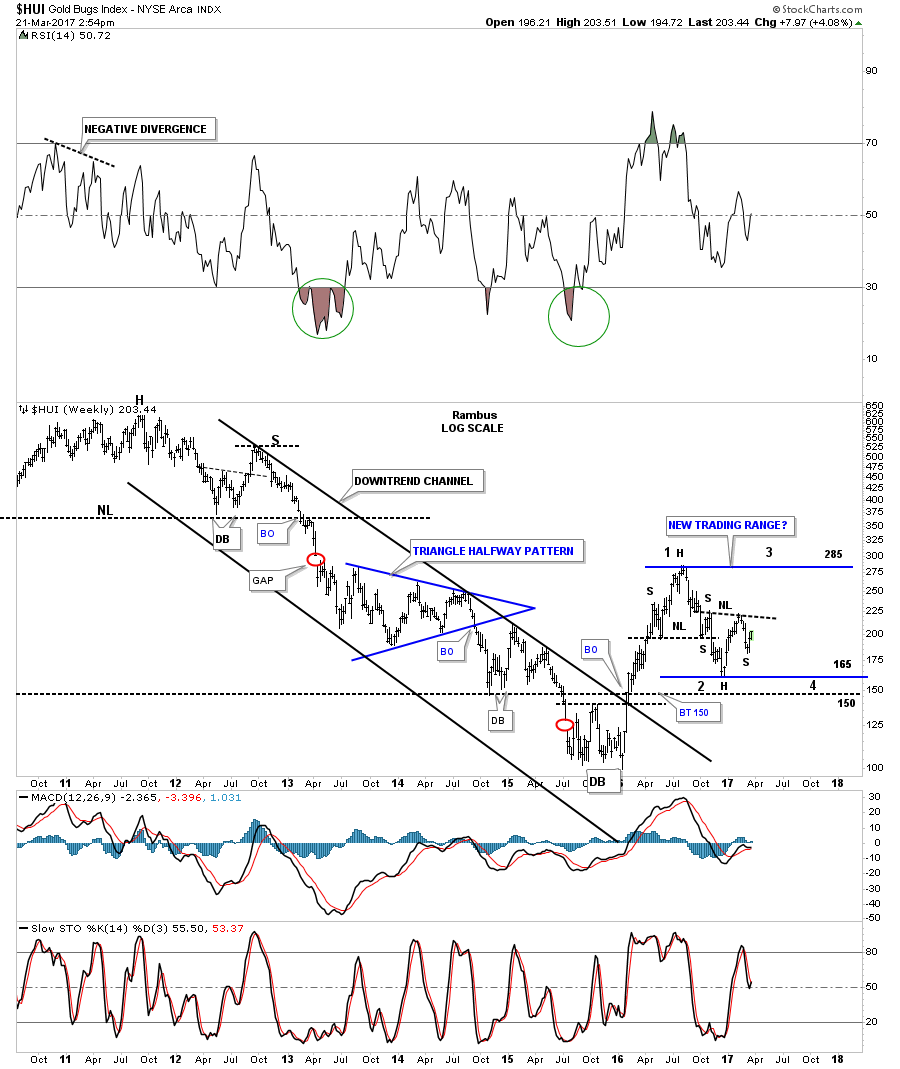
This next chart is a long-term weekly look at the HUI which shows the potential big trading range with the first reversal point starting at the August 2016 high. Reversal point #2, which may be underway should take the HUI up toward the 286 August high which would be the area to look for the 3rd reversal point to the downside.
Note how the top of the trading range formed a H&S top for the first reversal point and now it looks like a H&S bottom for the 2nd reversal point. Interesting to say the least.
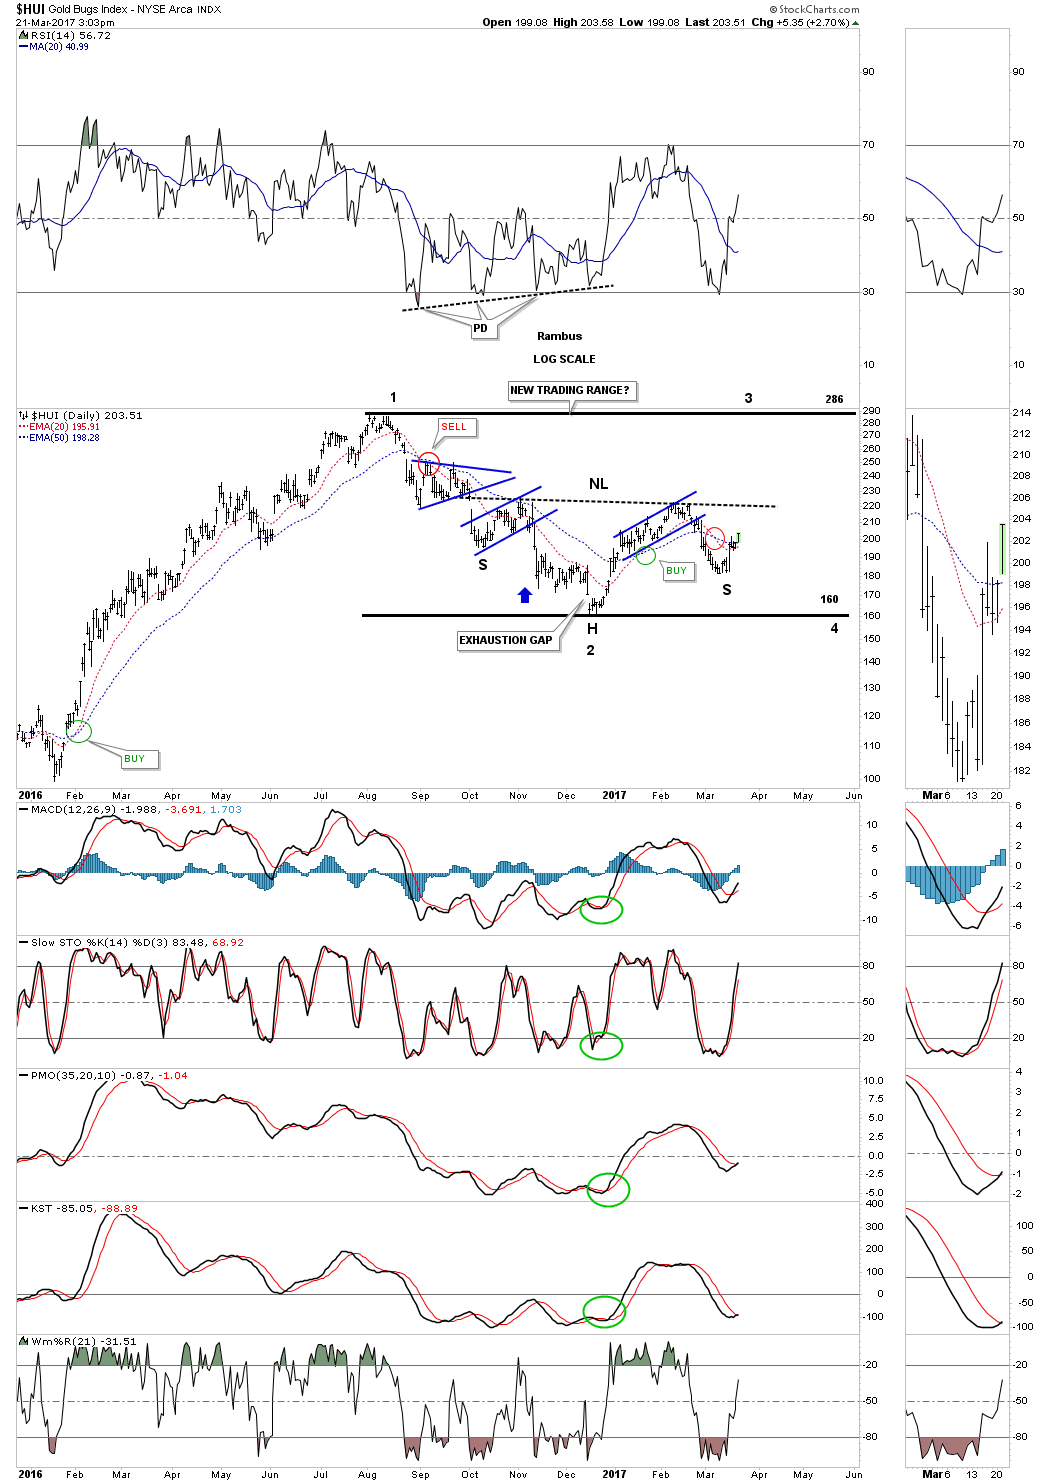
Below is a daily chart for the HUI which shows the potential H&S bottom forming inside the large trading range.
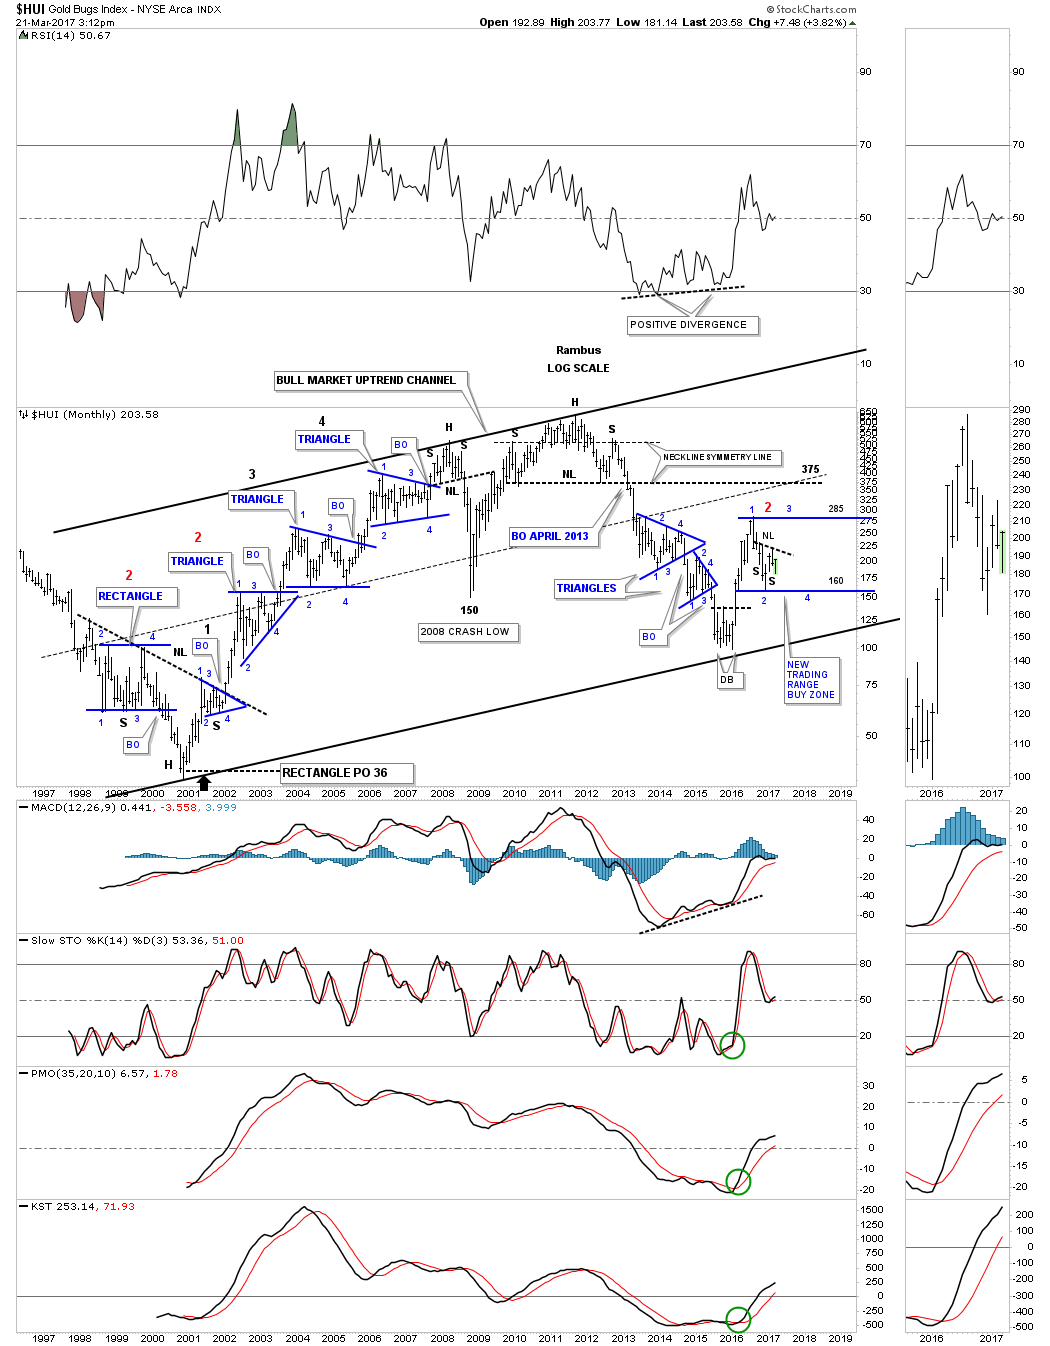
The 20 year monthly chart for the HUI shows you a good look at all the consolidation patterns that formed during the bull market years. During the bull market the HUI formed one consolidation pattern on top of the next. I have all the reversal points labeled on each consolidation pattern. Most of the consolidation patterns lasted anywhere from 14 to18 months or so. On that basis we are likely less than half way through this present pattern. The red numbers on the left side of the chart shows the same height for each consolidation pattern. As you can see our current pattern is also the same height.
This is a good area to see a H&S bottom build out just like the H&S top that built out at the first reversal point which is defining the trading range.
Markets are live entities, Eachday new patterns can slowly emerge Chart patterns are the sum total of actions of all the traders who participate. With an open mind , we must evaluate and re evaluate and constantly be on the lookout for clues . Stay tuned , as the Precious Metals Markets are getting interesting once again.
 Meet Rambus, a seasoned trader and technical analyst renowned for his unbiased and insightful chart work. Through his website, Rambus Chartology, and Substack newsletter, Rambus shares his expertise with a global community of subscribers, providing daily updates, commentaries, and hands-on training in the art and science of chartology. With his calm, humble, and down-to-earth approach, Rambus demystifies complex market trends, helping his followers navigate the challenges of today's volatile markets. Join the Rambus Chartology community today and discover a unique blend of technical analysis, trading expertise, and time-tested protocols. Subscribe now at www.rambus1.com or https://rambuschartology.substack.com/
More from Gold-Eagle


