Precious Metals and Critical Minerals Feeling Market Love


A “commodity supercycle” is a period of consistent price increases lasting more than five years, and in some cases, decades. The Bank of Canada defines it as an “extended period during which commodity prices are well above or below their long-run trend.”
Supercycles occur because of the long lag between commodity price signals and changes in supply. While each commodity is different, the following is a rundown of a typical boom-bust cycle:
As economies grow, so does the demand for commodities, and eventually the demand outstrips supply. That leads to rising commodity prices, but the commodity producers don’t initially respond to the higher prices because they’re unsure whether they will last. As a result, the gap between demand and supply continues to widen, keeping upward pressure on prices.
Eventually, prices get so attractive that producers respond by making additional investments to boost supply, narrowing the supply and demand gap. High prices continue to encourage investment until finally, supply overtakes demand, pushing prices down. But even as prices fall, supply continues to rise as investments made during the boom years bear fruit. Shortages turn to gluts and commodities enter the bearish part of the cycle.
There have been multiple commodity supercycles throughout the course of history. The most recent one started in 1996 and peaked in 2011, driven by raw material demand from rapid industrialization taking place in markets like Brazil, India, Russia and especially, China.
Dawn of a new supercycle
While no two supercycles look the same, they all have three indicators in common: a surge in demand and price than supply.
The Globe and Mail states that there are structural factors on both the supply and demand side that could catalyze the next boom in commodities.
(In some metals the boom has already started. Gold is up 44% year to date and reached a record-high $3,728/oz on Monday, silver is doing even better at a YTD increase of 52%, copper is up 16%, palladium is up 32%, and platinum has gained an impressive 61%, copper is currently trading at US$4.57lb and continues it’s climb from US$2lb in 2016, having recently spiked to US$5.80lb. — Rick)
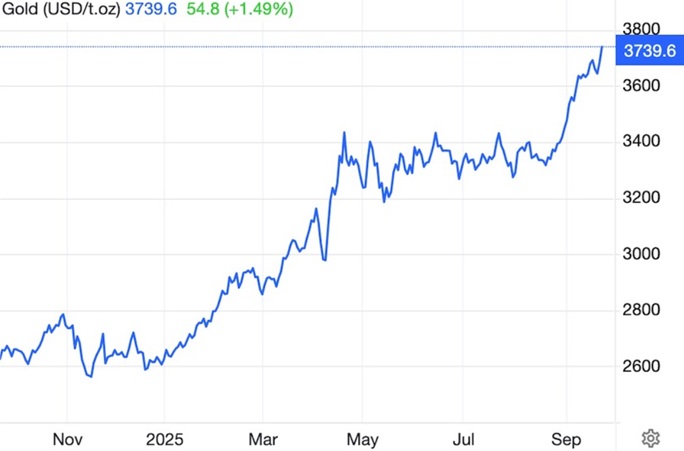
One-year gold price. Source: Trading Economics
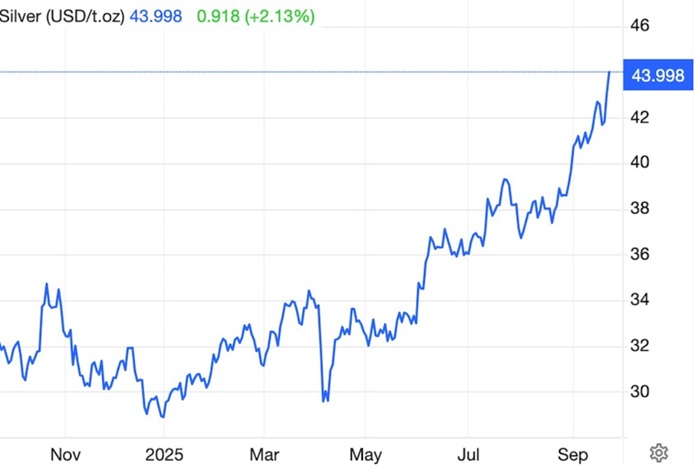
One-year silver price. Source: Trading Economics
The first factor is that critical minerals are concentrated in the hands of just a few countries. For example, over 40% of copper production comes from Chile and Peru. Australia and Brazil mine over half of the world’s iron ore.
This is also true on the processing side. China refines 40% of the world’s copper, which is essential for artificial intelligence applications and clean energy including electric vehicles and renewables.
The IEA estimates China’s share of refining is around 50-70% for lithium and cobalt, 35% for nickel, and 95% for manganese, despite being directly involved in a small fraction of the mine production.
The nation is also responsible for nearly 90% of rare earth elements, which are essential raw materials for permanent magnets used in wind turbines and EV motors, as well as 100% of graphite, the anode material in EV batteries.
China in 2010 restricted exports of rare earth oxides following a dispute with Japan, causing prices to temporarily spike. It did it again earlier this year in response to US tariffs; the restrictions are still in place.
China has also restricted exports of graphite — both synthetic and natural flake — and in December 2024 imposed a complete ban on gallium and germanium exports to the United States.
Gallium is used in nuclear medicine to detect infections, inflammation and certain cancers. Gadolinium is used in MRI scans, making phosphors for screens, and in specialized magnets and superconductors.
Compounding the supply concentration problem is the geological fact that most of the easy-to-find mineral deposits have been identified and/or mined. The Globe notes that greenfield mining projects can expect to face declining ore grades, soaring capital costs and lead times that exceed a decade.
To this we can add the following concerning the gold industry:
The problems facing our gold producers are going to become apparent in the next few years.
Gold mines have been mining at a higher grade than the reserve grade for much of the last decade. Mining areas of the orebody with the highest-grade material is known as high grading.
Mining high-grade accessible areas of their deposits is one way for operations to bolster margins when facing low metal prices.
Gold head grades declined 7.5% to 13.4% between 2012 and 2022.
Global tonnage of ore and waste in 2023 was the highest on record with further increases expected for 2024.
The average strip ratio for primary gold mines in 2022 was 4.24:1. Slightly down from the highest ever recorded in 2021 at 4.29:1.
S&P Global Commodity Insights shows that gold discovery rates continue to decline.
A total of 353 new gold deposits hosting 3 billion ounces of reserves, resources and past production was discovered between 1990 and 2024. The peak was in 1995 when 28 major discoveries were made.
Most of the new ounces were from deposits discovered decades ago.
Since 2020, only six major discoveries have been made.
The average discovery size from 2010-19 was 7.7Moz, but since 2020 has declined to 4.4Moz.
Exploration budgets fell by 22% over 2023 and 2024. Just 19% of the existing budget for exploration in 2024 went to greenfield exploration.
Even though major gold miners are high grading their reserves, mining all the best gold and leaving the rest, they still aren’t managing to satisfy global demand for the precious metal, not even close. Only by recycling between 1,000 and 1,500 tonnes of gold jewelry can demand be satisfied.
This is our definition of peak gold. Will the gold mining industry be able to produce, or discover, enough gold, so that it’s able to meet demand without having to recycle jewelry? If the numbers reflect that, peak gold would be debunked. We’ve been tracking it since 2016, and it hasn’t happened yet.
Read more: Our gold mining industry is in trouble — Richard Mills
On the demand side, electrification and decarbonization are driving demand for metals. EVs for example contain four times as much copper as gas-powered cars. Technology companies are investing hundreds of billions of dollars to build AI data centers requiring reams of copper wiring.
Demand for copper — the cornerstone for all electricity-related technologies — is set to grow by 53% to 39 million tonnes by 2040, according to BloombergNEF. A shortfall of 30% could occur by 2035.

Commodity prices will of course depend on the supply and demand for each, but The Globe points out that several commodities are under-valued compared to the overheated US stock market.
Take copper, which after inflation is 30% below its 2011 peak, or oil and the Bloomberg Commodities Index (BCOM) which are 70% under their previous peaks in 2008.
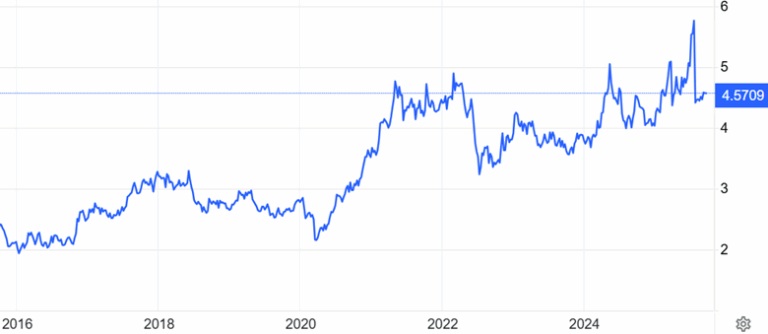
Copper, Silver and Gold charts from Tradingeconomics.com
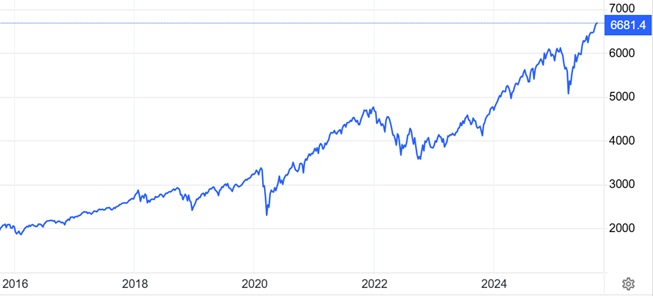
The S&P 500 by contrast continues to hit all-time highs, having almost tripled since the pre-financial crisis peak in 2007.
Trading Economics
Trading Economics
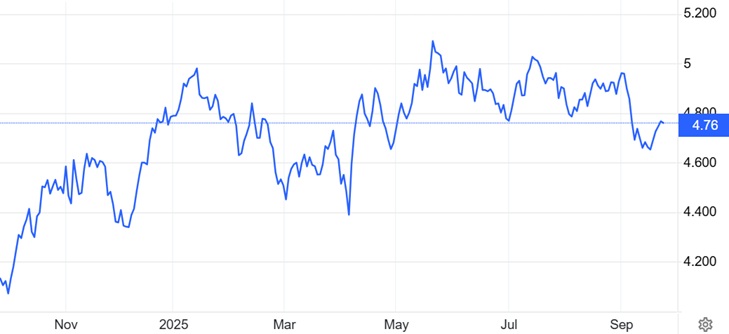
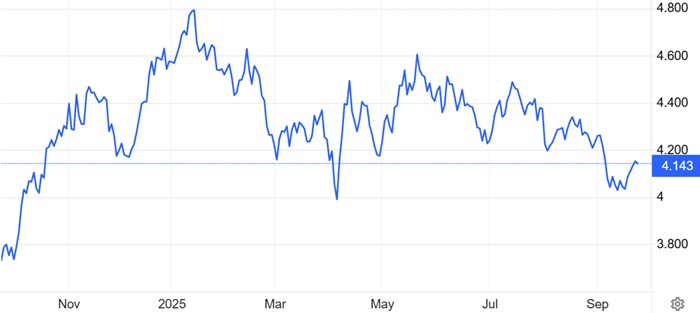
Meanwhile investors are shying away from bonds due to inflation. The inflation threat has them demanding higher yields especially on long-term bonds. The yield on the 10-year Treasury as of this writing is 4.14%, while the 30-year continues to flirt with the disastrous 5% level, 4.76%.
Trading Economics
The Globe notes that Gold has already reasserted itself as a hedge against geopolitical turmoil and monetary debasement, driven by relentless central bank buying and growing retail interest.
Central banks worldwide are on track to buy 1,000 tonnes of gold in 2025, which would be their fourth year of massive purchases as they diversify reserves from dollar-denominated assets into bullion, consultancy Metals Focus said, via Reuters.
French bank Société Générale (SocGen) upped its gold allocation from 7% to 10% for a protective hedge as the US Federal Reserve begins a rate lowering in the face of rising inflation. The French bank expects gold prices to average $4,128 an ounce in 2026.
“From an asset allocation perspective, we have looked at gold in the context of the USD’s dominance being challenged. The key drivers supporting gold remain firmly intact,” the analysts said.
They added that they expect gold prices to remain well supported as falling interest rates and elevated inflation push real yields lower, increasing demand for gold as an alternative store of value.
At the same time, the analysts said that the ongoing global diversification trend away from the US dollar makes the precious metal an important monetary asset. They added that they don’t expect higher prices to be a barrier to further central bank purchases. (Kitco News)
Global gold ETFs saw their third consecutive month of inflows in August, led by Western funds.
US stock market underperforming
The case for commodities is already playing out in the stock market. Another Globe and Mail piece notes The Canadian stock market is having a breakout year. Who do we have to thank for that? Believe it or not, Donald Trump…
Why? At least in part, it’s because the President’s erratic policy-making has helped to make Canadian stocks more attractive by undermining confidence in the U.S. economy and the U.S. dollar.
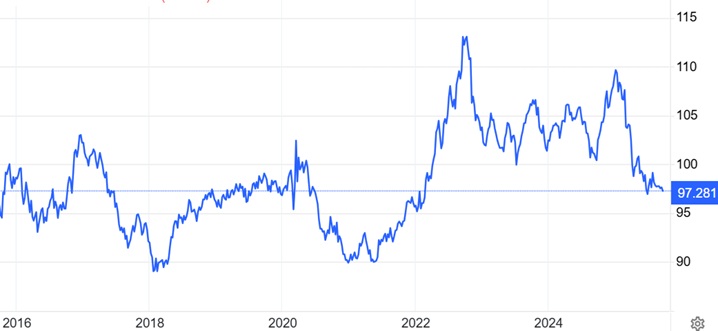
Dollar Index Trading Economics
From January through the first week of September, Canadian stocks returned 22.5% in US dollar terms, outpacing US stocks which returned just 12.2%.
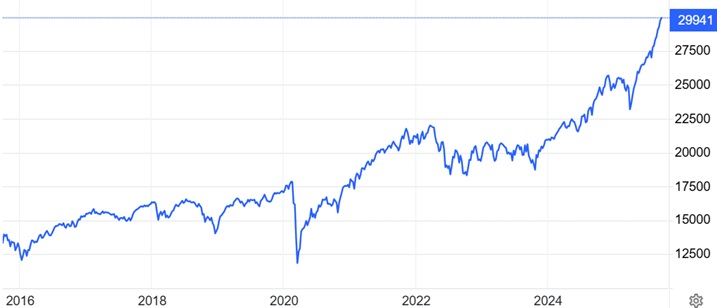
Canadian TSX Trading Economics
Other countries’ equity markets also beat America’s, with Chinese stocks gaining 34.5%, German stocks up 29.3%, British stocks up 22.8%, and Japanese stocks advancing 19.1%.
The Globe notes, The outperformance of non-U.S. markets marks an emphatic turnaround from the situation that prevailed over the past decade, when Wall Street made a habit of thumping its international rivals year after year.
Despite underperforming its global competitors, the newspaper warns that the US stock market is “bubbly”. US stocks trade for 44 times their average inflation-adjusted earnings of the past decade, compared to “only” 29X for Canadian stocks.
If Wall Street’s and Bay Street’s ratios revert to their long run means over the next decade, The Globe further warns that investors’ returns over the next few years will be substandard.
For the Canadian markets, a big factor is gold. As bullion soars over 40% due to the chaos in Washington, many investors are buying gold bars, coins, and gold stocks. The Globe notes Canadian miners such as Agnico Eagle and Barrick have done ever better than physical gold, with some gaining 80% or more.
According to Capital Economics, gold miners have been a key factor in lifting the S&P/TSX Composite Index to greater heights in recent months, with half of the benchmark’s 20.3% rise (in Canadian dollars) coming from the index’s gold-heavy materials sector.
Video: Gold mining industry troubles Part I
Video: Gold mining industry troubles Part II
Mining-heavy TSX and TSX Venture
A quick Google search finds that the materials sector makes up about 14% of the S&P/TSX Composite. This includes mining, metals, agriculture and other resource-based industries.
Approximately 40% of the world’s mining companies are listed on the TSX and the TSX Venture exchanges.
As of May 2025, there were 1,565 companies listed on the TSXV, 910 of which were mining companies (71.9%). The TSX was home to 1,899 companies, with 181 of those being mining companies. (9.4%).
Conclusion
There have been multiple commodity super cycles throughout the course of history. The last one started in 1996 and peaked in 2011, driven by raw material demand from rapid industrialization taking place in markets like Brazil, India, Russia and especially, China.
The green shoots of a new commodity supercycle, one based on raw materials for supplying the new electrified economy, are growing.
Silver and gold are up over 44% so far this year, supported by a weak dollar, de-dollarization, trade policy uncertainty, and a more dovish Federal Reserve.
Current Fed Chairman Jerome Powell’s term ends in May, and Trump is likely to replace him with someone who agrees with the president on low interest rates.
Copper has come down from its $5.75 a pound pinnacle in July, but at $4.56 miners can still make money, although it’s not high enough (~$5.50/lb) to incentivize new mines.
We know one thing for sure. The case for all commodities rests upon the US dollar. With the Fed starting to cut interest rates, the dollar will weaken further and the entire commodities complex will strengthen, especially if we get more/ deeper cuts by the end of the year.
Richard (Rick) Mills
aheadoftheherd.com
*********


