Precious Metals Update Of The Secular Bull Market
 share
share
 share
share
 share
share
 share
share
 share
share
The precious metals are in a secular bull market which will likely last 15 to 20 years, perhaps longer. Given its start in the 1999-2001 timeframe, that means the current bull should run until 2014 to 2021.
According to Richard Russell all bull markets have three phases. The third phase is marked by mania and a parabolic rise into a peak that is higher than even the staunchest bull expects.
It is important to maintain a big-picture perspective as this multi-year correction in Gold grinds on. Unfortunately, it appears that we have some more pain to endure since both Gold and Silver are breaking below significant support levels.
Let's take a look at the Gold and Silver charts and see what's going on. Most of the charts in this letter use Heikin Ashi (HA) candlesticks, a variation of the traditional Japanese candlesticks. The HA candles filter out some of the noise in a price chart and make it easier to focus on trends.
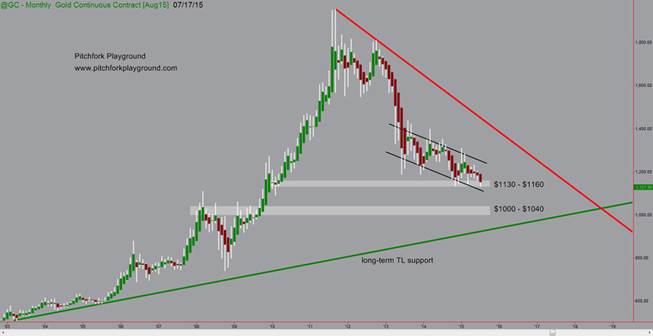
In this monthly chart of Gold it is obvious that the current trend is down even without the HA candles. Here are the major take-aways from this chart:
- Gold is currently in a downtrend within the black price channel
- there is horizontal support in the $1130 to $1160 range and Gold is currently flirting with the bottom of this range
- Gold could spike down to test the $1100 round-number and still remain within the price channel - below $1100, support at the bottom of this channel becomes resistance
- if support in the current area fails there is no significant support until price reaches $1040 to $1000
- Gold can drop all the way to the long-term trendline and still remain in the secular uptrend that started in the 1999-2001 timeframe - this trendline support is in the $890 to $940 range, depending on how you draw the TL
- Gold won't return to full-on bullish conditions until price breaks above the red downward-sloping trendline
GC - COMEX Gold - monthly
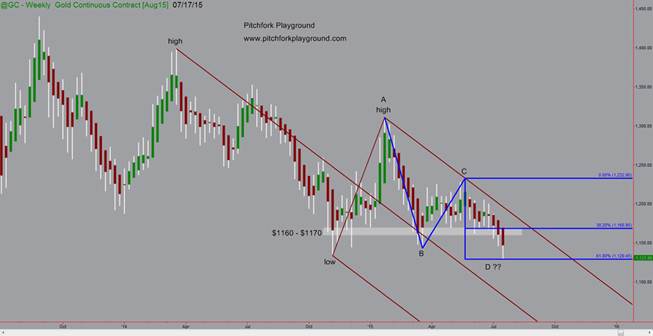
In this weekly chart of Gold we have an Andrews pitchfork describing the downtrend and a Fibonacci extension study showing potential support levels. The Fibonacci extension is most accurate when the A-to-B leg is impulsive, meaning a quick and un-corrected decline as we have here.
When the 38.2% level of the Fib. extension was broken two weeks ago, the next target became the 61.8% level. This past week price tested the 61.8% level and bounced. Perhaps Gold can build support at this level ($1129) and eventually move higher but additional tests of the 61.8% level are likely.
Based on the rules for using Andrews pitchforks, price is now targeting the median line of this fork which gives us a target around $1080 to $1070.
GC - COMEX Gold - weekly
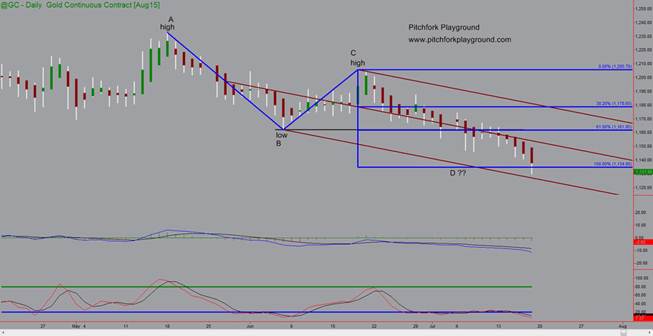
In the daily timeframe we have a regular-Schiff pitchfork and another Fibonacci extension. Price has reached the 100% level of the Fibonacci study and bounced, but hasn't demonstrated that the level is support. Again, the rules for using Andrews pitchforks (and their variations), tell us that the lower median line of this fork ($1125) is our next target.
The indicators are suggesting that there is still downward energy to be expended. Both the MACD line and MACD histogram are falling. Stochastics are very oversold but still declining.
GC - COMEX Gold - daily
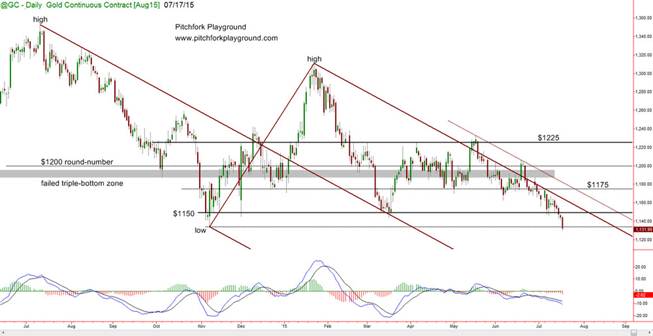
Here's another perspective on the daily timeframe. Support at $1150 has been decisively broken. Price has penetrated the low from November 2014 but could still find support in this area. Compare the dashed line at $1134 to the solid line at $1150 - the $1134 level hasn't been tested so we don't know if it will provide any significant support (thus the dashed line). In contrast, the $1150 level acted as support several times so we draw a solid line.
GC - COMEX Gold - daily
Silver is getting wisterpooped (short swift smack to the side of the head). Supposedly the current cost of producing an ounce of silver is $18 to $20 and here we have spot Silver trading below $15. That's a 20% discount, for anyone with a bargain-shopping mentality.
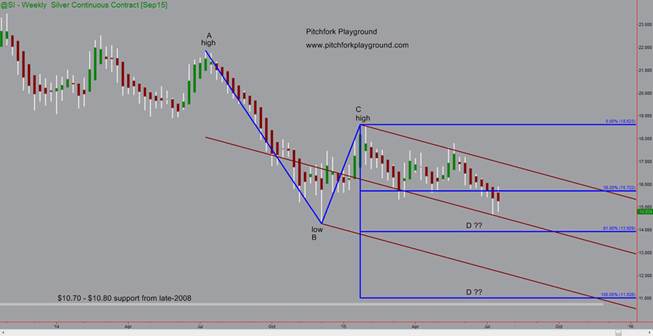
The 38.2% Fibonacci extension level has been decisively broken so we have to assume that price is targeting the 61.8% level at $13.92. Silver may not reach that target but, as we stated above, when price drops impulsively the Fibonacci extension tool often provides accurate targets. Compare the A-to-B leg in this study to the decline on the left side of the chart - which decline would you classify as being impulsive?
We have a regular-Schiff pitchfork describing the current downtrend. Price tested the median line of this fork recently and bounced but we should expect additional tests of this level.
Hopefully the fork's median line and the 61.8% Fib. extension level will mark the bottom of silver's multi-year decline. If support at these levels doesn't hold, we will be looking for a test of the lower median line of the fork ($12.00'ish), the 100% Fib. extension level ($11.02) or the $10.80-$10.70 level from late-2008. "Ouch!", is all I can say about that possibility.
SI - COMEX Silver - weekly
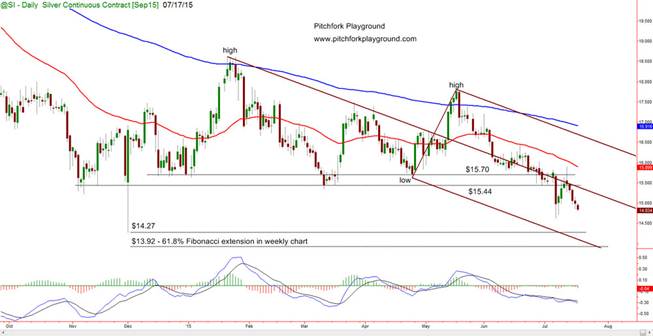
Here's the daily timeframe in Silver using regular candlesticks. Obviously support along the median line of the Andrews pitchfork has turned into resistance. Now we have to assume that price is targeting the lower median line around $14.00. Our next horizontal support levels are the $14.27 prior low and the 61.8% Fib. extension level from the weekly chart.
MACD is on a sell signal with both the MACD line and the MACD histogram falling.
SI - COMEX Silver - daily
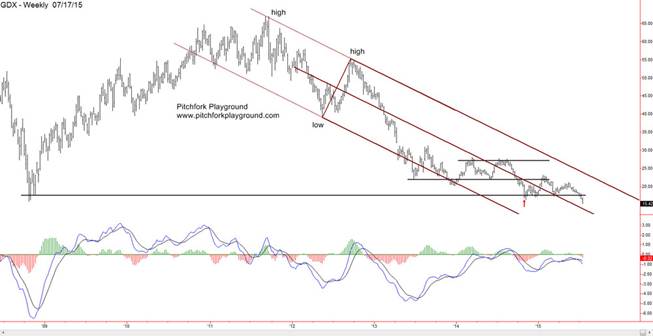
It isn't surprising that the mining stocks are dropping given the weakness in the price of the metals. Here we see that GDX has broken decisively below the support from late-2008. Price is targeting the median line of this modified-Schiff pitchfork in the $13.50 to $13.70 region.
GDX - Gold Miners ETF - weekly
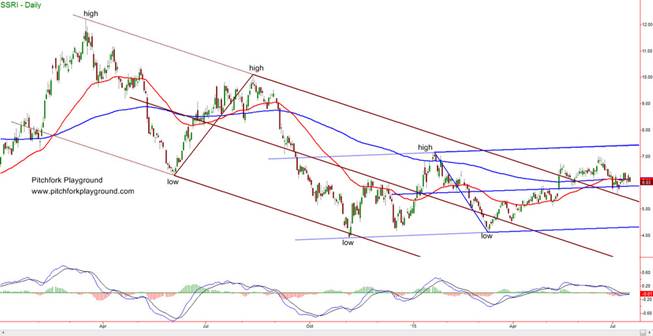
SSRI is looking good in comparison to the other mining stocks. When the sector returns to bullish conditions it is reasonable to expect a stock like this to out-perform, since it showed relative strength when other stocks were puking on their shoes.
SSRI - Silver Standard Resources - daily
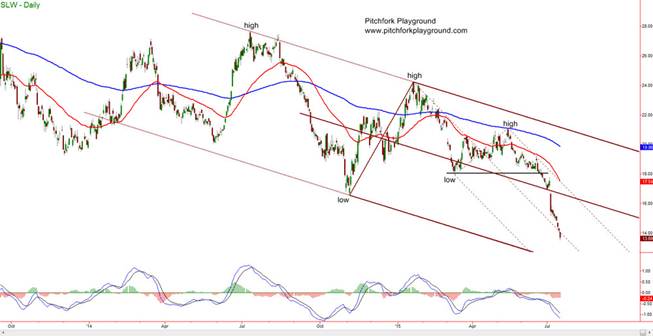
And speaking of puking, SLW is showing what many of the mining stocks are currently doing.
SLW - Silver Wheaton - daily
It is my opinion that we are still several weeks or months away from seeing a bottom in the precious metals sector. What we really need to see at this point is a serious capitulation where all the weak hands puke their positions into the market. This would be marked by high volume and perhaps some exhaustion gaps to the downside. Having Gold spike down below $1100 could be just the ticket to cause this capitulation. I will be a strong buyer whenever the puking begins.
********
Bryan Editor-in-Chief, Pitchfork Playground
Visit the website to sign up for the free Pitchfork Playground newsletter. Each of the letters explores the amazingly predictive nature of Andrews pitchforks. Pitchfork Playground
share
share
share
share
share