Pro-Gold Yield Curve Steepener Continues


10yr-2yr yield curve steepener continues after secondary extreme inversion; gold holds steady
Many have questioned why the gold price has failed to do the normal thing (decline significantly) in the face of high ‘real’ yields (an indication of very tight monetary policy)…
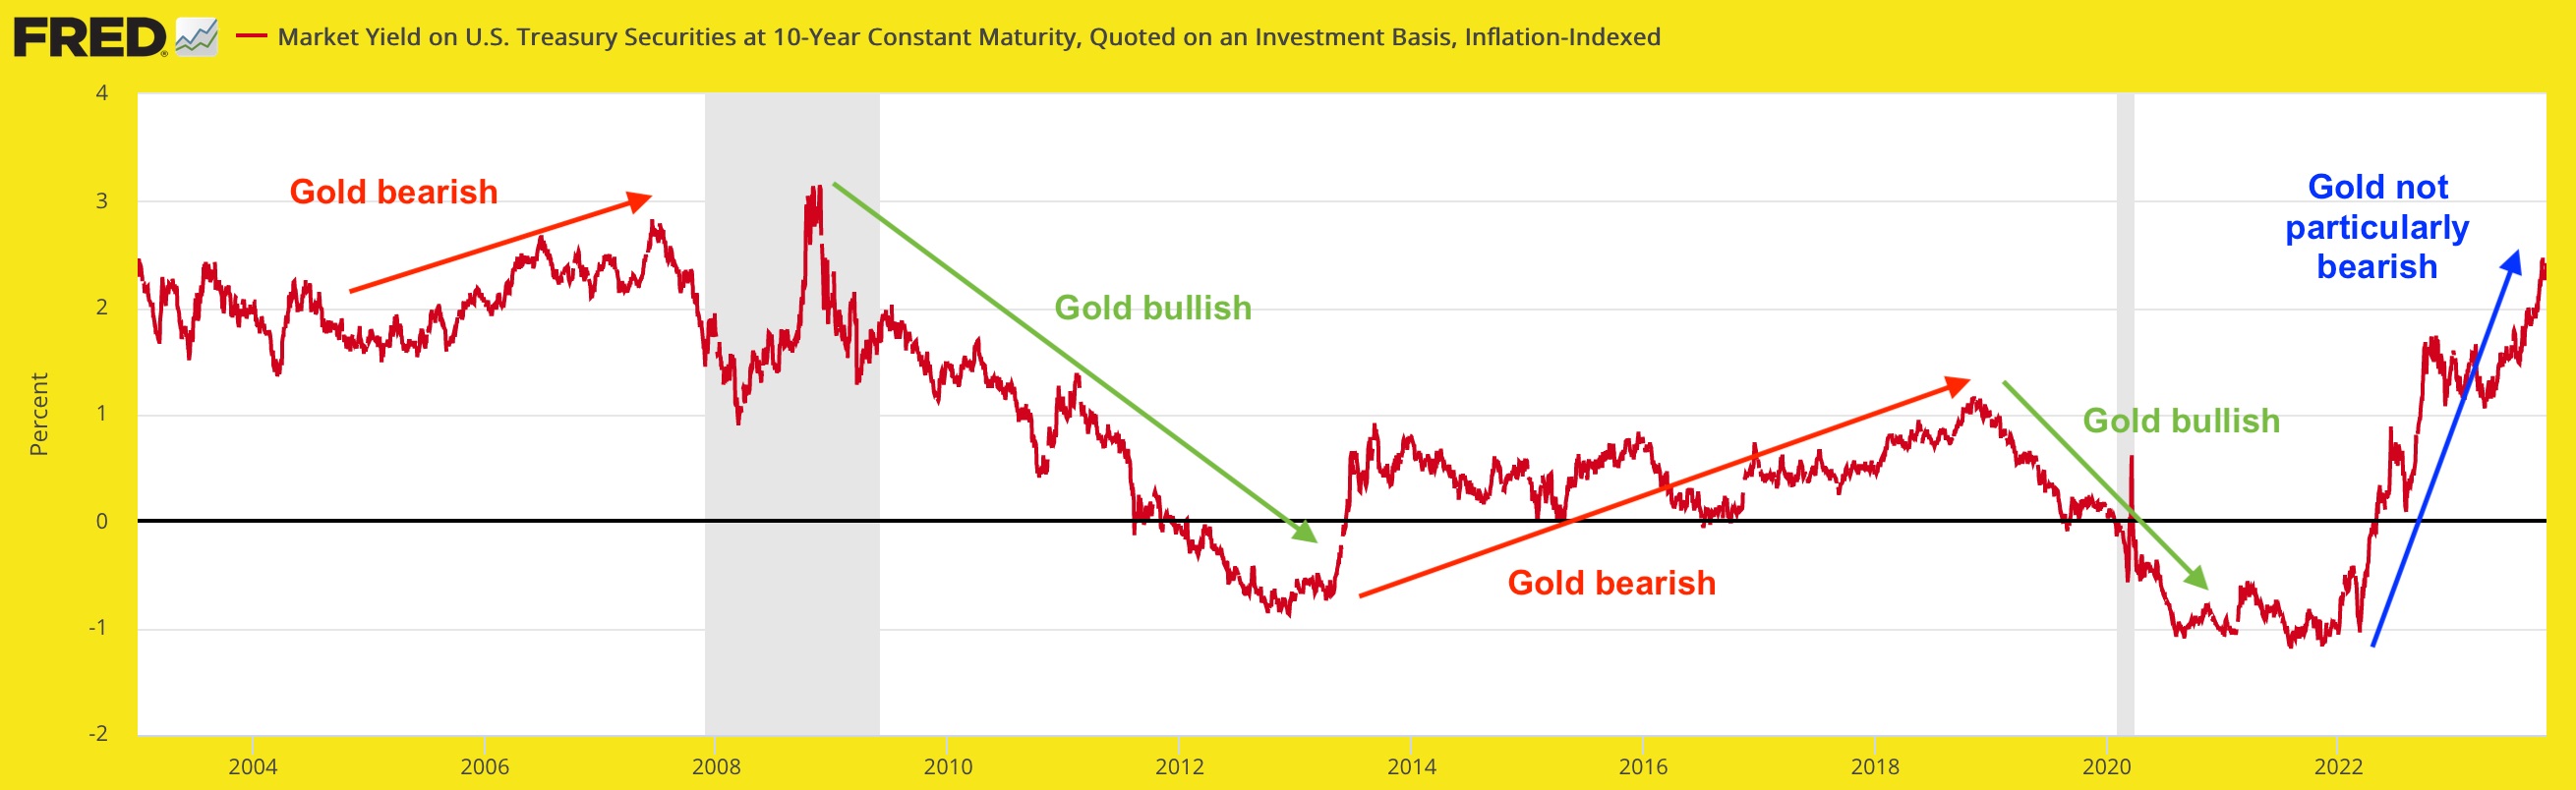
St. Louis Fed, Gary’s markups
…why the gold price has held up despite muted High Yield spreads (implying intact risk ‘on’ investor behavior), despite the intact Goldilocks phase (inflation cooling, but not too cool) that has benefited the US dollar and the stock market in 2023, and other signals typically negative for gold.
Assuming that war (never a healthy reason to be long-term bullish on gold) input is limited since gold was in a normal and healthy correction (but well above what the macro signals would normally imply) before the disaster in Israel and Gaza erupted, we might simply assign the golden anomalies in play now to the fact that it’s a new macro with new rules.
Here again is my favorite picture of a new macro beckoning new rules. In NFTRH 779 we began a process of defining the possibilities in play by the implications of this chart. That will have to remain proprietary to NFTRH, but my jaw dropped a little when considering the shear beauty and symmetry in play. It has to do with the differences in inflation/deflation dynamics before something broke (2022 spike above the monthly EMAs) and today, in the aftermath and birth of the new macro.
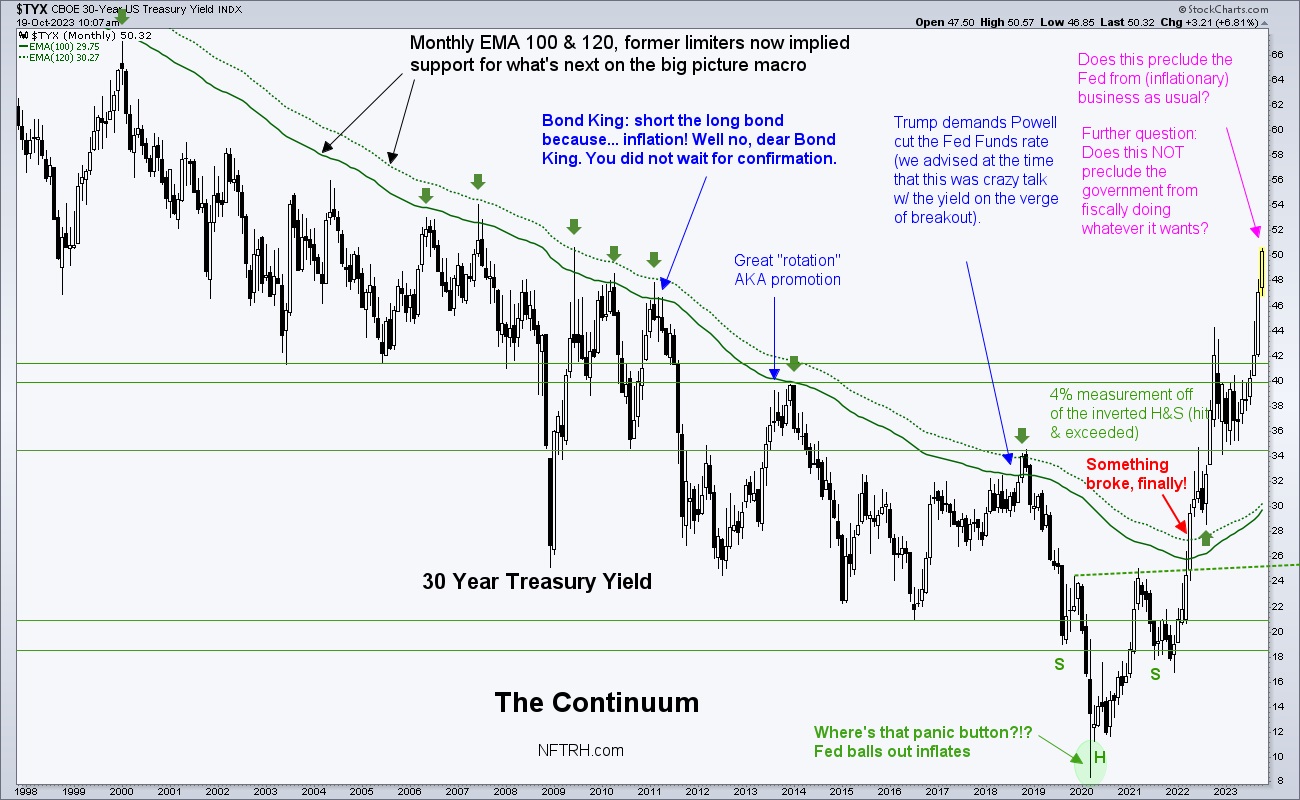
But the main point is that something changed profoundly and if you’re following the playbook of 2000-2022, that is akin to following Bill Belichick and his obsoleted coaching style (and/or roster construction philosophy) vs. today’s NFL. Interestingly, the New England Patriots dynasty began the year the great inflationary Maestro, Alan Greenspan, kicked the age of Inflation onDemand into gear in 2001 and ended the day Tom Brady walked out the door, soon to be followed by the old macro door closing and a new one opening.
One indication that will likely turn out to be a tail wind to the gold price is the yield curve; in this case the 10yr-2yr yield curve. The curve has done as we’d projected after the secondary inversion extreme and is now ticking new cycle highs and soon an undoing of the inverted state.
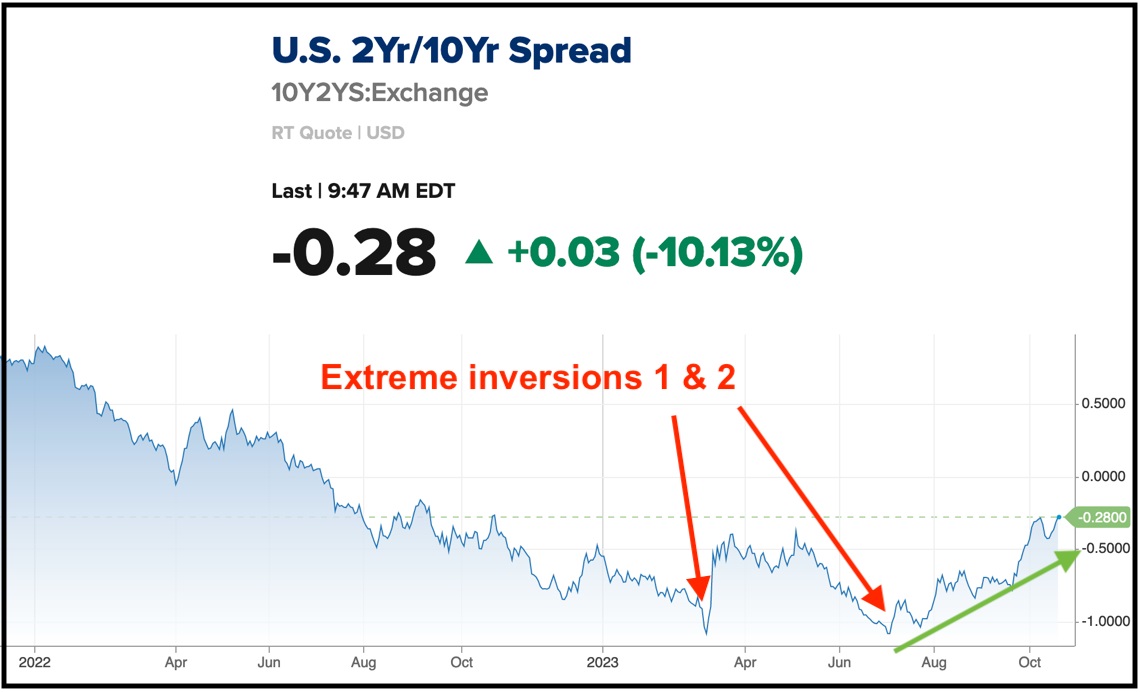
cnbc.com, Gary’s markups
Why does a yield curve steepener favor gold?
Well first off, let’s review the fact that a steepening yield curve can come under deflationary pressure, inflationary pressure or both over the course of an extended steepener. As an example, the run up to the 2008 deflationary liquidation featured a steepening curve in 2007-2008 that began inflationary and resolved deflationary.
A steepening yield curve under deflationary pressure implies that markets are going risk ‘off’, seeking liquidity of short-term cash equivalents over speculation in long-term debt instruments. Gold is favored in relation to risk assets like stocks, commodities and even silver as its monetary aspects come into play as a safe haven. This safe haven can eventually turn into a play on the gold price as well, when markets get a whiff of dovishness emanating from policymakers’ various orifices. But the main feature is that the ‘real’ price of gold, as measured in a spectrum of risk assets, would rise and likely rise hard regardless of whether or not the nominal gold price is rising.
Interlude on gold stocks
The above also happens to be THE investment case for gold mining stocks. Listen to analysis claiming China, rising oil prices, inflation and war are positives for gold stocks if you will. But it is wrong and it’s no wonder legions of gold bugs have been perma-wrong while making excuses about wrong-doing from our overlords or whatever.
When gold rises vs. risk assets like stocks and mining costs like oil and materials, the fundamental picture will improve and the miners will do what they have not done over the last 20 years; leverage the gold price in a positive manner. See last week’s As the New Macro Engages, Gold Stocks to Shine for a compelling picture of the HUI/Gold ratio juxtaposed against the new macro.
Back on message
The deflationary view is the favored dominant view for the new steepener. Right now the steepener is signaled to be under inflationary pressure with nominal yields rising, but when nominal yields top out the curve will be likely to continue steepening under deflationary pressure because risk asset prices will be tanking.

“Signaled to be under inflationary pressure” does not mean inflationary pressure is building in this case. We have documented all along since projecting a broad recovery in Q4, 2022 that inflationary pressures would wane, and they have done just that. Don Quixote is tilting at his inflationary windmill for other reasons, in my opinion. Like perhaps a Federal Government that refuses to muzzle itself and stop its sublime levels of debt spending.
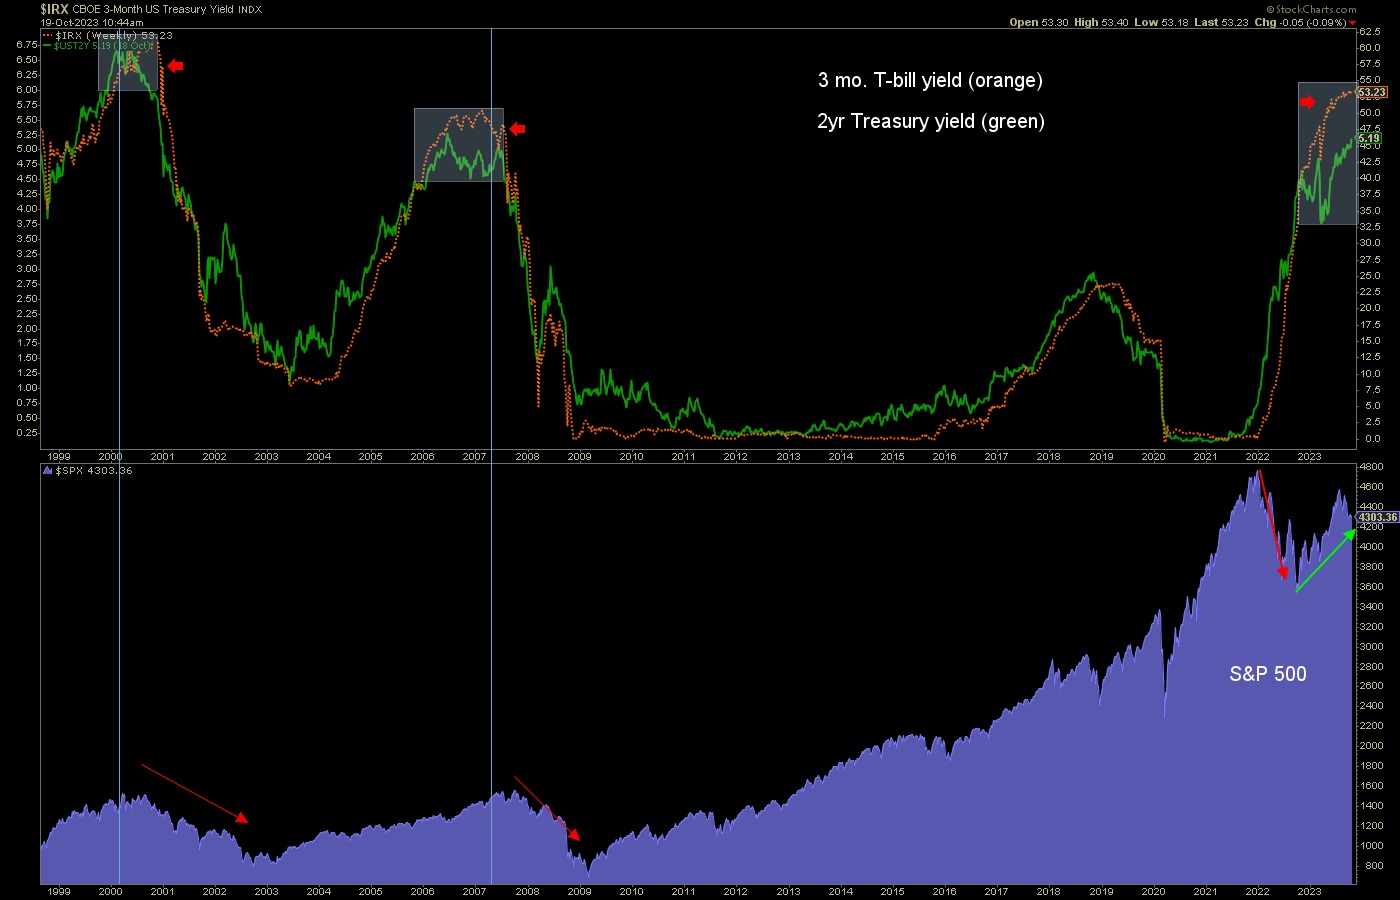
A steepening yield curve under inflationary pressure would theoretically paint the Fed as behind the curve. But of course, the Fed is currently tight… VERY tight, as the 3 month T-bill continues to diverge the 2yr yield as it has prior to previous bear markets in stocks. This divergence should eventually crack the stock market into a bear market.
The very fact that the Fed appears intent on cracking inflated asset markets implies that an inflationary yield curve steepener is way out on the horizon. But no matter the mix of deflationary and inflationary pressure on the yield curve, a firm steepener of the yield curve usually implies economic hardship if not an outright economic bust.
Gold. Is. Counter. Cyclical… relative to speculative risk assets.
Through years of moaning, in some corners, about gold’s lack of performance, let’s just note that gold has generally performed better than it should have performed with macro signaling such as it has been since mid-2020. But firmness in the gold price – again, backing out the war inputs, which are there and do complicate if not compromise the fundamental picture – is likely looking ahead to turns in the macro yet to come. For months now various indicators have been slipping that way (the yield curve above is exhibit A) but it is when the herds (and their fund managers) take note that these turns will become obvious on Main Street.
In a complicated macro, yield curves are currently steepening. That’s a fact.
As a final note and in keeping with the theme that gold is counter-cyclical, you might want to review this handy graphic from Gold-Eage, an unbiased gold website that has been publishing my work for nearly 20 years now: Gold Prices During Stock Market Crashes.
For “best of breed” top down analysis of all major markets, subscribe to NFTRH Premium, which includes an in-depth weekly market report, detailed market updates and NFTRH+ dynamic updates and chart/trade setup ideas. Subscribe by Credit Card or PayPal using a link on the right sidebar (if using a mobile device you may need to scroll down) or see all options and more info. Keep up to date with actionable public content at NFTRH.com by using the email form on the right sidebar. Follow via Twitter@NFTRHgt.
*********


