Quantitative Easing #4 Has Begun


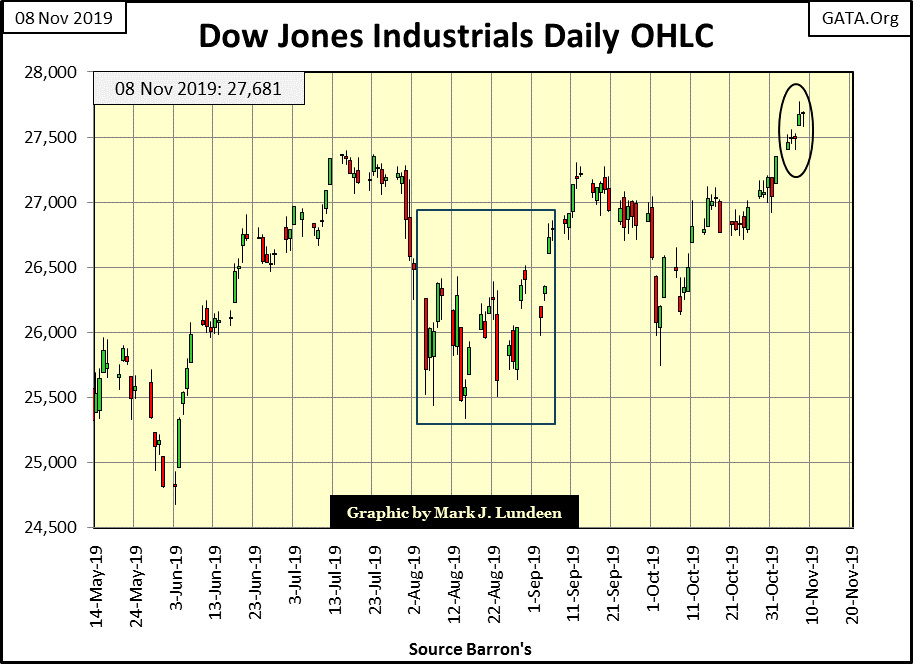
Nothing succeeds like success, so this week the Dow Jones made four new BEV Zeros. Wednesday was the odd man out, closing only $0.07 (seven pennies) from making a new all-time high. And how did the Dow Jones do for the week? It closed up 1.22% from last Friday’s close. That’s better than a stick in the eye, but after four new all-time highs, I would have expected the Dow Jones to have moved something greater than 2% for the week.
I was right about what the key to higher valuations for the Dow Jones would be – whether or not the FOMC was “injecting liquidity” into the financial system; and they are. In October they “monetized” twelve-billion dollars of Uncle Sam’s IOUs in the Treasury Market. Now after only two weeks of November they have “monetized” thirty-billion dollars of Uncle Sam’s IOUs, and I expect they’ll “monetize” at least that much again before November gives way to December.
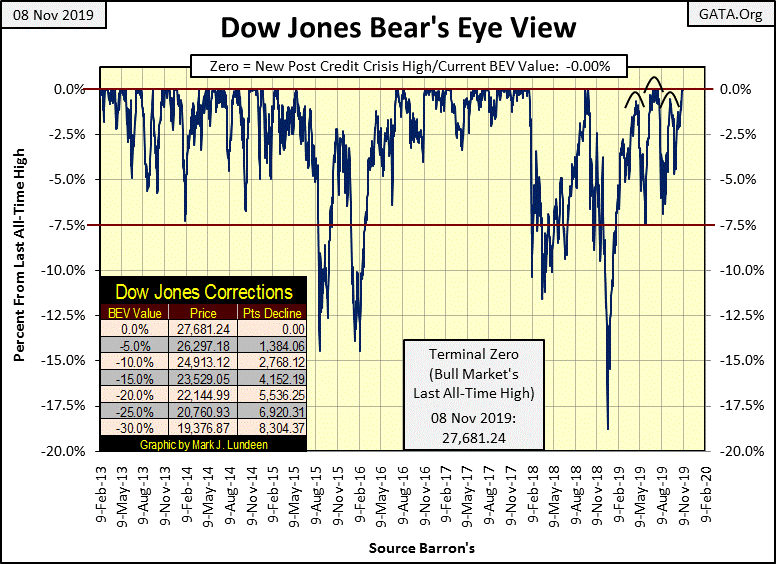
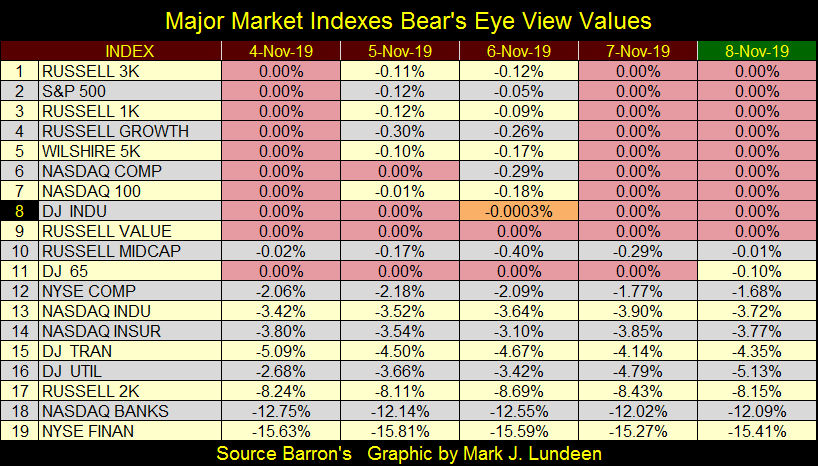
Here are the daily BEV values for the major market indexes I follow, new all-time highs highlighted in red. Lots of history was made last week. Note the orange for Wednesday with the Dow Jones (#8), which was down $0.07 from Tuesday’s close. I had to format the cell to four digits before it read a value less than -0.00%.
Since July when nothing else was making new all-time highs, the Dow Jones Utility Average was. In August it made seven daily BEV Zeros, September it made six, and in October it made one new BEV Zero. This Friday’s close found the DJUA at #16 in the table above, down by -5.13% from its last all-time high, down 3.75% from last Friday’s close. That’s a larger percentage decline than gold saw this week; down -3.68% from last Friday’s close.
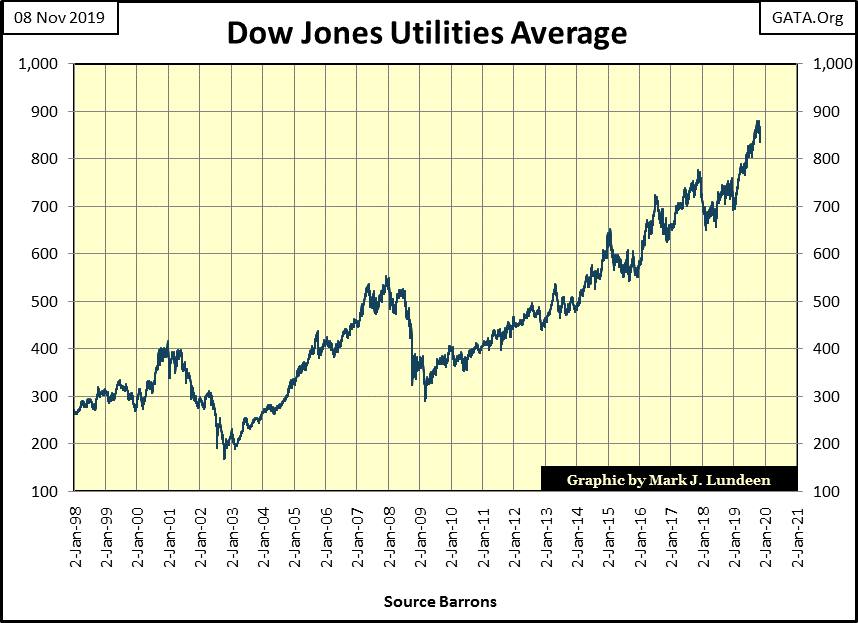
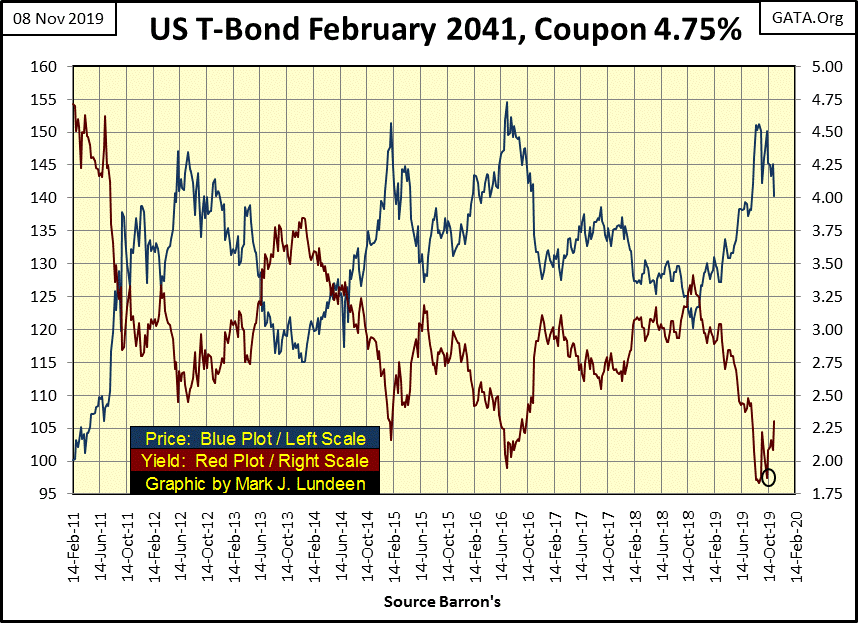
Utility stocks are what they used to call interest-rate sensitive stocks. The Dow Jones Utility Average’s last BEV Zero was on October 4th. Since then this T-bond’s yield (chart below) has increased by forty-four basis points (0.44%), almost a half of a percent.
Why are bond yields going up and utility stock prices going down during a period (last six weeks) when the FOMC has monetized $42 billion dollars in the Treasury market? I don’t know, but they shouldn’t be. However six weeks is a very small sample.
Next is the Dow Jones in daily bars. Although the Dow Jones in the table above looks impressive with its four BEV Zeros, when compared to what it actually did this week in the daily bars below, I’m much less impressed.
Four BEV Zeros; that’s all the Dow Jones managed to get in October 2018, and again last summer in July before the bulls became exhausted and retreated to lower levels. I’m curious to see what the Dow Jones does next week. With the FOMC now apparently implementing their QE4 (though they don’t, and won’t call it that), the stock market may have another significant run up into record territory.
Keep in mind that all the gains the Dow Jones has seen since its 09 March 2009 bottom have all been from the Federal Reserve “injecting” massive doses of monetary inflation into market valuations.
“Policies have contributed to a stronger stock market just as they did in March 2009, when we did the last iteration of this. The S&P 500 is up 20% plus and the Russell 2000, which is about small cap stocks, is up 30% plus.”
- Doctor Benjamin Bernanke, CNBC Interview with Steve Liesman 13 Jan 2011 (1:40 PM).
One of these days this is all going to end in grief.
Ours is a strange world. What if one morning you woke up and discovered you now live somewhere far, far from Kansas? What might things look like?
One clue you weren’t living with Ante Emma on her farm anymore would be how standards that served mankind well since cavemen days had disappeared, standards such as exactly who had the burden of childbirth; male, female or transsexual, as seen in this Daily Mail article from the UK.
Then there’s this cringe-worthy television ad for menstruating men and boys; an ad it seems I can’t avoid when watching TV.
https://www.lifesitenews.com/pulse/tv-networks-to-air-commercial-depicting-menstruating-men-and-boys
And seeing someone like Zombie Boy (recently deceased / photo below) being hailed as a popular icon of fashion isn’t something one would expect from a civilization in its prime.

Having public libraries invite drag queens to read to pre-school children isn’t what was once called normal either.
https://www.infowars.com/?s=drag%20queens%20libraries
But to me the biggest tipoff something is really wrong with our world, a world plagued with monetary inflation is how gold and silver always seem to get whacked by all the usual suspects at the COMEX, while the MSM financial media, government regulators, and people who should care like precious-metals mining executives say nothing.
In decades past, how many times had Kitco’s gold & silver charts below seen this happened? More times than I care recalling.
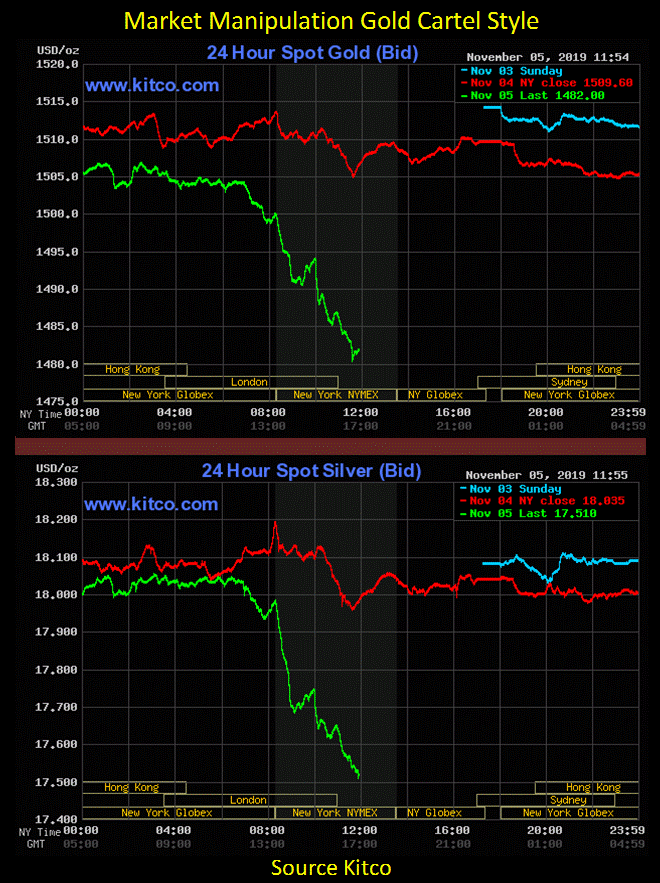
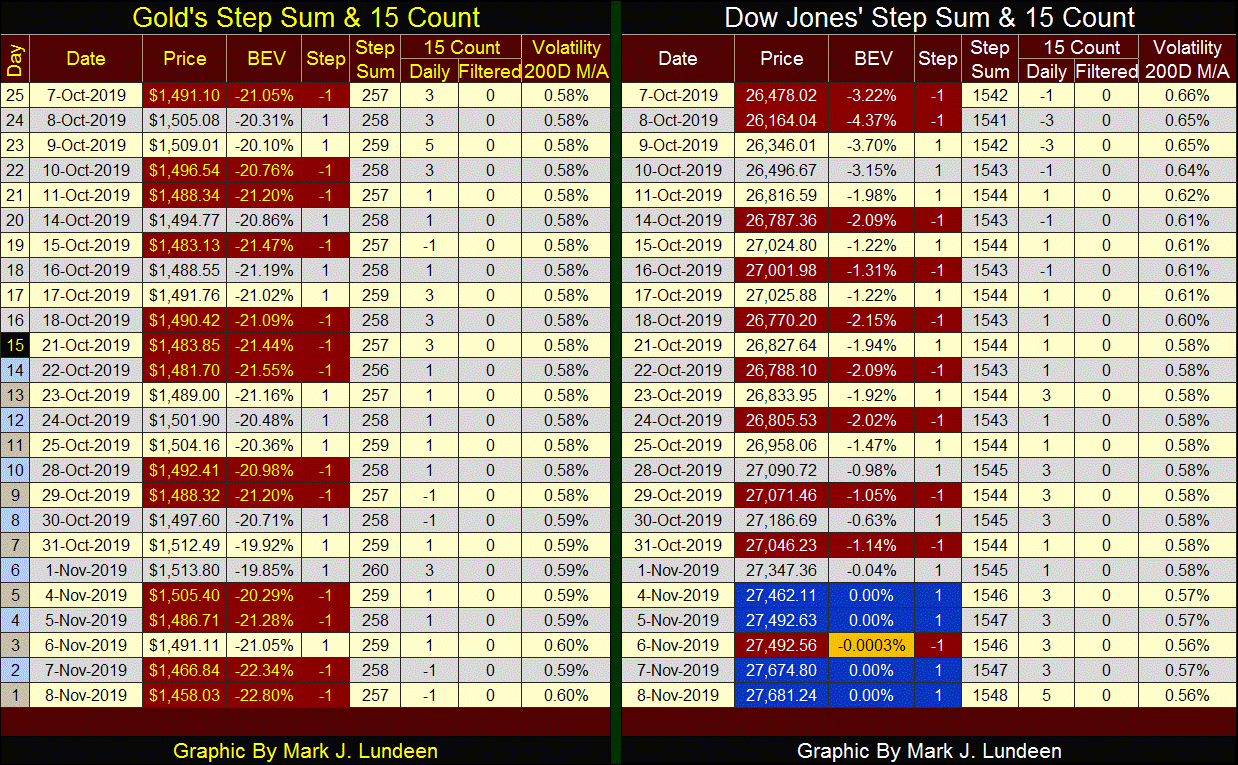
The big crash seen above was on Tuesday, so how did gold do for the week? Looking at gold’s BEV chart below we see from last Friday’s close, gold went from above its BEV -20% line down below its BEV -22.5% line, a loss of over $47 an ounce - ouch. Gold’s next line of support is its BEV -25% line ($1415), or $43 from where gold closed this week.
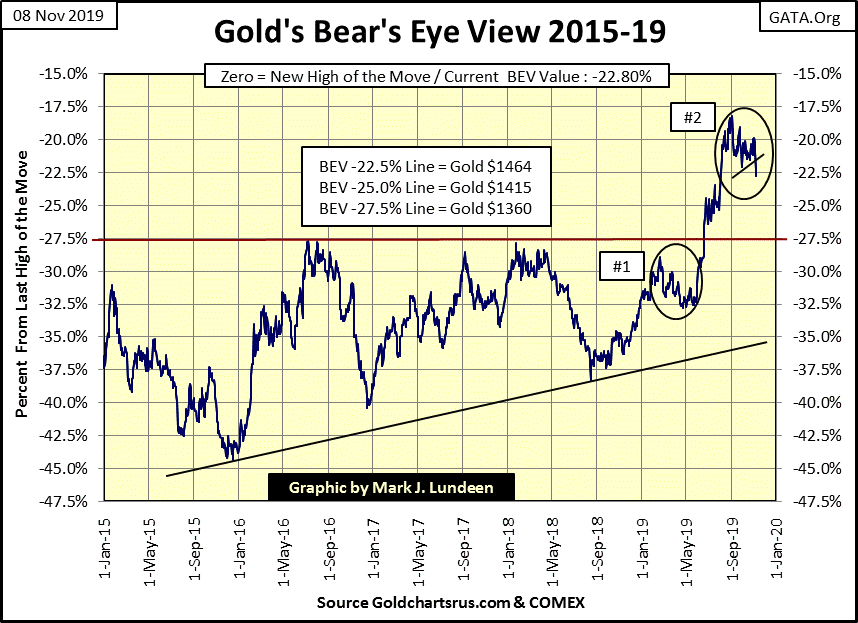
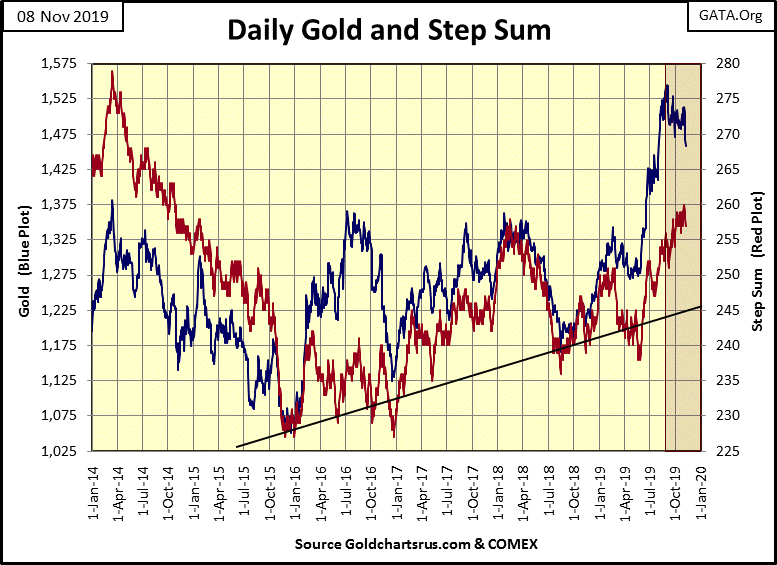
Might gold break below its BEV -25% line? Gold’s step sum chart (below) suggests gold’s current correction has more to the downside before it will turn around.
As I said last week, the thing about a bear box is that usually it’s the bears that have it right. Last week I speculated that maybe for the bear box seen below that this time the bulls have it right. But with this week’s break down below gold’s 1475 line, I’d have to say that as usual it’s the bears who have the better feel for this market than do the bulls.
If this bear box plays itself out as they usually do, expect the price of gold (market reality / Blue Plot) to continue to come under pressure as gold’s step sum (market sentiment / Red Plot) continue to rise or trend sideways. What’s happening here is the bulls see each down day as a buying opportunity in a market correction within a continuing bull market advance.
At some point the bulls will see that they are wrong, at which time they will then see every advancing day as an opportunity to sell. This reversal in market psychology will result in gold’s step-sum to reverse downward, to once again recouple with its price bearish trend.
We’ll know when the gold market is once again going to resume its bull market advance when both its price and step sum plots reverse to the upside together. That’s how bear boxes typically resolve themselves, and it will be interesting to see if this one follows this pattern in the weeks to come.
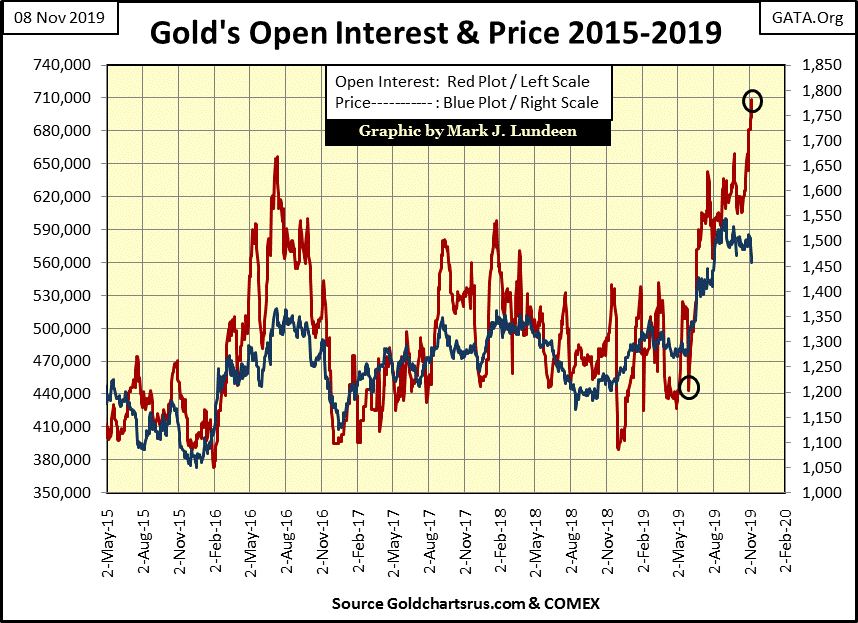
How far can the price of gold go down? Looking at the buildup in COMEX open interest in the chart below, possibly a lot more than I care to see. Since May 31st (lower circle) COMEX open interest has increased from 443,235 to 708,235 contracts at the close of the week. That’s a six month increase of 265,000 contracts trading at the COMEX’s gold exchange. As each contract is for 100 ounces of gold, we see an increase in the supply of paper gold by 26.5 million ounces. This is gold that will never be delivered to the market, and as such is a fraud that government regulators at the Commodities Futures Trading Commission (CFTC) does nothing about.
And exactly what does the CFTC do? If you believe what Enforcement Judge George Painter said in his retirement letter below, not much for the retail speculators in commodities:
…"There are two administrative law judges at the CFTC, myself and the Honorable Judge Bruce Levine. On Judge Levine’s first week on the job, nearly twenty years ago, he came into my office and stated that he had promised Wendy Gramm, then Chairwoman of the Commission, that we would never rule in a complainant’s favor. A review of his rulings will confirm that he has fulfilled his vow."
- CFTC Enforcement Judge George Painter in his retirement letter
This increase in open interest terminated gold’s advance on September 4th, at the start of the bear box seen above. As the bears (the big Wall Street banks) begin liquidating this massive build up in paper-gold contracts, additional pressure will be applied to the price of gold, as happened in 2016.
The thing to watch now is how effective this pending liquidation of COMEX open interest is in pressuring the price of gold down. In the past the collapse in the price of gold could be devastating, as was the case from March to June 2013. But economic and market conditions in 2019-20 are very different from those of seven years ago. This time the big banks may discover that the bulls are not so eager to run to the tall grass as open interest is liquidated, and then again maybe not.
For gold, these are the things to watch in the weeks and months to come:
-
COMEX open interest liquidation below;
-
Collapse in Gold’s step sum above;
And hope it’s not a drawn out process.
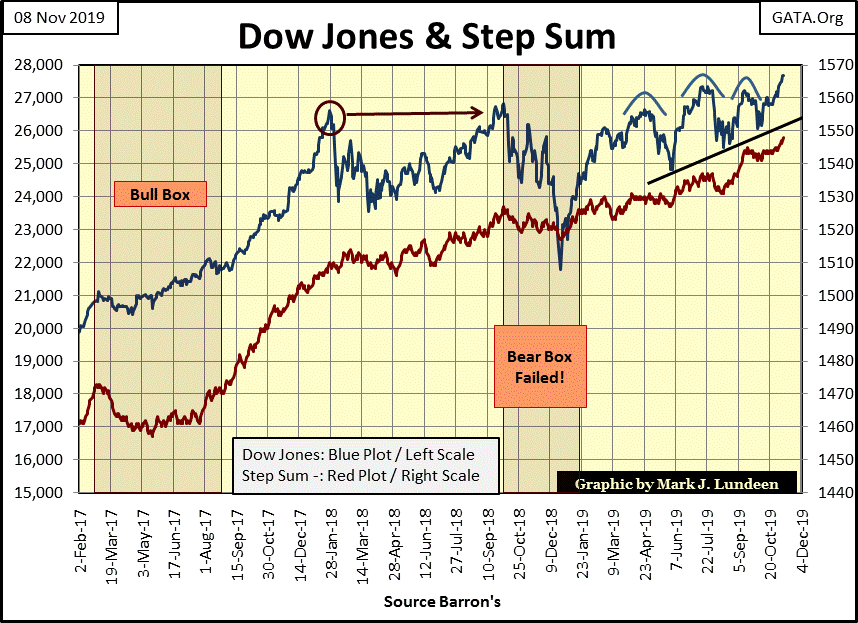
The Dow Jones below had the makings of a bull box as of last week. But I don’t give step sum boxes much credit until they have persisted for at least eight weeks. Anyway, after this week the bull box in the making has been canceled by the advancing step sum.
In gold’s step sum table below we see about as many up as down days since October 7th, leaving gold’s step sum closing the week where it was in early October – 257.
But this week the price of gold came under some pressure, losing $47 from Monday’s to Friday’s close. Anything can happen in the markets; but for reasons given above I’m expecting the price of gold to decrease as selling pressure increases (liquation of COMEX open interest) in the weeks to come.
It’s not the end of the world, or the end of gold’s advance which began in December 2015. It’s just that in the foreseeable future the price of gold will see some downward pressure until its COMEX open interest declines a few hundred-thousand contracts. From that point the advance in gold should resume, hopefully before Christmas.
The Dow Jones is doing fine, with both its price and step sum rising. I’m expecting more BEV Zeros (highlighted in Blue) in the weeks to come. And with the Federal Reserve beginning what it won’t call its fourth quantitative easing just a month ago, it is reasonable expecting the Dow Jones breaking above its 30,000 level before the current advance expires.
This week just proves my point that gold and silver don’t benefit from monetary inflation; rather monetary inflation benefits stocks, bonds and real estate. What drives the price of gold and silver up in their bull markets is DEFLATION in the stock, bond and real estate markets, which drives flight capital from deflating financial asset into precious metals assets.
So in early November, I’m not surprised seeing the Dow Jones, and not the price of gold rising as the FOMC monetized $42 billion in the Treasury bond market since the beginning of October. Yes it’s a crooked game we’re playing, but it’s the only game in town.
Mark J. Lundeen
********


