Rare Signal Revisited; Stocks Tracking Mid-Term Pattern
 share
share
 share
share
 share
share
 share
share
 share
share
 With Gold market in more of a holding pattern in recent days, I thought we would take a look at the cyclical/technical position of the U.S. stock market this weekend.
U.S. Stock Market, Short-Term
For the very short-term, the downward phase of the 10 and 20-day cycles is currently deemed to be in force, with the smaller 10-day wave shown on the chart below:
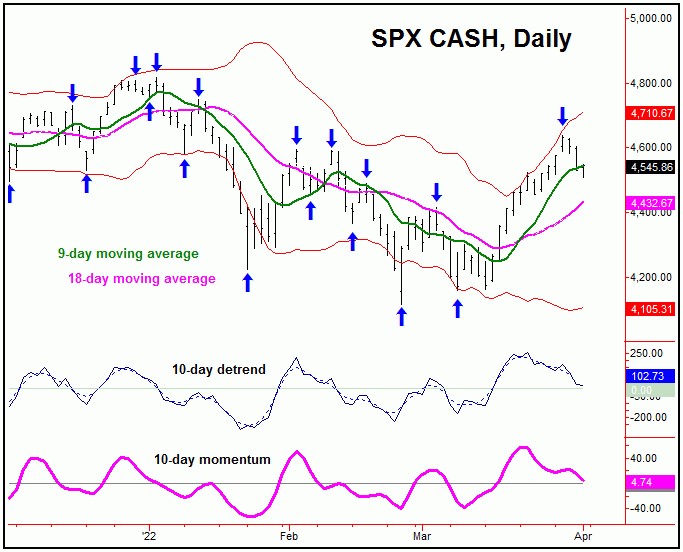
In terms of price, in our daily Market Turns report (which covers the U.S. stock market), we noted the 9-day moving average as the expected price magnet to the recent decline, which has been satisfied with the action into late last week. Having said that, a drop on down for a tag of the lower 18-day moving average would be ideal, due to the position of the larger 20-day cycle, shown on the next chart:
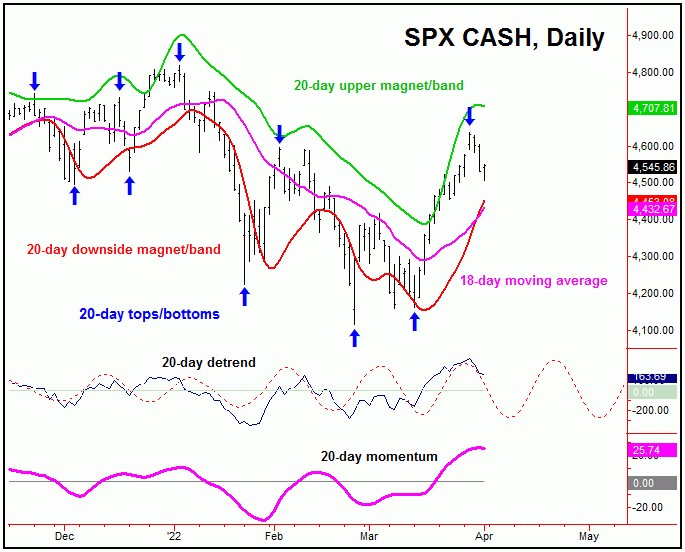
In terms of time, if additional correction is seen in the coming days, there would be a particular focus on the April 6-8 region for the next short-term low to materialize, coming from these 10 and 20-day waves. Support to the downward phase of these cycles is around the 18-day moving average, with the patterns looking for this decline to end up as a countertrend affair - ideally holding above the 4416.78 SPX CASH figure.
Going further with the above, a countertrend decline with the 10 and 20-day cycles - if seen in the coming days - will favor a push back above the 4637.30 swing top on the next upward phase of these waves. In terms of time, the ideal path for that to play out into appears to be the mid-April region, plus or minus. On or after that, the next peak for the larger 45-day wave should try and form, with that particular cycle shown below:
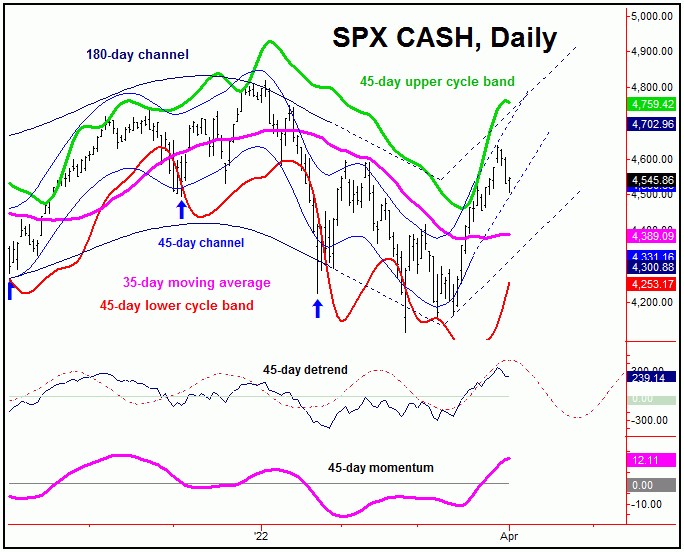
In terms of time, the next peak for the 45-day wave is ideally due on or after mid-April. From whatever high that does form with this component, the probabilities will favor a correction back to the 35-day moving average or lower into late-April to early-May.
In terms of patterns, the next correction phase of the 45-day cycle is expected to end up as a countertrend affair. In terms of price, there should be support around the lower 45-day cycle band, plus or minus. If correct, then another good rally would be expected to play out into mid-May/early-June, before topping a larger-tracked 90-day wave.
'Rare Signal' Revisited
Back in late-January of this year, I mentioned a rare signal that had formed with the U.S. stock market, as measured by the S&P 500 index (or 'SPX'). That signal came from our 180-day 'oversold' indicator spiking above its upper reference line - something seen closer to mid-term bottoms for the SPX. Take a look at the next chart:
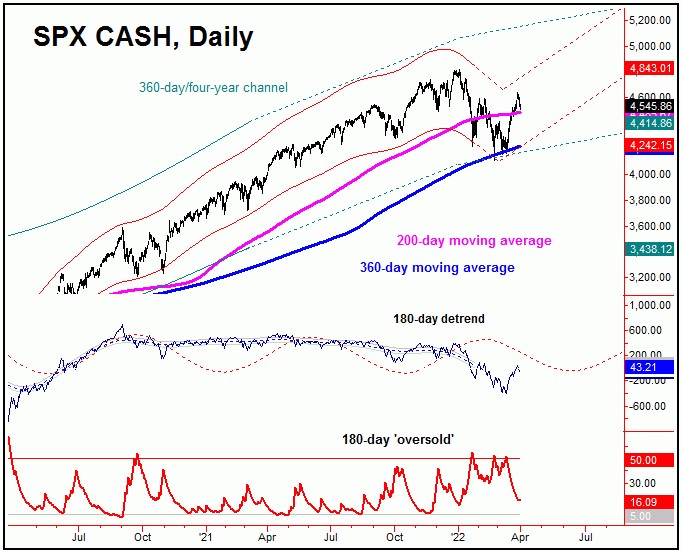
As mentioned back in late-January, spikes above the 180-day 'oversold' indicator's upper reference line were seen closer to bottoms than tops, and suggested a sharp rally was coming on the SPX. With that, we saw a strong rally into early-to-mid February, before turning back to make lower lows for the swing into late-February.
Adding to the notes above, with the decline into late-February, we saw a second - and then third - occurrence of thisr180-day 'oversold' indicator spiking above its upper line, with the last one coming on March 14th (SPX closing at 4173.11). With that, we have seen a rally of some 12% off the lows into late-March/early-April, which is in line with what we might expect to see following this pattern.
With the above said and noted, our outlook favors a mid-term bottom having formed on the SPX back in late-February. If correct, then we are in the very early stages of a multi- moth rally phase, one that could be some 30% or more off the lows, before forming the next major top - expected to come from the larger four-year cycle.
In terms of price, I keep technical observations on each of the cycles that I track. With that, the one that I have noticed with the mid-term cycles on the SPX is this: a larger upward phase tends to at least tag the upper weekly Bollinger Band on the SPX, once it is back in control.
Take a look at the chart below:
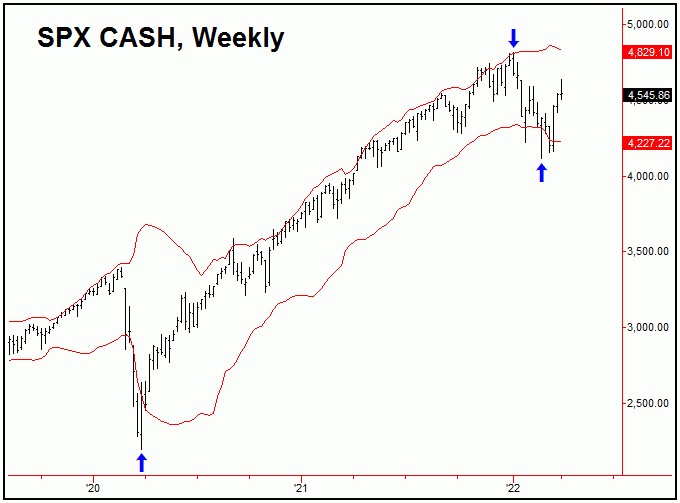
As can be seen on the chart above, the upper weekly Bollinger Band on the SPX is currently at the 4829 SPX CASH figure - but is declining slightly each week. This same upper band is not too far away from the prior all-time high of 4818.62, which suggests a move back to new all-time highs in the coming weeks/months.
Having said the above, if we look at the statistical indications with the aforementioned 180-day cycle, there is the potential for a rally of 30% on the SPX into next year. That is, the average rally phases of that cycle - when coming off a ‘lower-low’ - have been around 30% from trough-to-peak.
Stocks Tracking 'Mid-Term' Pattern
So far this year, the U.S. stock market is closely tracking the mid-term year path within the 'presidential cycle' pattern, which is shown below:
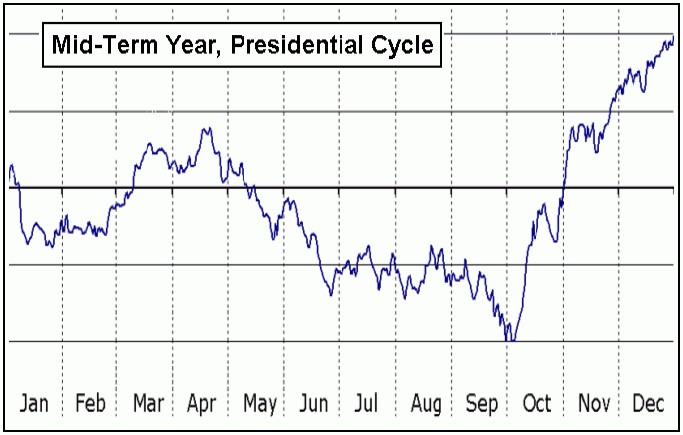
In terms of time, the mid-term year pattern tends to favor additional strength into the mid-to-late April timeframe, followed by another decline into later this year. This actually differs somewhat from the work with the time cycles, which favors a mid-term trough having formed back in February. We will see how this develops going forward.
In terms of price, of note is that the average rallies off a 'mid-term' year low have been around 50% into the following ('pre-election') year high. With that, if the 4114.65 low from February should end up as the bottom for this mid-term year pattern, then, in taking both the inferences from our 180-day time cycle - as well as the mid-term statistics, there would be the potential for an eventual push up to the 5348 - 6171 SPX CASH region.
Even if a larger-degree rally phase is in force for U.S. stocks, it won't necessarily be a straight shot higher in the coming months - but one which sees the normal up-and-down gyrations in-between. That is, there will be several key turns along the way, with the next low of real significance expected to materialize around June or July of this year. More on all as we continue to move forward.
Jim Curry
The Gold Wave Trader
http://goldwavetrader.com/
http://cyclewave.homestead.com/
********
share
share
share
share
share


