A Review of Step Sum Bear Boxes


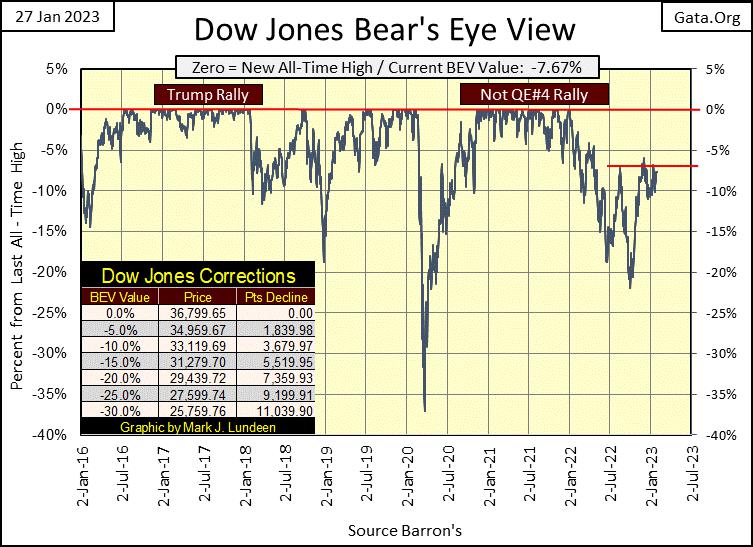
The Dow Jones continues having problems piercing its BEV -5% line, or closing above 34,959.67 dollars. It goes without saying that if it can’t do that, the Dow Jones can’t have a new BEV Zero, a close above 36,799.65.
The Dow Jones has been attempting to close above its BEV -5% since mid-August, demonstrating market weakness by the bulls as week after week the FOMC continues withdrawing their “liquidity” from the financial system. The idiots from the FOMC have been doing this weekly since last May. This week they pulled another $20.35 billion from the market, and it seems this lack of rocket fuel for the market is having an effect.
Looking at the BEV Values for the major market indexes I follow in the table below, the NASDAQ Insurance index made a new all-time high on Thursday. But it’s lonely at the top of this list, as none of the other indexes even closed in scoring position, a BEV of less than -5%. This is how things have been for months now, showing the importance of having support from the FOMC to make the market advance.
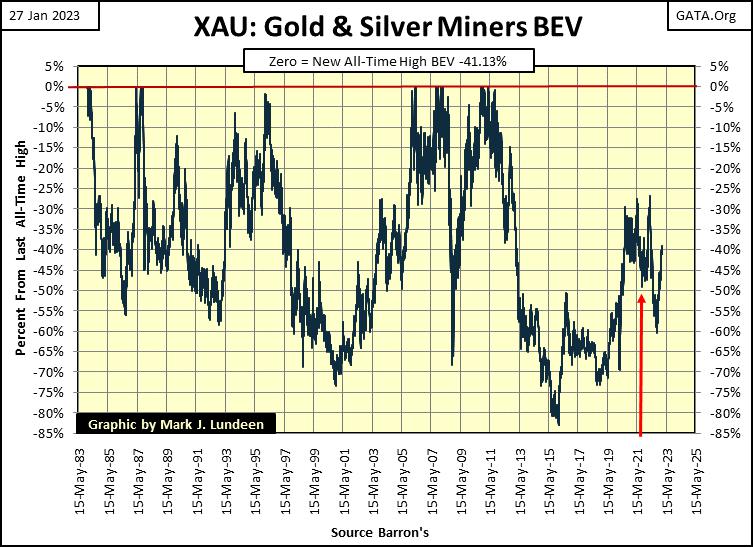
What’s this? On Wednesday the XAU (bottom of the list for over a decade) closed above its BEV -40% line. It’s said that a trip of a thousand miles begins with a single step. As for the XAU going to the top of this list sometime in 2023-24, I believe we are looking at that single step below.
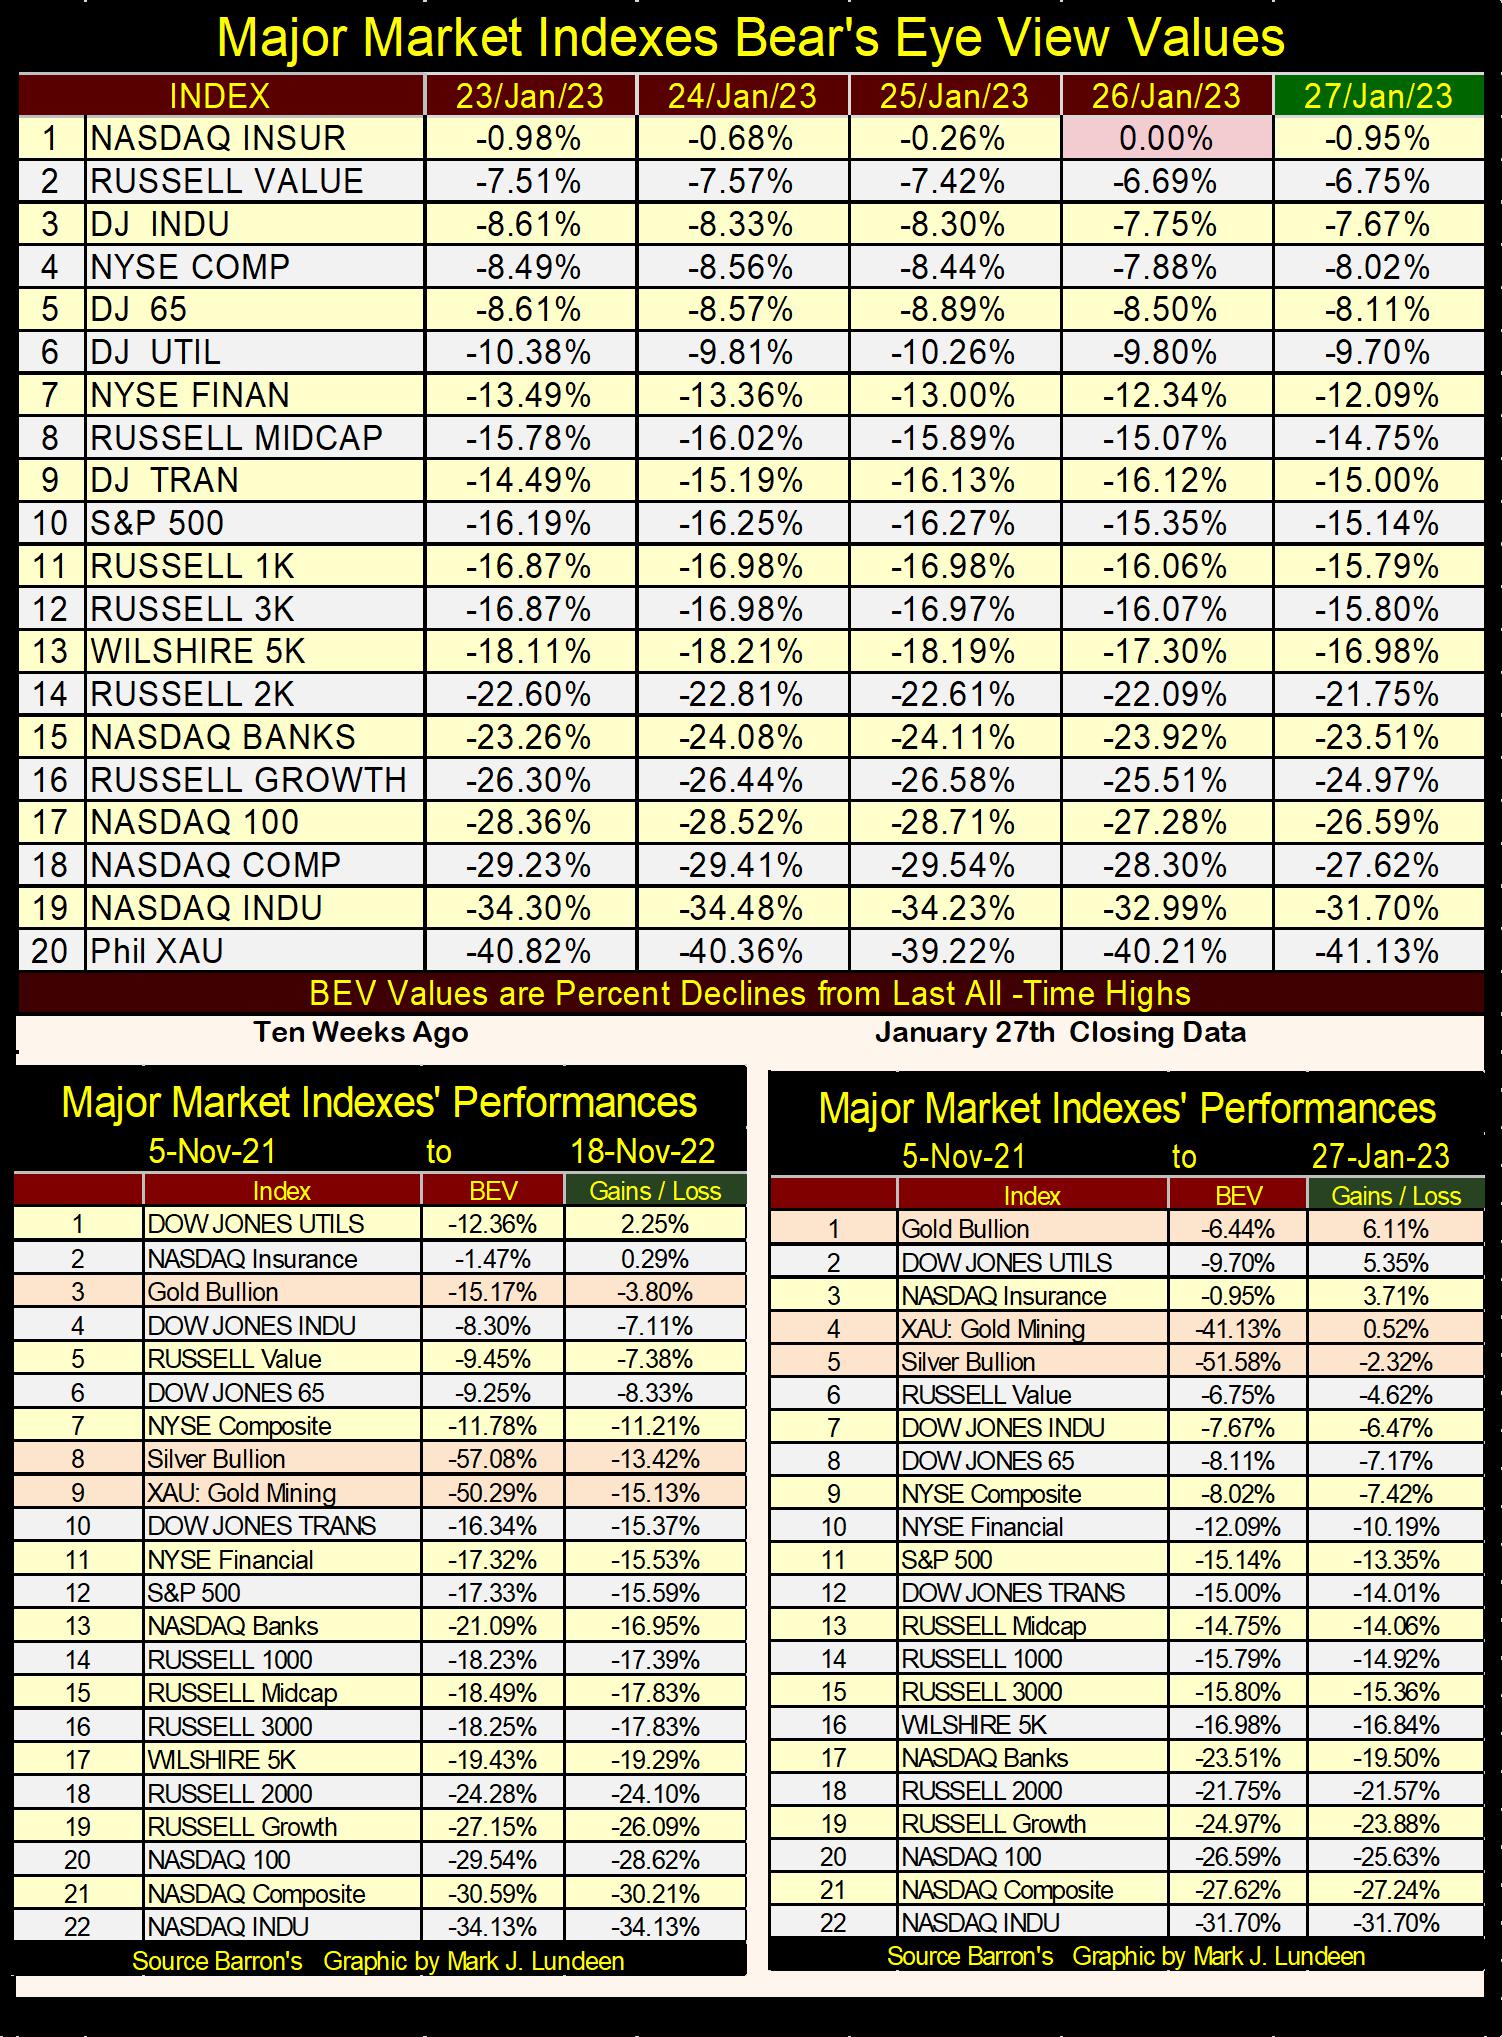
Looking at the performance for the precious metal assets in the right table above, they continue outperforming the broad stock market. Each closing the week in the top five of twenty-two, with gold leading the pack at #1. Quite a change from where these indexes were at on 05 November 2021, in the table below, which then used the lows of 23 March 2020, the bottom of the 2020 flash crash as a basis.
The big changes in the table below from November 2021, to what we see at the close of this week in the table above, isn’t because precious metal assets have roared upwards. Since November 2021, they’ve advanced, but not all that much. The big change in the positions from then to now is due to the stock market’s valuations deflating since November 2021, leaving gold, silver and the XAU at the top of the list.
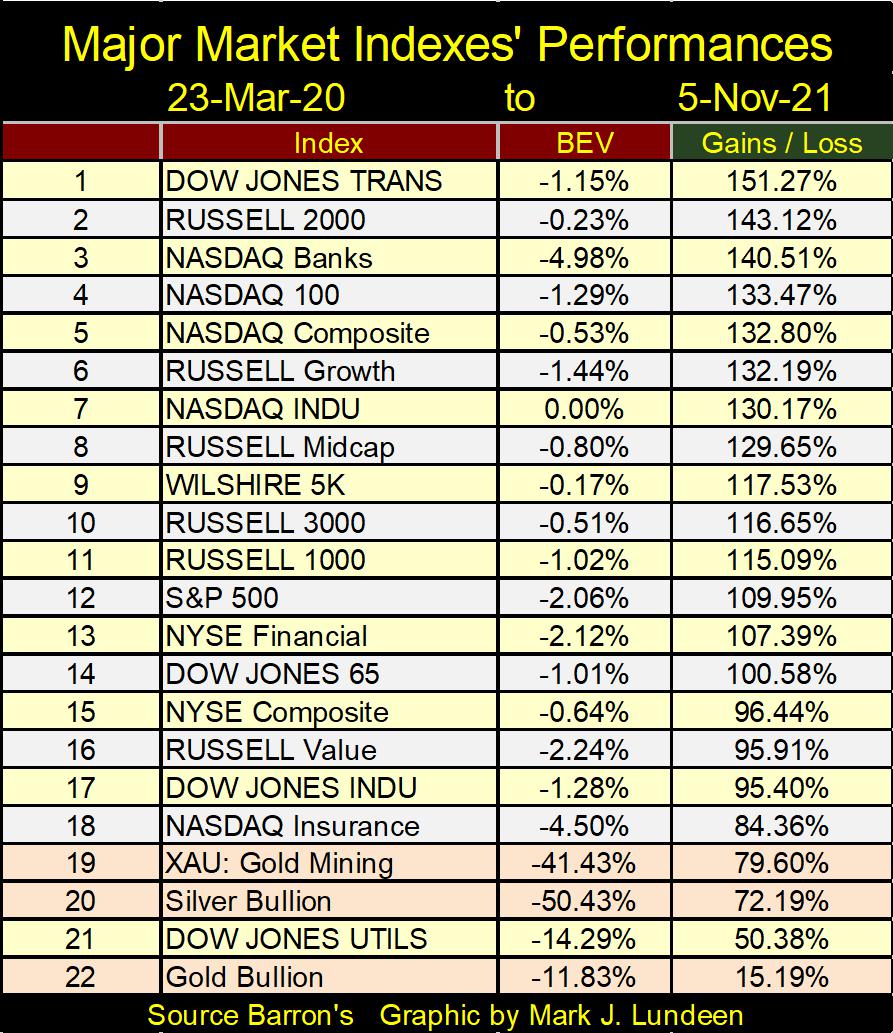
Why were these indexes up so much off their March 2020 lows? With the FOMC’s Not QE#4, which “injected” trillions-of-dollars of monetary inflation into the market, how could they not be. But that was then, and this is now. And now the FOMC is actually pulling “liquidity” from the market, and that makes all the difference from between then and now.
Here's a BEV chart for the XAU, red arrow pointing to early November 2021. The only way the XAU could have finished this week at #4 in the list, is to have everything else above it in November 2021, deflate below it now in January 2023.
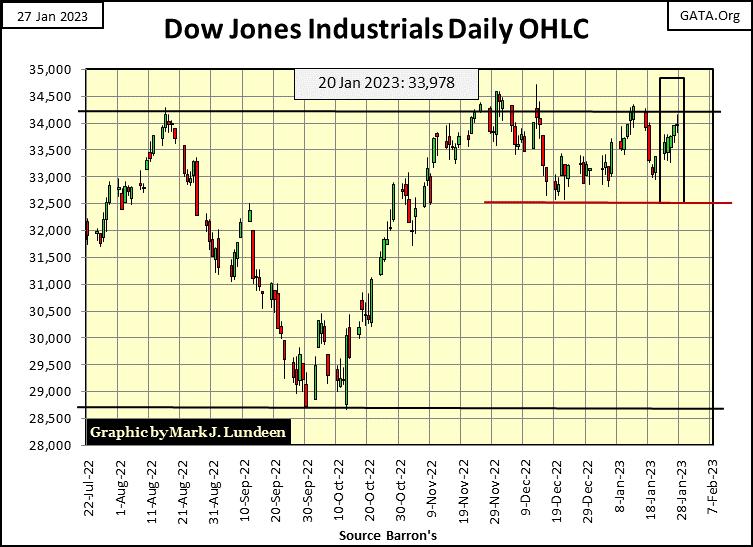
Same story in the Dow Jones’ daily bar chart below, as in its BEV chart above; the Dow Jones is having difficulty breaking above, and staying above a critical area of resistance.
Also, since December the Dow Jones has remained above 32,500 (Red Line), making this an important line of support. If it can’t break above, and stay above 34,250, the Dow Jones will at sometime test its support at 32,500. A break down below 32,500 with authority would be a bad indicator for the bulls.
Up where I’m sitting, high above the playing fields in the market’s peanut gallery, we’re betting beer and hotdogs on what the Dow Jones is going to do next; close above 34,250 or below 32,500. I have a beer on its first breaking below 32,500. I’m probably wrong, but heck its only beer. Time will tell if I’m wrong or right.
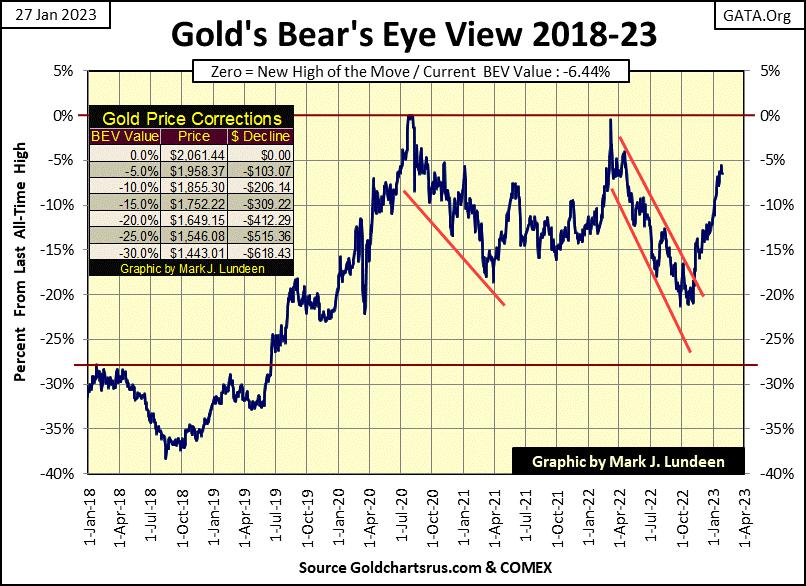
Gold in its BEV chart below is looking really strong. Since October, the only thing gold has done is advance, and now it’s almost in scoring position; less than 5% from a new all-time high. Isn’t it going to see a correction, even a little one before it goes on to a new all-time high?
That doesn’t seem right, but I’m all for it if gold can do it. And gold closing at a new all-time high would even be reported in the mainstream financial media, creating some excitement in the market for other precious metal assets, like silver and the mining shares. So far, 2023 is looking good for the precious metal assets.
I’m sure my readers have noticed I’m a bit different from most market commentators, using what I call the Bear’s Eye View (BEV) and step sum charts. To my knowledge no one else uses these market indicators, probably most people haven’t even heard of them. So, what’s with the BEV and step sum charts?
As a market enthusiast, I used to read anything I could get my hands on concerning technical analysis (TA) to help me understand the market; when to buy or when to sell. But I noticed most of these TA techniques were the same ones used by “market experts” on CNBC or in market publications.
These guys spend all day looking at their computers. I can’t do that. So, they will always have an inside in the market I’ll never have. What I did was to begin compiling market data from the dusty old pages of Barron’s, much of it old market-data series no one uses anymore.
After I had the market data to work with, I had to decide what I was going to do with it. From an old issue of Richard Russell’s Dow Theory Letter, I remembered a unique chart of the S&P 500, where every new all-time high was a 0%, and anything not a new all-time high was converted into negative percentage decline from its previous all-time high.
In effect, this technique compresses dollar market data into a range of only 100 possible percentage points between;
0.0% = new all-time highs,
-100% = total wipeout in valuation,
making it possible to directly compare any decade of market data with any other decade.
I liked it, a lot. So, I figured out how to do that with a spread sheet, called it the Bear’s Eye View as it was obviously how Mr Bear saw any market. Every new all-time high was converted into a 0% (and never anymore), and any data point not a new all-time high converted into a negative percentage claw-back by Mr Bear.
Using it on my daily data for the Dow Jones, I was amazed at what I saw; over 100-years of bull and bear markets in the Dow Jones. Bull markets formed clusters of 0%, or “BEV Zeros” for new all-time highs. Bear markets as specific percentage declines from their previous bull market’s “Terminal Zero” (TZ); last all-time high of a bull market.
For historical market data, the Bear’s Eye View is actually the best way of viewing it. For the Dow Jones, or anything else, it’s just a fact any 40% market decline, whether in the 1890s or 2020s hurts just as much. Just as new all-time highs (BEV Zeros) in a bull market are always exciting market events, regardless of what the dollar valuations are being traded at.
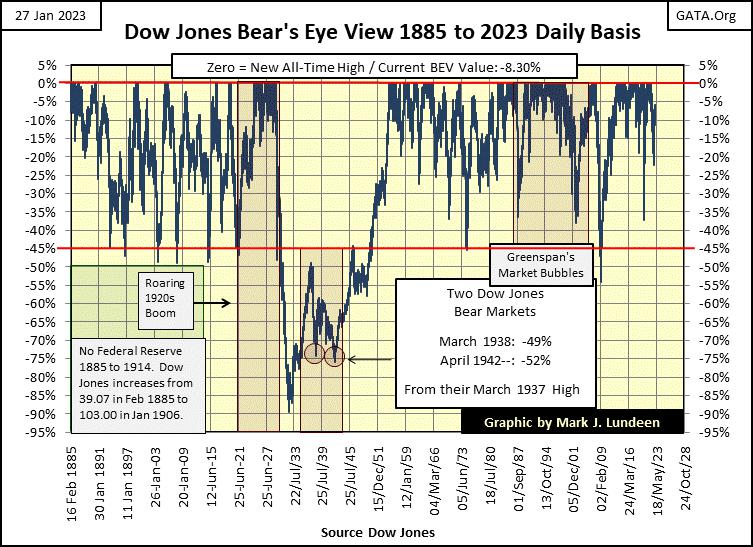
For the Dow Jones, that would be less than $100 in the 1890s, or over $30,000 in the 2020s. Yet with the BEV chart below for the Dow Jones, one can directly compare the bull and bear markets of the 19th century with those of the 21st, providing a fabulous historical insight into the stock market.
If there is one chart that proves there always comes a time to buy, and a time to sell in the stock market; it’s the chart below showing the Bear’s Eye View of the Dow Jones going back to 1885. No bull market goes on forever, and eventually all bear markets hit a bottom.
So it will be, until stocks stop trading at the NYSE, which I’m sorry to say may be a day we’ll see in the not to distant future. I say that because if Klaus Schwab of the World Economic Forum (WEF) is correct that in the future, humanity “will own nothing, and be happy” – there will be no need for the NYSE anymore. Klaus seems to be just the type of guy who would like to see that happen.
The step sum is something I invented myself, not the technique, but its application. The step sum is only an Advance - Decline Line (A-D Line). Usually, the A-D Line is something used with market breadth, daily or weekly Advance and Decline Data at the NYSE or NASDAQ. A-D Lines have been used forever with market technicians to measure the strength of an advance or decline in the market. But the step sum is a single item A-D Line, one that uses the daily advances and declines of a market series like the Dow Jones, the price of gold, or anything else.
Advancing day = +1, Declining day = -1,
The step sum = running sum of advancing and declining days.
Looking at the step sum along with the Dow Jones during the 1920s & 1930s below. As expected, both plots usually trended higher of lower together. But from April 1930, to February 1931, something odd happened; the step sum plot (Red Plot below) decoupled from the Dow Jones (Blue Plot) for almost a year during the Great Depression Crash.
Something happened here, but what? The following is only my theory of the Great Depression Market Crash, as seen in the Dow Jones’ step sum chart below, but here it is.
Looking at the Dow Jones plotted in dollars, one important market detail is always missed. However, when looking at the Dow Jones above in the Bear’s Eye View, you’ll see how from 1885 to 1930, the Dow Jones had never seen a 50% bear market decline. Take a moment and look at the BEV chart above.
Following the bottom in the initial market crash in the autumn of 1929, where on November 13th the Dow Jones saw a 47.87% market decline (a BEV of -47.87%), the smart money seeing a bottom, became bullish, and began buying back into the market. It was the correct thing to do, taking both the step sum and Dow Jones plots up together in the chart below. That worked until April 17th, where in the past five months, the Dow Jones advanced 48% from its lows of November.
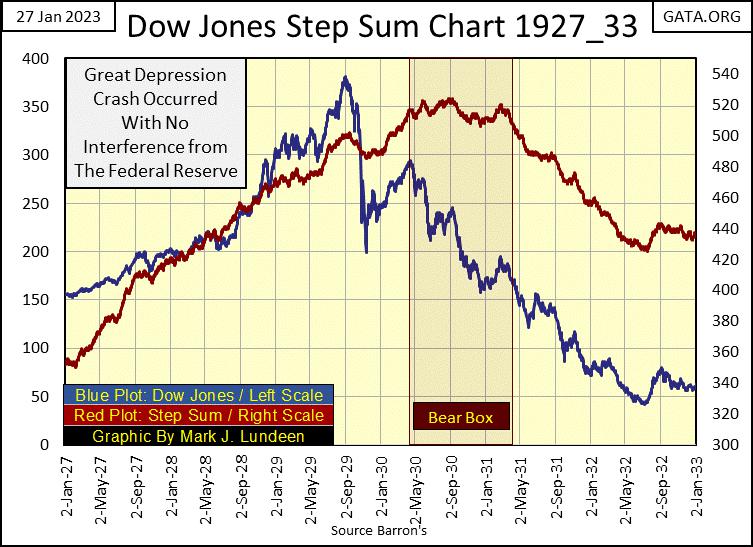
However, from April 18th, 1930 until the ultimate 89% bottom on July 8th, 1932, the market became quicksand. But the bulls in April 1930 didn’t yet realize that. Instead, they believed they were in a bull market, where it’s proper buying on market weakness. Regrettably, following April 17th, the Great Depression’s 89% bear market decline resumed, as the bulls continued buying on market weakness, causing the Dow Jones’ step sum to decouple from the Dow Jones’ valuation.
This is why I call the step sum plot an indicator of market expectation, while the valuation plot is an indication of market reality. Typically, a market’s expectation and reality trend up and down with each other. But when they decouple; a step sum box is formed.
What makes the step sum box above a bear box, is the box took place during a market decline. Bull boxes occur during market advances. The rule of thumb during the duration of the box, is market reality is the superior predictor of the future, not market expectation. Not often, but sometimes this is not so.
It wasn’t until February 1931 when the Dow Jones for the first time ever, fell below its BEV -50% line, that the bulls as a group finally understood they were buying into market weakness during a bear market. A very bad thing to do. The bear box closed when the former bulls began selling their losing bullish position into market strength, resulting in the collapse of the step sum plot (a collapse in market expectations) downward towards the Dow Jones valuation plot.
And so these two plots went, until the July 1932 bottom, where they both bottomed, and then bounced up together. Signaling the termination of the Great Depression Market Crash.
Next is a step sum chart for gold, with two bear boxes and one bull box. I’ve been a gold bug for decades, so the market psychology I describe below is something I, as many other hard core gold bugs from the time would be familiar with.
Since the end of WWII, the US government’s monetary policy was one of inflation, of issuing more paper dollars than the US Treasury’s gold reserves could back with its $35 gold peg. The table below is a little history of the shameful abuse of the Bretton Wood’s $35 gold peg by the Federal Government since 1945. Once, American coinage was silver and its dollar gold. Why that is no longer so can be seen in the table below.
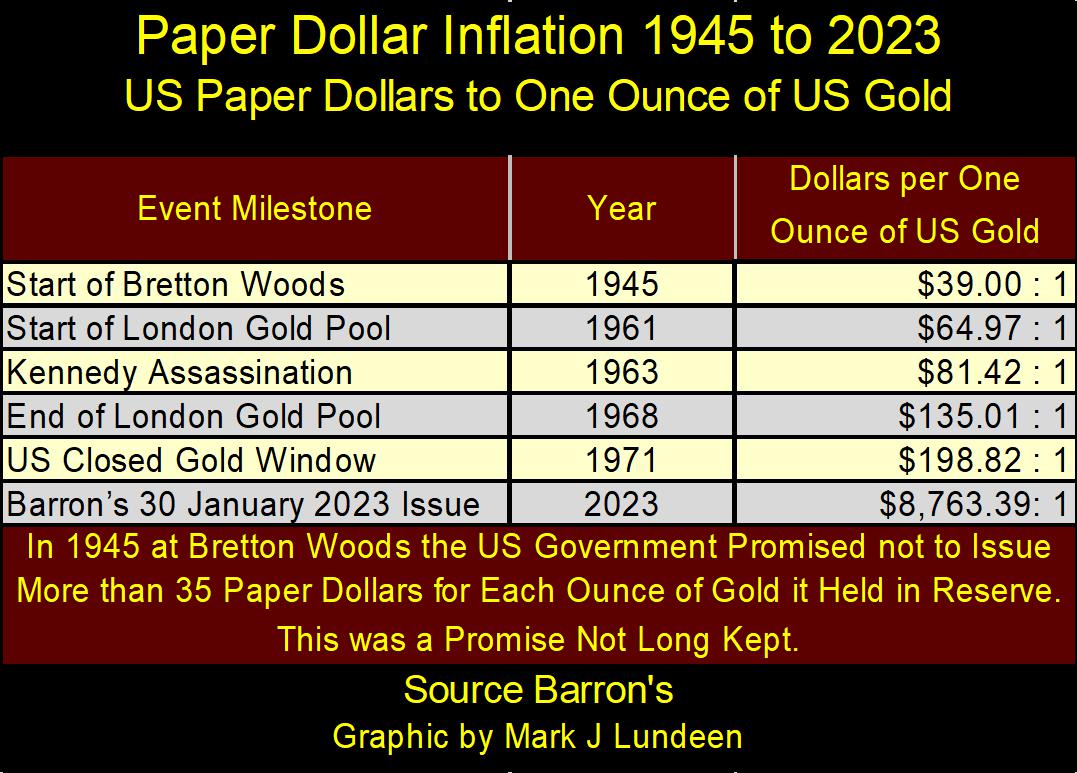
This table above is why hard-core gold bugs remained bullish for almost a full decade during the 1980 to 1999 bear market in gold; see bear-box below. The gold bulls saw the inflation flowing from Alan Greenspan’s FOMC, and wrongly reasoned it must flow into consumer price inflation and commodities, as well as into gold and silver prices.
But they were wrong. Greenspan successfully channeled his monetary inflation into the stock market, resulting in the largest bull market advance on Wall Street during the 20th century.
Gold’s bear box below spans from 1987 to 1996, beginning on an advance in the price of gold that didn’t last long. After gold saw a 66% market bottom in 1984, the gold bulls refused to believe the bear market in gold could continue.
So, for the next decade they continued buying on market weakness, as if gold was in a bull market. Then in 1996, as the NASDAQ high-tech bull market began sucking all of the oxygen out of the precious metals market, the gold bulls began their exit from the gold market. No longer were the bulls (as a group) buying on market weakness. To exit the market, they began selling into market strength, and we can see exactly when that happened, with the start in the collapse in gold market expectations, as seen in the 1996 to 2001 collapse in the step sum below.
Market expectation in the gold market became so bearish, that when the gold market actually bottomed in July 1999, its step sum continued collapsing for the next two years, forming a bull box. For these two years, the gold market was dominated by daily declines. Yet, the bears failed to force the price of gold to decline below its lows of July 1999.
And as is so often the case with bear boxes, we see a markets’ expectations (step sum plot) and market reality (the price plot), turn up together at the start of a new market advance, as in 2001 for the gold market.
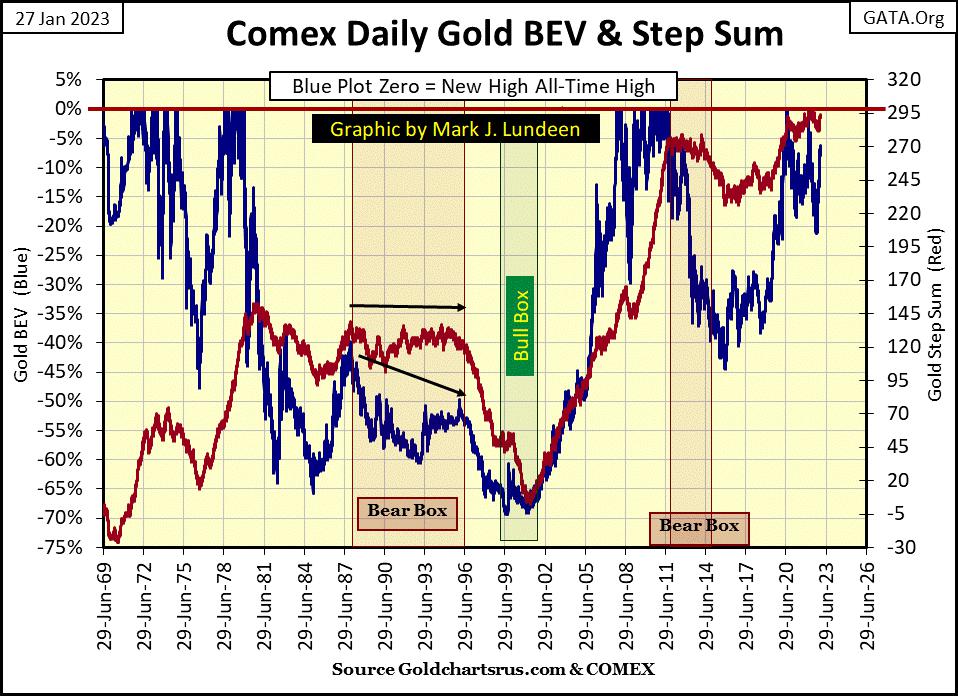
There is one more bear box in the chart above, one that lasted from August 2011 to May 2014. At the bottom of this bear market in December 2015, when both gold’s market expectations and reality bottomed, just before they turned up, market sentiment was bleak! But then it always is at the big bottoms, when market valuations become compelling.
This is the pattern for bear boxes;
The bulls in a bear market become stubborn, remaining in the market buying on market weakness resulting in the step sum to trend sideways.
Then market reality forces them to exit, where they begin selling on market strength, resulting in a collapse in market expectation, collapsing the step sum plot to recouple with the price plot.
At the bear market bottom, both plots; price and step sum, first bottom, then reverse upwards signaling its safe to come back into the market.
But bear boxes don’t always resolve themselves this way, as seen in the bear box for the Dow Jones during the sub-prime mortgage bear market. From its highs of October 2007, the Dow Jones would deflate by 53.78% at its March 2009 lows, making this bear market the second deepest Dow Jones bear market since 1885, exceeded only by the Great Depression’s 89% crash.
Now look at the Dow’s step sum during this bear market. From day #1 the step sum began decoupling from the price plot, and would not begin to collapse until a year later when the Dow Jones itself was down by over 40% from highs of October 2007. Those are some stubborn bulls to have continued buying on market weakness, for one entire year as the Dow Jones deflated by 40%!
Exactly when a box is closed is subjective. I close them when visually it seems appropriate. But what isn’t subjective is how many net down days the step sum below had from its top in September 2008 (1323) to its low in March 2009 (1300); only 23. So, the second deepest Dow Jones’ bear market decline since 1885 saw a collapse in market expectations of only a net of 23 down days during those six months? Something just isn’t right about that.
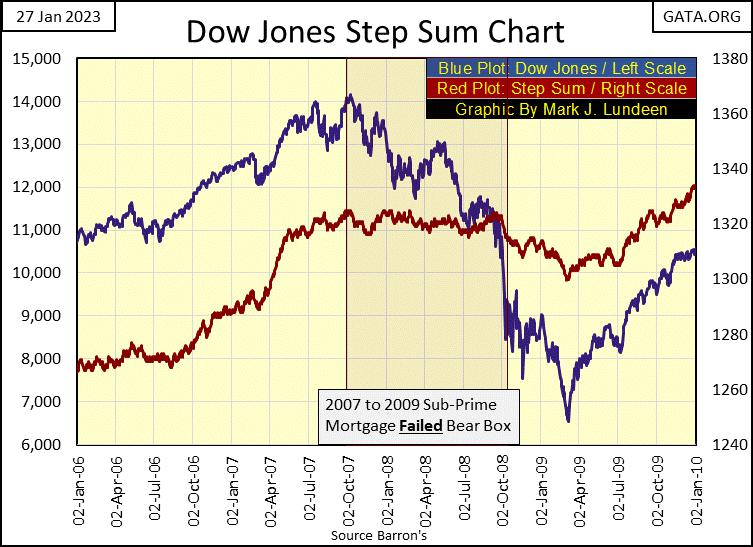
What kind of bulls are those? Market masochists who after a bad day asks Mr Bear “thank you sir, may I have another?” Now, I’m no “market expert”, but to my eyes, what is seen above from October 2007 to March 2009 is idiotic. Oh, now I get it; we’re looking at the idiot savants from the FOMC stabilizing market valuations in the bear box above.
The Dow Jones’ step sum collapsed by only 23 net down days in March 2009, because a bunch of idiots, using monetary inflation, were buying the market for an entire year, buying on the dips, preventing the collapse in the step sum.
When in October 2008 that proved to be insufficient, in a panic, Congress on live commercial-free TV gave the Federal Reserve “new tools”, including a monetary “bazooka” to “stabilize market valuations.”
The step sum bottomed with the Dow Jones on March 9th, as Doctor Bernanke stuck a big needle into the market, and “injected” his QE#1 into the financial system.
Both the Dow Jones, and its step sum once again began advancing, floating on a rising tide of monetary inflation. CNBC reported “green shoots” were to be seen in the economy as far as the eye could see, and once again all was right with the markets. That was until the next market panic hit the FOMC in March 2020, forcing the idiots to implement their massive Not QE-4 (chart below).
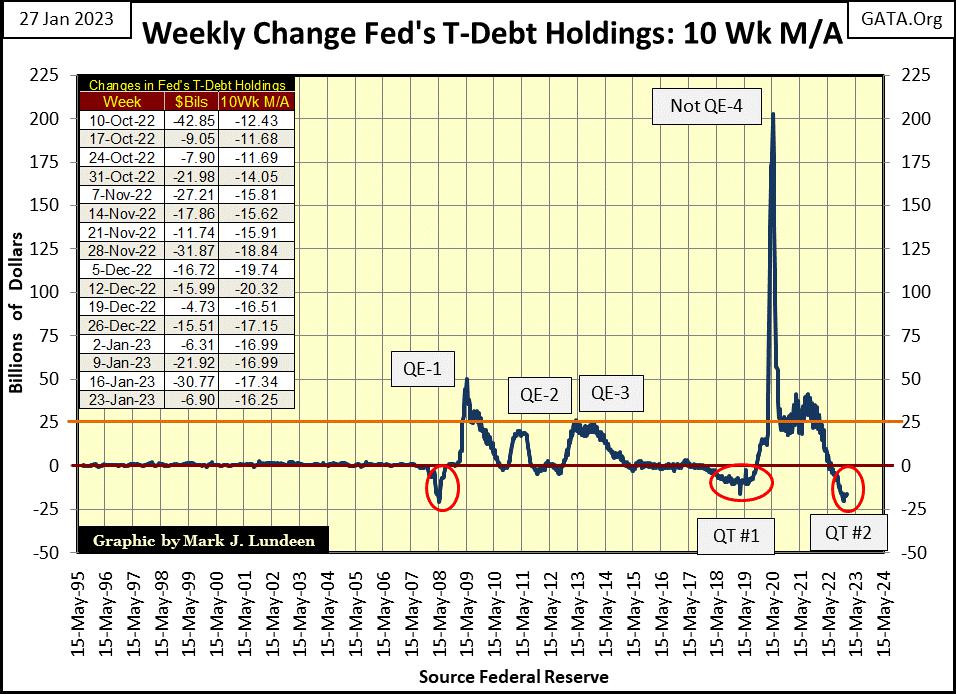
The market has big problems; it’s grossly overvalued, and the financial system is dangerously overleveraged. The QEs seen above are only quick fixes that ultimately solved none of the markets’ underlying fundamental problems of overvaluation and it being overleverage. Actually, these QEs only exacerbated these problems.
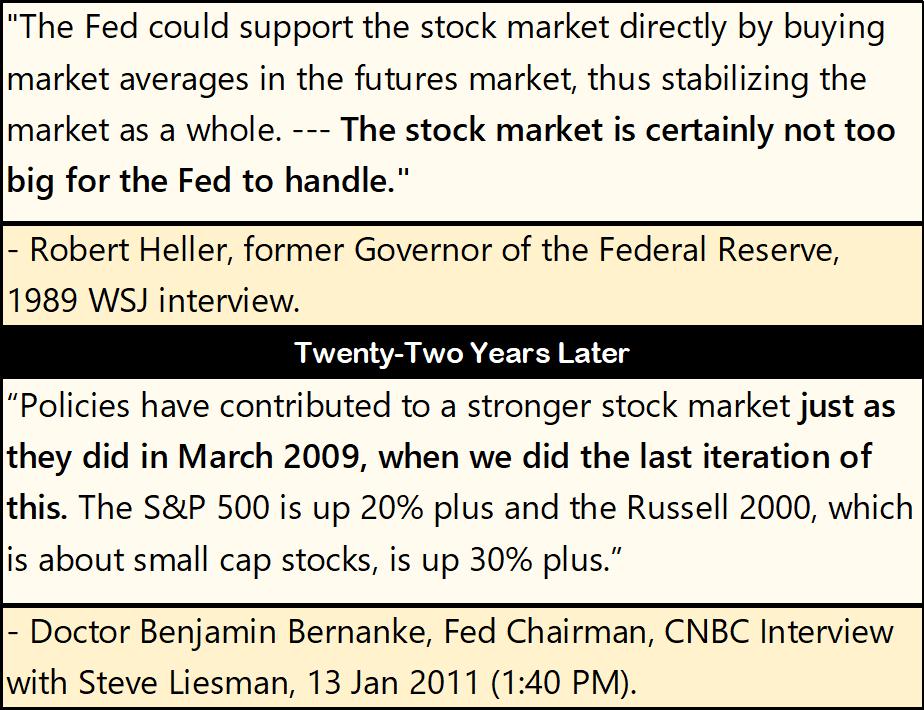
There comes a day when Mr Bear will prove Fed Governor Robert Heller wrong, that the Federal Reserve is bigger than the market. It’s not. I’m not looking forward to when “the big one” becomes my daily reality. But I’m happy that to the extent I can, I’ve shifted my wealth into precious metal assets, and now bet only beers and hotdogs on the market, up here in the peanut gallery. I sleep well at night for all of that.
Looking at gold’s BEV chart below, all I can say is Wow! Isn’t gold going to correct before it hits a new all-time high? Maybe not.

Looking at gold’s step sum table below, gold had a 15-count of +9, that of being extremely overbought, making it due for a sell off. It closed this week with a 15-count of +5, in the upper range of neutral. Can you see this selloff in gold’s BEV chart above? I can’t either!
Don’t get too excited, a selloff in gold is still likely. If for no other reason than the COMEX Goons don’t like it when people like you and me are happy with gold’s advancement. Still, I like what I see above and below in the gold market. With gold closing the week with only -6.44% BEV points between it and a new all-time high, that could happen in a matter of days or a week or two from now – knock on wood.
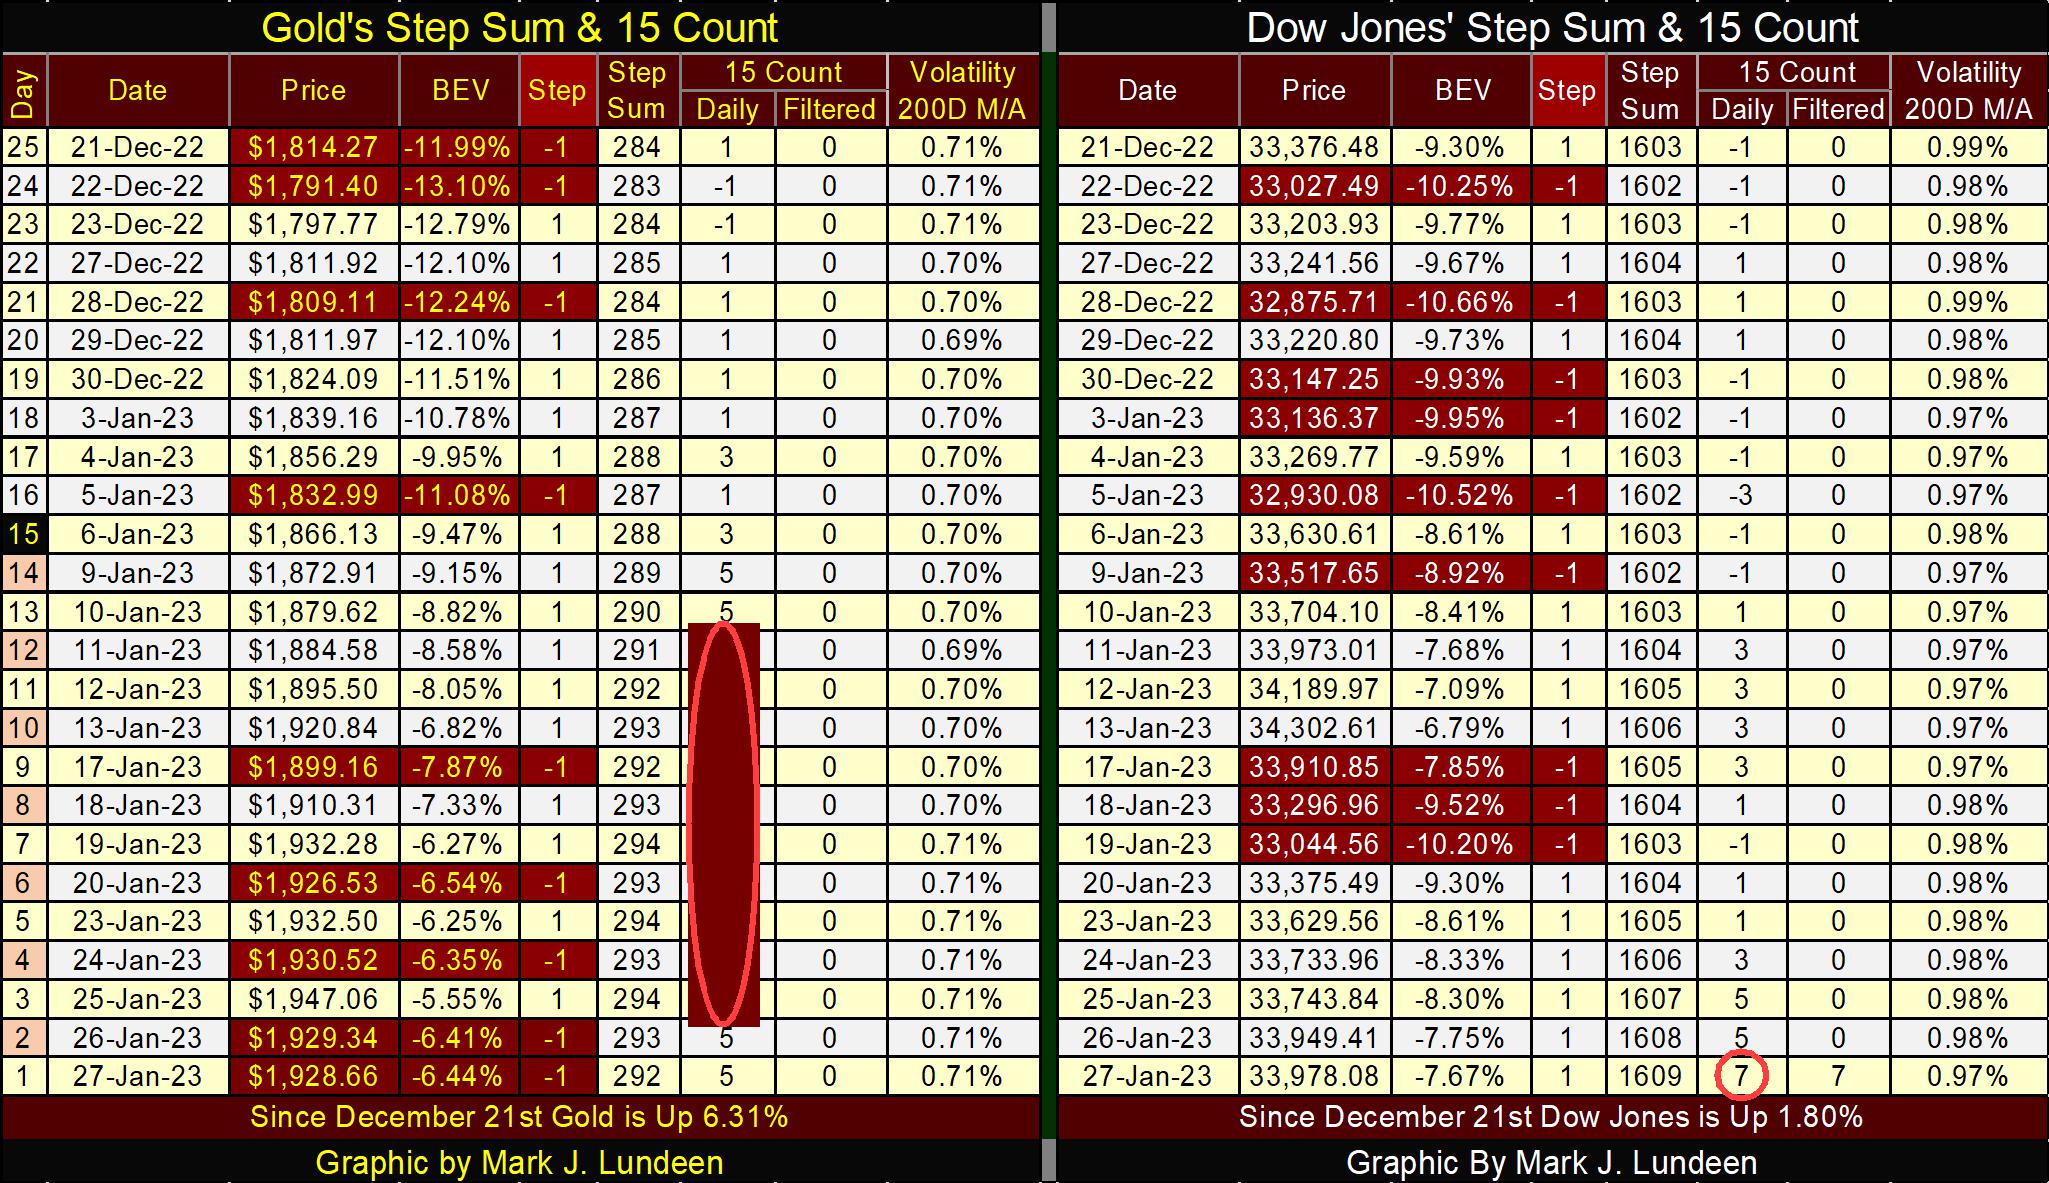
The Dow Jones closed the week with a 15-count of +7, it’s now overbought. Markets don’t like being overbought, making the Dow Jones vulnerable for a selloff from its current levels. That or it could, as gold did a few weeks ago, become extremely over bought with a 15-count of +9.
The thing to watch for now; is when the Dow Jones does see a selloff, does it go down easier than it went up in the table above. Seeing the Dow Jones up by only 1.80% since December 21st, as it became overbought with a 15-count of +7 is a lot of work for the little it gained. The bulls seem vulnerable here.
Mark J. Lundeen
*********


