Seeing Bull & Bear Markets With Dividends
Many interesting things are happening in the markets as we move into 2015. On Thursday this week the ECB announced an eighteen month, 1.1 trillion euro QE program. I had a good chuckle over this as I remembered how Europe’s central bankers introduced the euro as a currency in the late 1990s with the promise of a 15% backing in gold bullion. This was the ECB’s promise to the world that Europe’s new currency would not be subject to the same inflationary monetary policy plaguing the American dollar. As expected the ECB’s promise of a limited currency didn’t last long. If there’s one constant in the political-economic universe that we-the-people can depend on, it’s that promises and commitments made to us by bankers, politicians and academics managing government bureaucracies the world over will be broken as a matter of routine.
All big-bear markets have a theme as they are reality’s response to the monetary abuses which made possible the previous spectacular bull market. Today’s market reality is merely the repercussion of the incredibly stupid things the “policy makers” have done for decades in the market; rampant monetary inflation, the loosening of lending and accounting standards as well as corrupting official economic statistics to cover their bungling. Market regulation, too, has been a joke for decades. We-the-People didn’t care as market values, and our dreams of a comfortable retirement only seemed to grow grander. But we now live in world weighed down with a horrendous volume of unpayable debt. We are now approaching a world that will no longer allow this reckless expansion of market values. At the bottom of the coming bear market, all the promises and contracts made in bad faith will be exposed to the bright light of day and in the public’s consciousness.
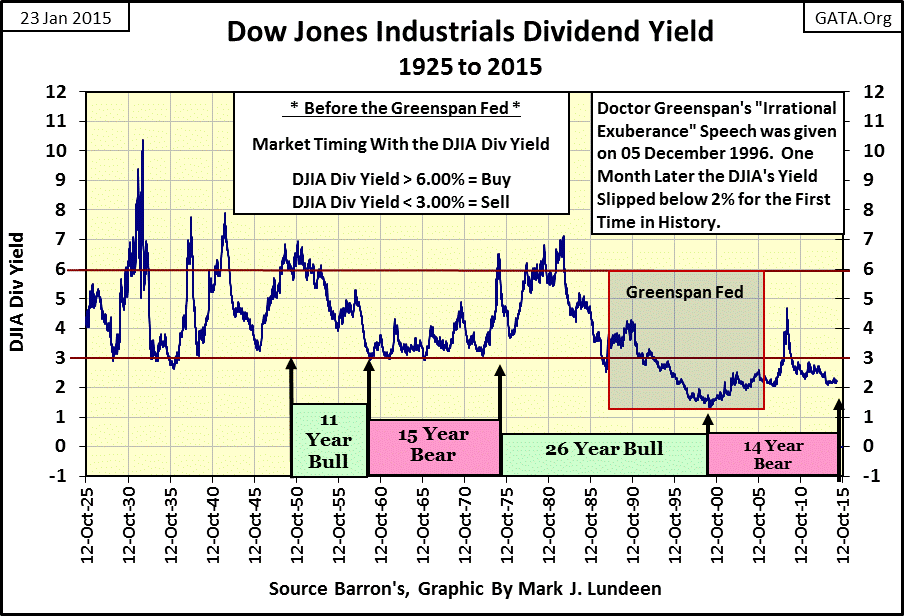
If I were to set a date when the free market was first flagrantly compromised, it would be August 1987 when Alan Greenspan became Fed Chairman. I’ll use the dividend yield of the Dow Jones to make my case. Before the Greenspan Fed, valuation trends in the stock market were measured by the dividend yield of blue-chip stocks. From 1925 through 1987, dividend yields could be used to find dependable entry and exit points in and out of the stock market. By simply staying out of the market, (sometimes for many years) until the Dow Jones’ dividend yield was once again over 6% (a Bear-Market Bottom), and exiting when the Dow’s dividend yield approached 3% (a Bull-Market Top). Astute investors raked in substantial gains following this simple rule. This system didn’t guarantee an investor would exit at absolute market tops, or enter the market at the absolute market bottoms. However for sixty two years (1925-1987) the result was superior long-term market performance.
This market rule-of-thumb worked remarkably well, until Alan Greenspan corrupted “monetary policy” to practice Bear-Market Interruptus during the crash of October 1987. In March 1987, the dividend for the Dow fell below 3% flashing a sell signal to informed market observers. After all, the Dow Jones had gained 186% since the summer of 1982; by March 1987 the stock market was due for a significant decline, which is exactly what happened in October 1987.
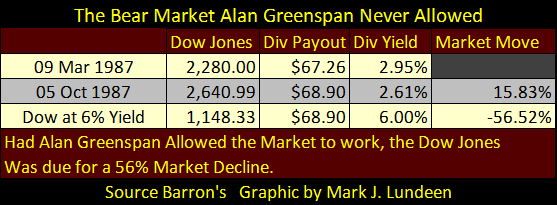
In October 1987, was Alan Greenspan aware of the implications of the data plotted above? Was his tenure at the Federal Reserve destined to be one of major market declines? I’m certain he was aware, and was determined not to be Fed Chairman presiding over a bear market! In the table below we see what would have happened had the Dow Jones been allowed to decline unhindered. With a dividend payout of $68.90 in October 1987, the valuation of the Dow Jones would have had to decline to 1,148 from 2,640, or 56.52% to raise its dividend yield up to 6%; the traditional buy signal.
The failure of the Dow Jones to yield a dividend of 6% or more since 1982 is proof that the stock market’s valuation has been managed/manipulated since October 1987, a scandal now running into its fourth decade.
Greenspan knew exactly what he was doing. It was no accident he gave his “irrational exuberance” speech just one month before the Dow Jones dividend yield declined below 2% for the first time in history. He made that speech to cover his butt (as he damn well knew he’d been inflating a bubble in the stock market). Before Greenspan, market valuations had increased and declined based on their own merit. While it was true that long before Greenspan the Federal Reserve had been managing what was then called “the business cycle”, investors’ decisions of what to buy and when to sell were still dominated by trends in sales and profits. After Greenspan, financial market valuations became intertwined with central-bank “policies” for QE and interest rates. The “market pros” at CNN Money know full well how to value today’s market assets:
“Thank you, Fed! Stocks have best day of 2014. The Federal Reserve is going to take its sweet time raising interest rates. And the market couldn't be happier.”
- CNN Money: Dec 17, 2014 4:26pm
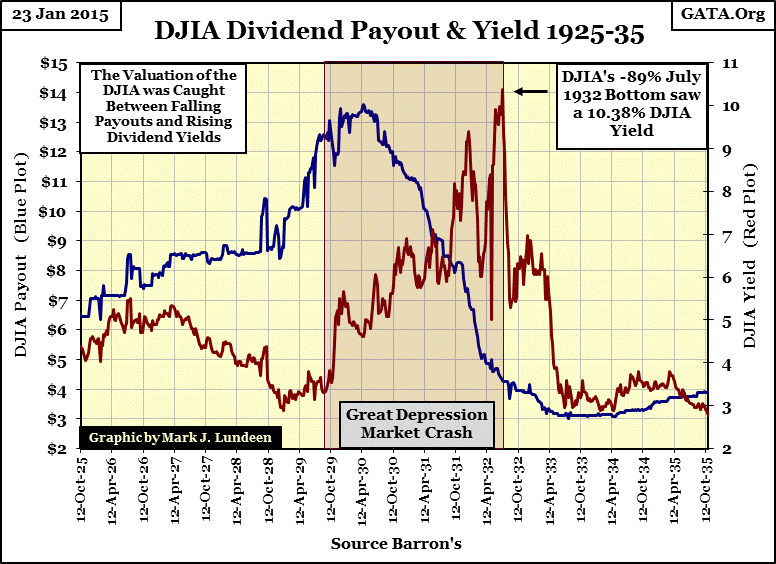
CNN Money may believe that the market is best left to the academics managing “monetary policy”, but being an old fogey, I don‘t. I see the day coming when the stock market will once again be valued on its own virtues and vices, (meaning dividends). The chart below plots the Dow Jones’ dividend cash payout (Blue Plot) and yield (Red Plot) for the Roaring 1920s and depressing early 1930s.
The Roaring 1920s bull market enjoyed rising payouts and falling yields. The Dow Jones dividend yield fell to 2.95% in Barron’s 24 December 1928 issue, signaling a market exit nine months prior to (and 30% away from) the Roaring 1920s’ September top. Note how the Dow Jones’ dividend cash payout continued rising (as did the Dow’s earnings) until April 1930, six months after the October/November 1929 crash. With the collapse in dividend payout in April 1930 the market resumed its historic bear market.
The chart above clearly illustrates why the Dow Jones’ valuation crashed 89% during the Great Depression (Red Box): Dividend payouts crashed 77% while the Dow Jones’ yield soared to an historic 10.38%. My concern with the current market is, just as “monetary policy” during the 1920s resulted in an historic market crash in the 1930s, I fear modern “monetary policy” has brought the economy (and stock market) to the brink of a similar situation today.
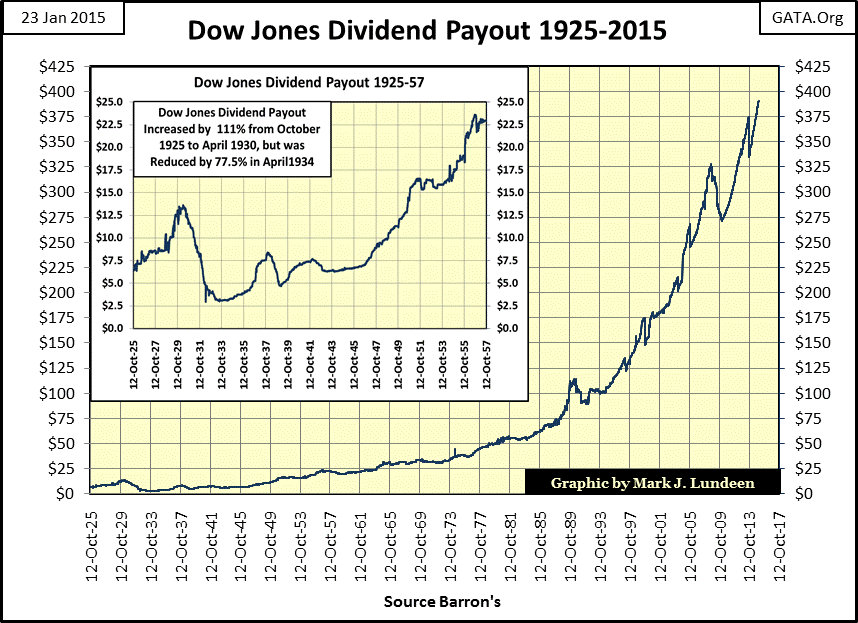
This next chart plots the Dow Jones dividend cash payout since 1925. In a world drowning in debt provided by central banks, the Dow Jones has somehow managed to increase its dividend payout to $390 in January 2015. But dividends are paid at the discretion of a company’s management, and should the economy turn down (and it will in the next two years) cash once used to pay shareholders their dividends will be diverted to service their massive bond obligations.
Bond yields (like dividend yields) are also near historic lows. Reasonable people understand that periods of low yield are followed by periods of high yield. And since today’s low yields are the result of irresponsible market manipulation by central banks, the rebound in interest rates when the market rig comes undone will redefine expectations of how high bond yields can go, and how far bond prices can go down. Historically, rising bond yields don’t foster bull markets in the stock market.
One thing about stock-market bulls is that they don’t care about single-digit dividend yields. And why should they when double-digit capital gains are to be had? But once a bull market passes its top, capital gains are soon replaced with ever growing capital losses. Mr Bear then takes control of the market pricing mechanism using a dividend model seen in the table below. From today’s lofty levels of dividend payouts and low yields, that isn’t good news.
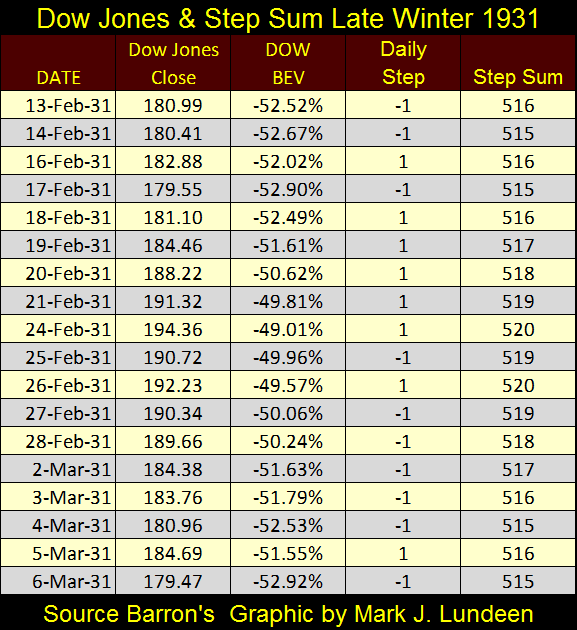
It’s not unlikely that in the next credit crisis the Dow Jones may see its dividend payout reduced to $200 as the Dow Jones dividend yield returns to 6% for the first time since 1982. These changes are well within the Dow Jones’ historical range of possibility, and would revalue the Dow Jones at 3,333 – an 81% crash in value from its current all-time high of 18,053. That may be a best case scenario for the next bear market as the Dow Jones payout could decline below $200, and see its yield increase towards double digits.
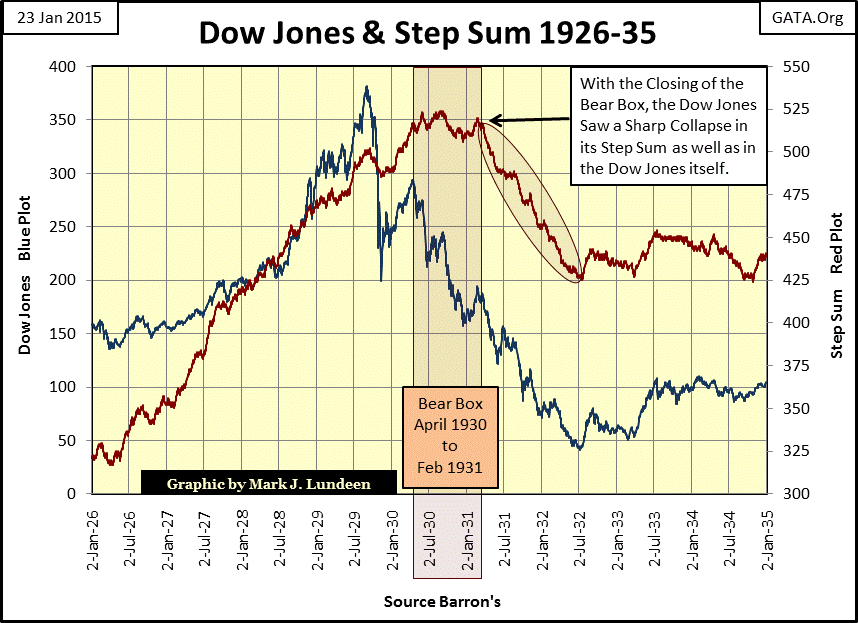
Let look at some step sum charts, first for the Dow Jones from 1926 to 1935. The Dow Jones’ step sum (Red Plot below) is a single item Advance-Decline Line using the Dow Jones daily closing price (Blue Plot). The step sum provides a unique insight on the market sentiment of the only people whose opinion really matter in any market – those who actively buy and sell every day. Below we see how the Dow Jones step sum faithfully tracked its price trend from January 1926 to April 1930. Then beginning in April 1930 the Dow Jones once again began to decline (as its dividend payout began collapsing), but this time its step sum refused to follow the Dow’s price trend down forming what I call a step sum bear box (Red Box).
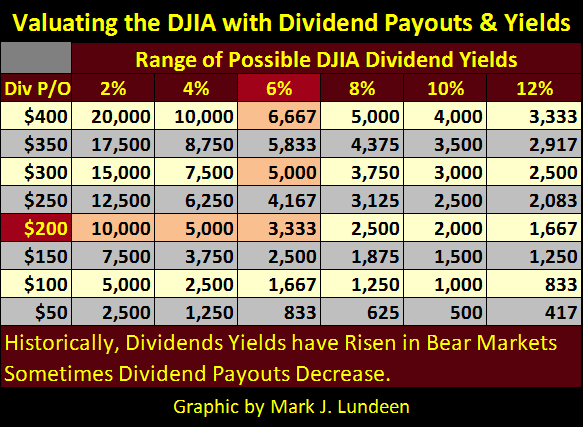
Here’s a table showing the construction of the above step sum plot in early 1931. In the table and chart above, we see with the Dow Jones already down over 50%, the step sum plot (bullish market sentiment) finally began its collapse (Red Oval above). But why then, a full eighteen months after the Great Depression bear market began?
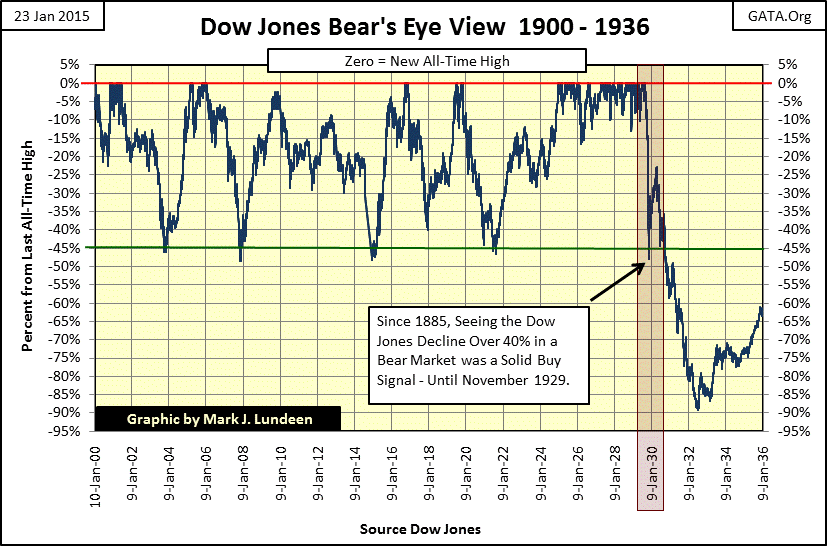
The answer to that question can be found in the Dow Jones BEV chart below. Since January 1900 the Dow Jones had experienced four declines greater than 45%, with each decline marking a profitable entry point back into a new bull market. In 1929, the initial decline for the Dow Jones (September to November) was in itself a 47.87% decline, from which the Dow Jones began a dead-cat bounce that from habit investors confused as a resumption of the 1920s bull market. However the bulls were wrong for almost a year, as seen in the market sentiment measured by the step sum plot in the bear box (chart above).
The above step sum chart (above) shows exactly when the market bulls finally understood that all hope of a return of the 1920s’ bull market was forlorn; with the collapse of the Dow Jones step sum plot in Feb/March 1931 (Red Oval above). From then until the Great Depression bear market found its ultimate bottom in July 1932, the Dow Jones’ step sum continued collapsing, a huge 100 net down days over a sixteen month period.
Bear boxes, while not rare, are not exactly common market events. Typically when they do occur, they usually form months or years * after * the start of the bear market, signaling the bulls have prematurely returned to the market before Mr Bear has finished taking out all the trash. Some months after the bear box began the bulls finally realize they’ve purchased stocks in a still declining bear market. It’s at this point the step-sum plot (market sentiment) resumes its decline as the bulls close out their losing positions with the bear market approaching its ultimate bottom.
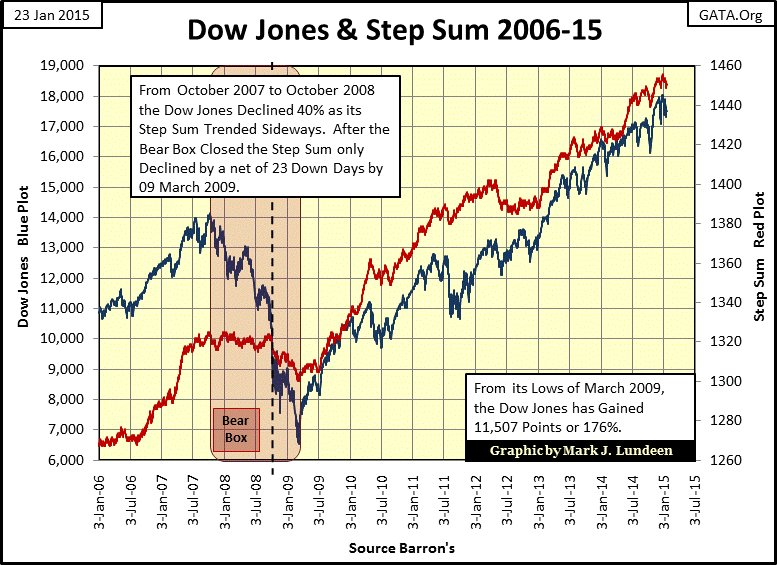
Mind you that step sum bear boxes don’t have to form during major market declines; frequently they don’t. But when they do form I have expectations how they should play out, which makes the Dow Jones bear box from October 2007 through October 2008 very unusual. First, its formation began at a market top (October 2007). Then, after lasting for twelve months (and a 40% decline in the Dow Jones), the bear box finally did close (dashed line) and the step sum began to collapse, but only by a pathetic 23 net down days at the 09 March 2009 bottom. Keep in mind that we are looking at the second deepest Dow Jones decline since 1885.
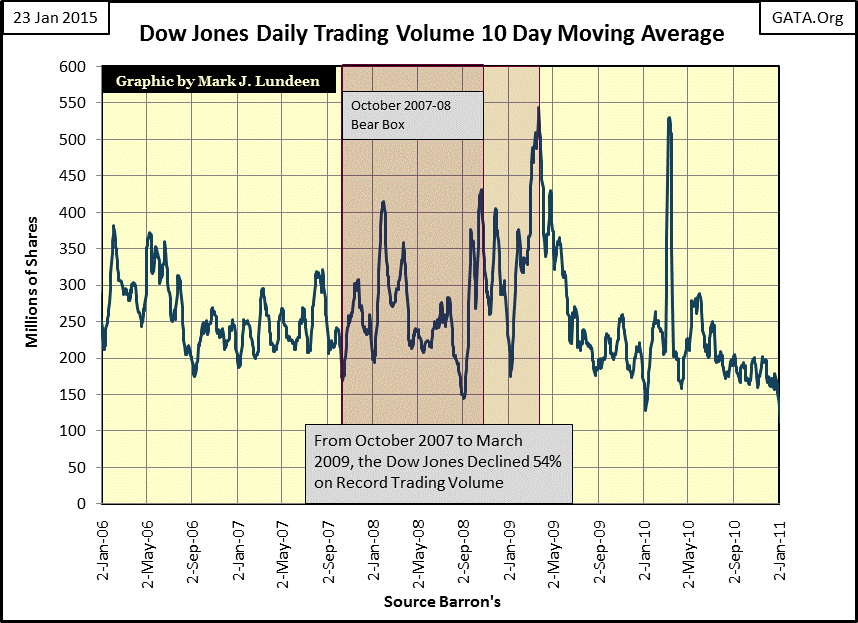
Below we can see what happened; the market bulls driving the Dow Jones step sum during the credit crisis crash were the Federal Reserve and the US Treasury, both institutions known for having deep pockets. Spokespeople for these bulls admitted as much on live TV (CNBC), no doubt to calm the panicking public during the largest market decline since the Great Depression. Incredibly the Dow Jones bottomed in March 2009 on record trading volume. This had never happened before.
Returning to the Dow’s step sum chart, without a doubt the bulls (bankers, politicians and academics) have had their way with the market since 2008. But we live in a different world today than the one six years ago where the bulls could push Mr Bear around in a bear box. One of these days Mr Bear will come back to do what he’s supposed to do – take out the trash from everyone’s balance sheet with a big bear market; and the bulls will prove incapable of stopping him. What that will look like with the Dow Jones’ step sum chart I can’t say, but I expect we’ll see another premature bear box forming at a market top, as happened in 2007. And when the bear box closes, the Dow Jones’ step sum will finally see a proper collapse into a bear-market bottom a lot deeper than the 54% decline we saw in 2009. But like me, you’ll just have to wait and see what actually happens.


