Sell In May . . .


Last week was ‘A waiting game’ – now ‘Sell in May and go away’ - the annual ritual of the markets going quiet as summer begins to set in is in control again, with two weeks still to go before June brings the early heat of summer to most US markets.. Markets holding to the annual doldrums unfortunately do not give much material to write about nor, probably, much incentive for people to read what do gets written.
To go somewhat off topic during the quiet season, but still with possible, if probably unlikely to be soon, effect on the markets, the one place where there is some action building up in this month of May is in Yellowstone park. YouTube is filled with clips of dire prognostications of what will happen there perhaps by next week, if not by the end of summer – and what the consequences will be for the US and the globe. Mary Greeley seems to be the most level headed commentator on the state of the super volcano bubbling below the surface and no longer as deep below as it had been a year or three ago, but not yet fully as active in terms of quakes and some other events as it had been in the past.
Some video clips that did cause me to wonder about the true state of what is really happening, were from a park camera mounted on a tree near Old Faithful. While there was no measurable wind, the horizon in the view of the camera was visibly and quite rapidly moving up and down as a consequence of ground movements. That, and also the fact it seems that the Geological Service only report some of the earthquakes that can be seen on seismic charts that are publicly available. Makes one wonder whether manipulating official reports extends beyond what has become accepted as a norm in the financial and economic sectors. Of course, if officialdom deems it necessary to conceal possibly vital information, it is wise to wonder what the real state of affairs in the markets and in Yellowstone might be.
If some recent trends can be projected through to the end of May and into June, it seems that the price of crude could be set to extend further above $70/bbl, with a knock on effect on inflation even though the price changes of energy are excluded from the official CPI. Supposedly because prices of energy and food are too volatile, but I wonder whether it is not because prices of food and energy are not as easily subjected to hedonic adjustments that reduce the official rate of inflation as can be done with, say, the price of a motor car.
Offer fresh colours on the new model and seats of a new material that more easily absorb perspiration and it is thought the buyer will be happy to pay $1500 more than for the current model. After discounting the increase in price sufficiently to compensate for these improvements, the disinflationary effect of the new model reduces the new CPI rather than increasing it. On the other hand, it is not easy to say that this season’s tomatoes or green beans taste more juicy than last season’s crop and so the increase in price can be hedonically discounted to reduce the CPI.
The yield on the US 10 year Treasury again closed above the 3% level one day last week. The trend has been rising for quite some time in step with Fed talk of higher rates. It rallied steeply just as it broke above 3% in February, reaching as low as 2.73% before spiking higher to reach 3.03% before settling around the 3% level.
This seems to be a rear guard action, and probably not the only one of its kind, to postpone what appears to be inevitable; much higher rates in the not too distant future. Then to cause significant havoc in US markets where people who remember rates above 5% are now probably at least middle aged. The longer the yield is kept below 3%, the bigger will be the shock for the market when it finally breaks free to spike much higher to make up for lost time.
More commentators on the economy are getting highly concerned about the high levels of debt in all sectors – Federal, corporate and households – and warn of very difficult times ahead when higher rates make it no longer easy or cheap to roll over or make new debt. It is a trend I have seen as high risk for quite some time, and in particular for households that – as discussed in a recent US markets, with credit to Dave of Denver who published a chart that shows 80% of US households had a decline of up to 29% in net wealth during the period from 2007 to 2016.
That horrifying statistic I believe reflects that too many households have to rely on credit to survive, until they are compelled to go on government assistance. This is a trend that cannot end well for the US.
Euro-Dollar
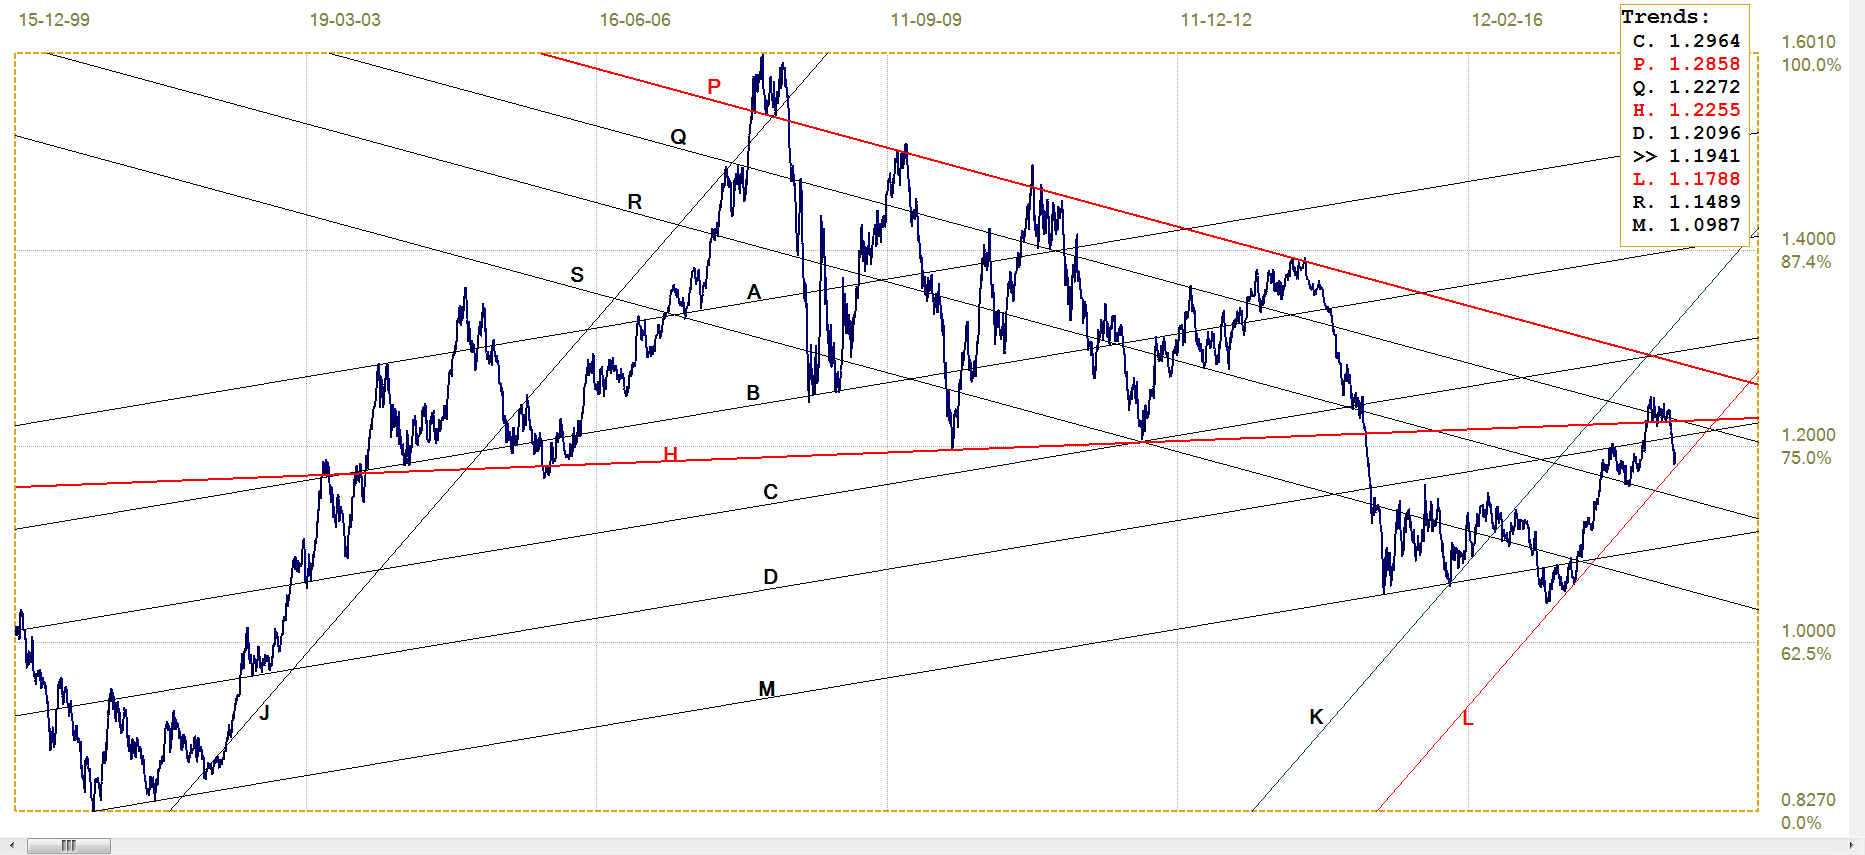
Euro-dollar, last = $1.1941 (www.investing.com)
Finally, two weeks ago the dollar at last found direction out of its sideways trend to turn bullish. The euro broke lower out of its tight consolidation, to below horizontal support along line H ($1.2255) At first the euro tried to hold at the support at line D ($1.2096), but that support soon failed with the euro extending the steep fall to end at the bottom of bull channel KL $1.1788) on Friday – as was mentioned last week, “Technically the odds now favour a test of support at the bottom of euro bull channel KL”.
The week ahead is therefore quite important for the future of the euro. If the new support can hold to trigger a reversal higher, with the euro remaining in channel KL, the outlook will be bullish again. A break below the channel will be bearish for at least the medium term.
DJIA
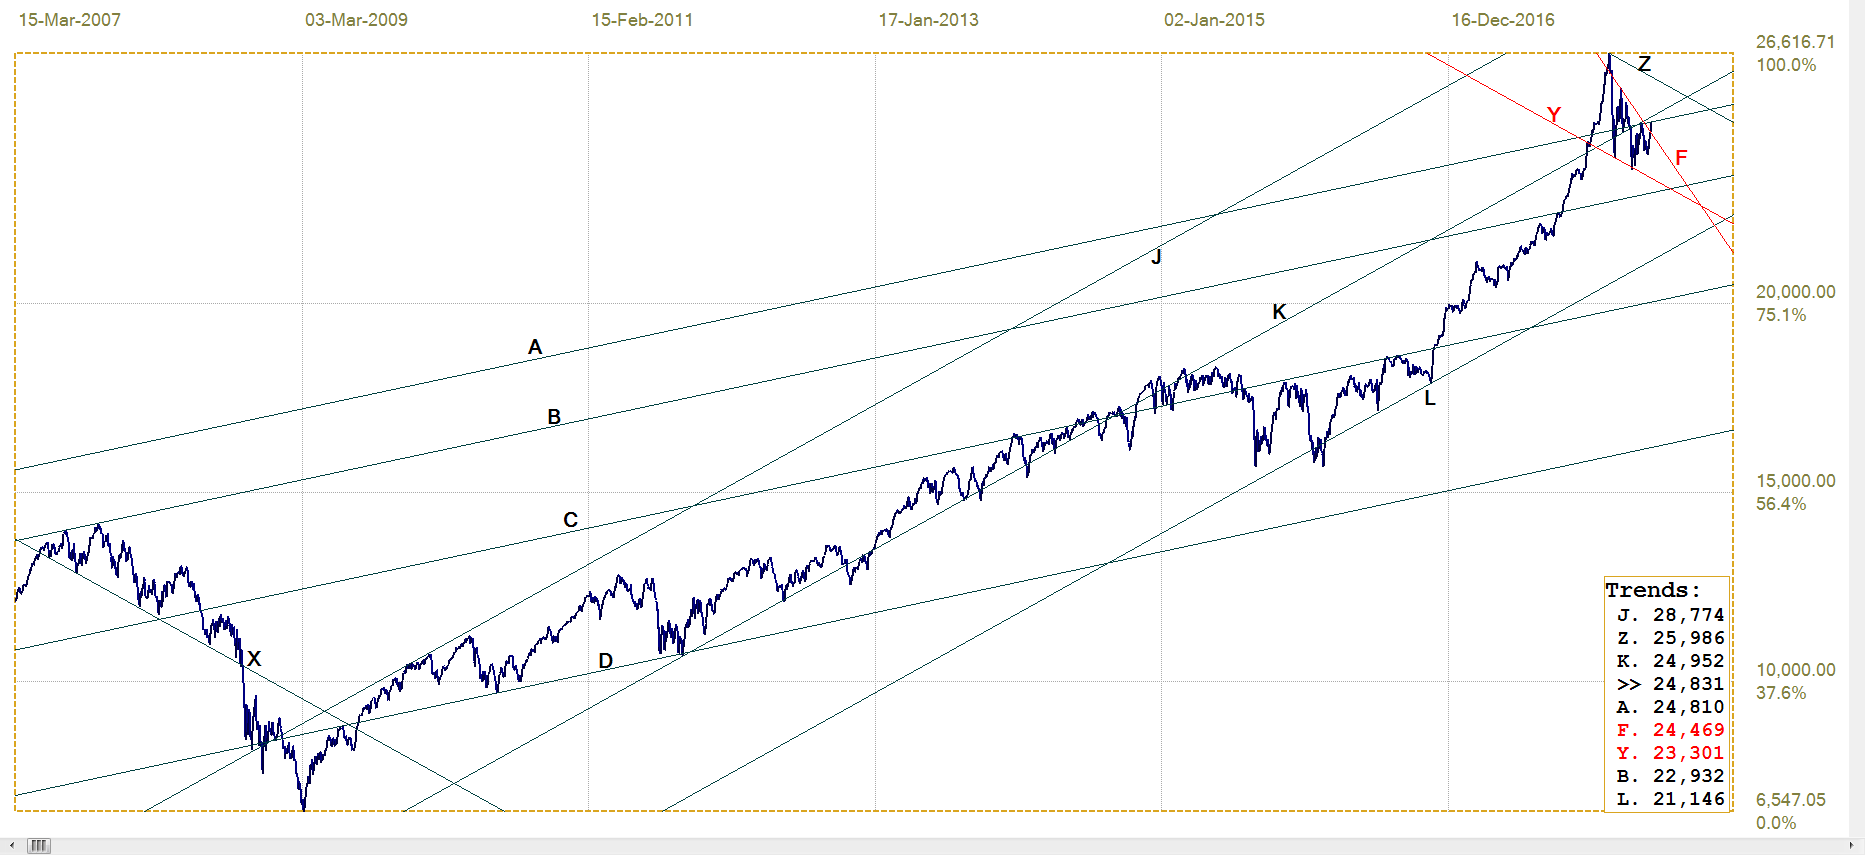
DJIA, last = 24831.17
Following the break higher from the lower band of steep bull channel JKL into the upper band JK (24 952) and making the new all time high, the DJIA turned bearish and broke back into the lower band of the channel KL (21 146). The descending move that also broke below line A (24 952), developed within the pennant YF (24 469), completing five moves from side to side as usually happens, and has now broken above the pennant while on leg 6. Traditionally, this is a bullish signal. First confirmation of the new trend will be by a break clear above line A (24 810) and also clear above channel KL.
Gold PM fix - Dollars
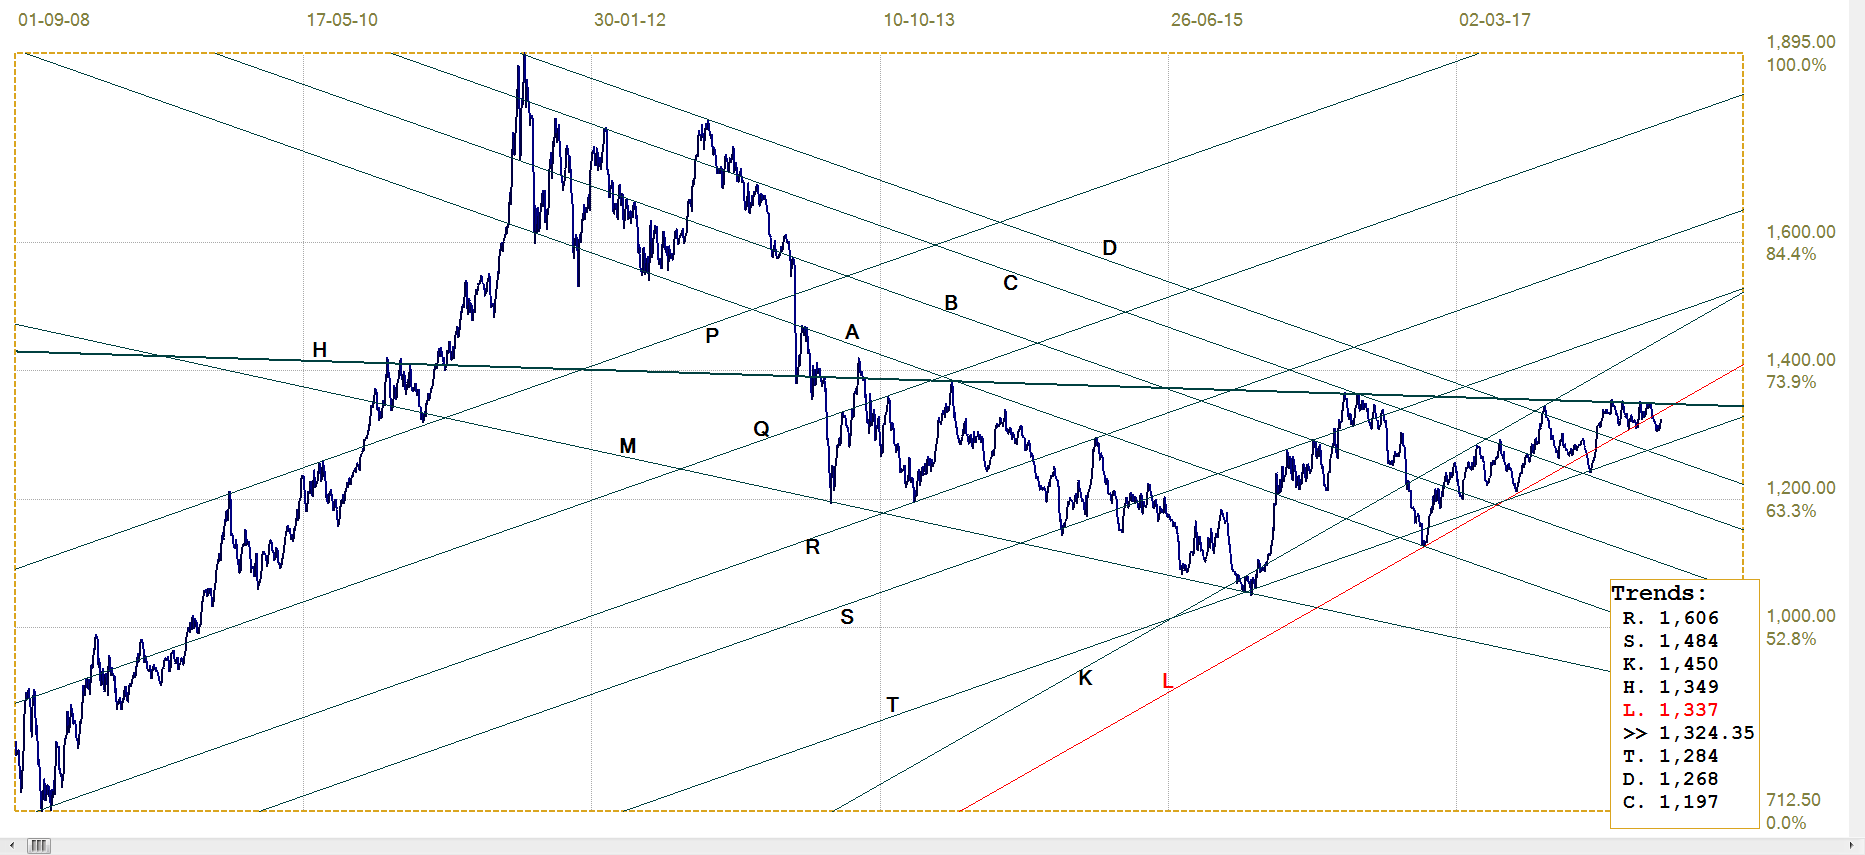
Gold price – London PM fix, last = $1324,35 (www.kitco.com )
The new break below bull channel KL ($133&) could be expected to retreat to the support along line T ($1284) since the bottom of the shallower bull channel ST has recently acted in that role with some success. The move higher is much too little to cause any excitement, but we can thank small favours that the price is not dipping lower to test the psychological support of $1300 or breaking even lower to line T.
As the price of silver closed the week well clear of the barrier at $13.50 holding quite well after a London fix at $16.76, perhaps gold can be the one to play follow my leader this time around.
Euro-gold PM Fix
A stronger euro while the price of gold languished in a quite narrow band above the $1300 level had the euro price of gold briefly breaking below the bottom of channel ST (€1082), but then clinging to the bottom of the steeper bull channel KL( €1106) even not always holding within the channel. Creeping slowly higher as the price of gold itself crept away from $1300, the euro price of gold finally managed last week to just break marginally above bear channel YZ, (€1103). Whether the break will hold, should be answered this week; as the dollar is showing some early signs of weakness, it will depend on how the euro and the price of gold reacts.
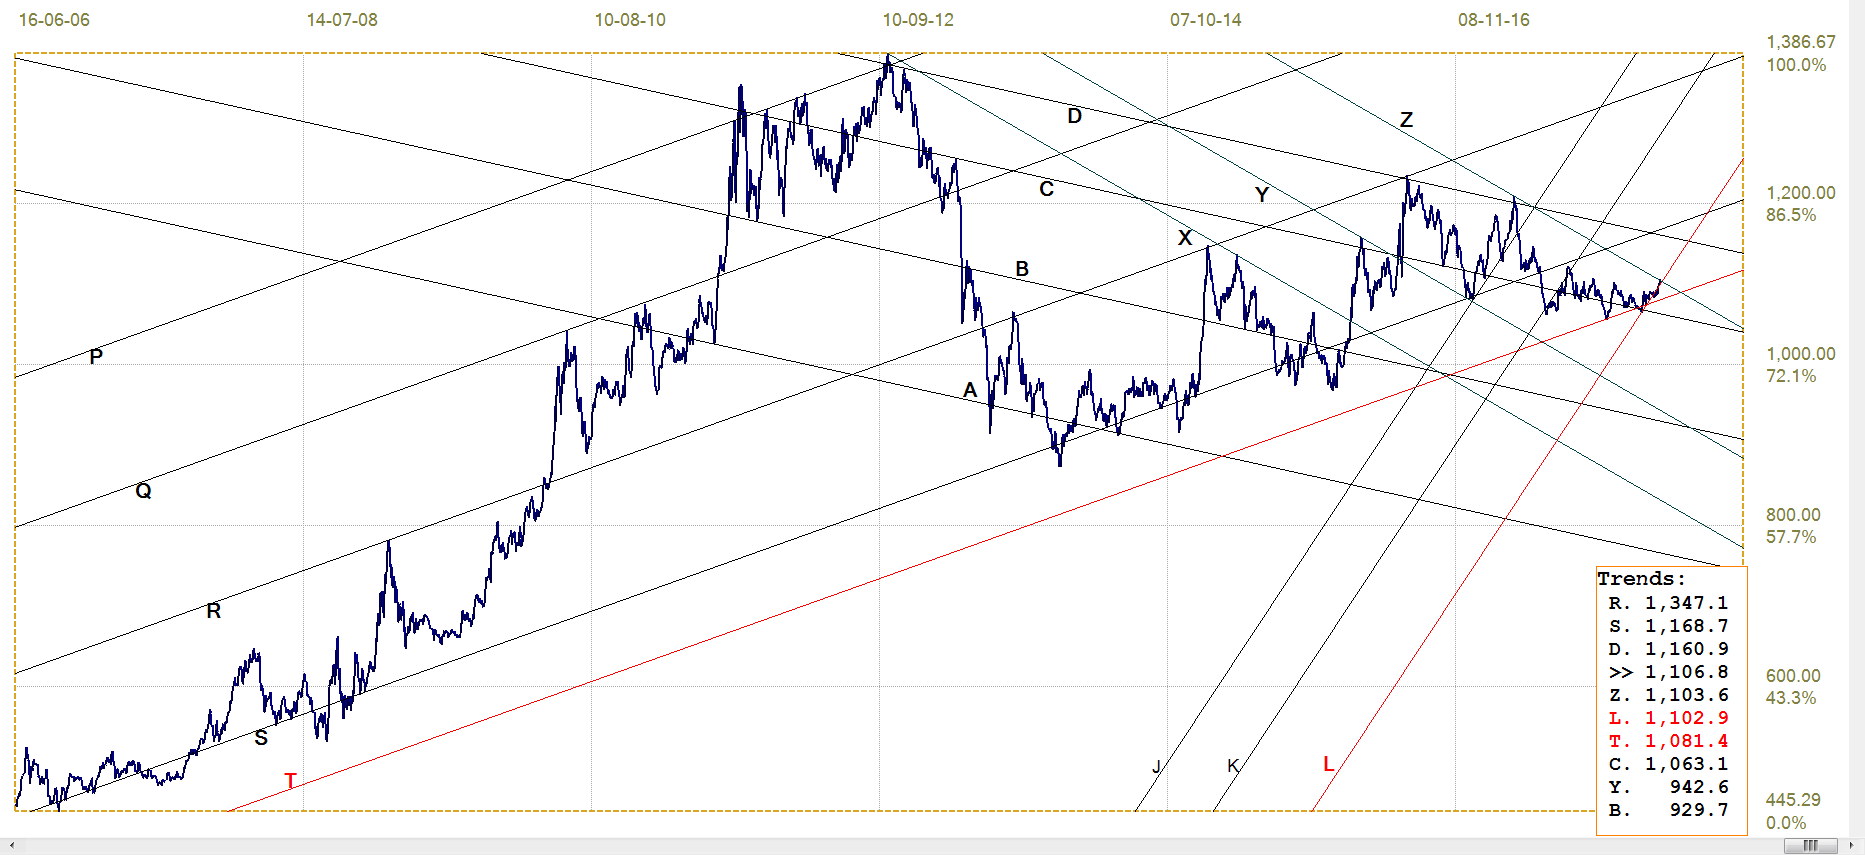
Euro gold price – PM fix in Euro, last = €1106.8 (www.kitco.com)
Silver Daily London Fix
Silver daily London fix, last = $16.76 (www.kitco.com)
In mid-April, the silver London fix was set marginally above the resistance of line C ($16.87) and also well above $17.00, to give a blast of hope that the price was in the process of breaking free from the suppression – to some degree, at least. This was not to be, and the fix soon returned below $17.00, back below line C and also below line L ($16.60), being fixed at a new recent low at $16.25 early in May.
Since then the game around $16.50 resumed, but ending last week with a sudden and clear break above that level to be fixed at $16.76 on Friday – which, in order to be prudent and with good awareness how spikes and usually treated, should not be taken as a sign the silver bull has been released – at least, but not until silver can again break clear of line C and prove that it can extend the break much higher.
U.S. 10-year Treasury Note
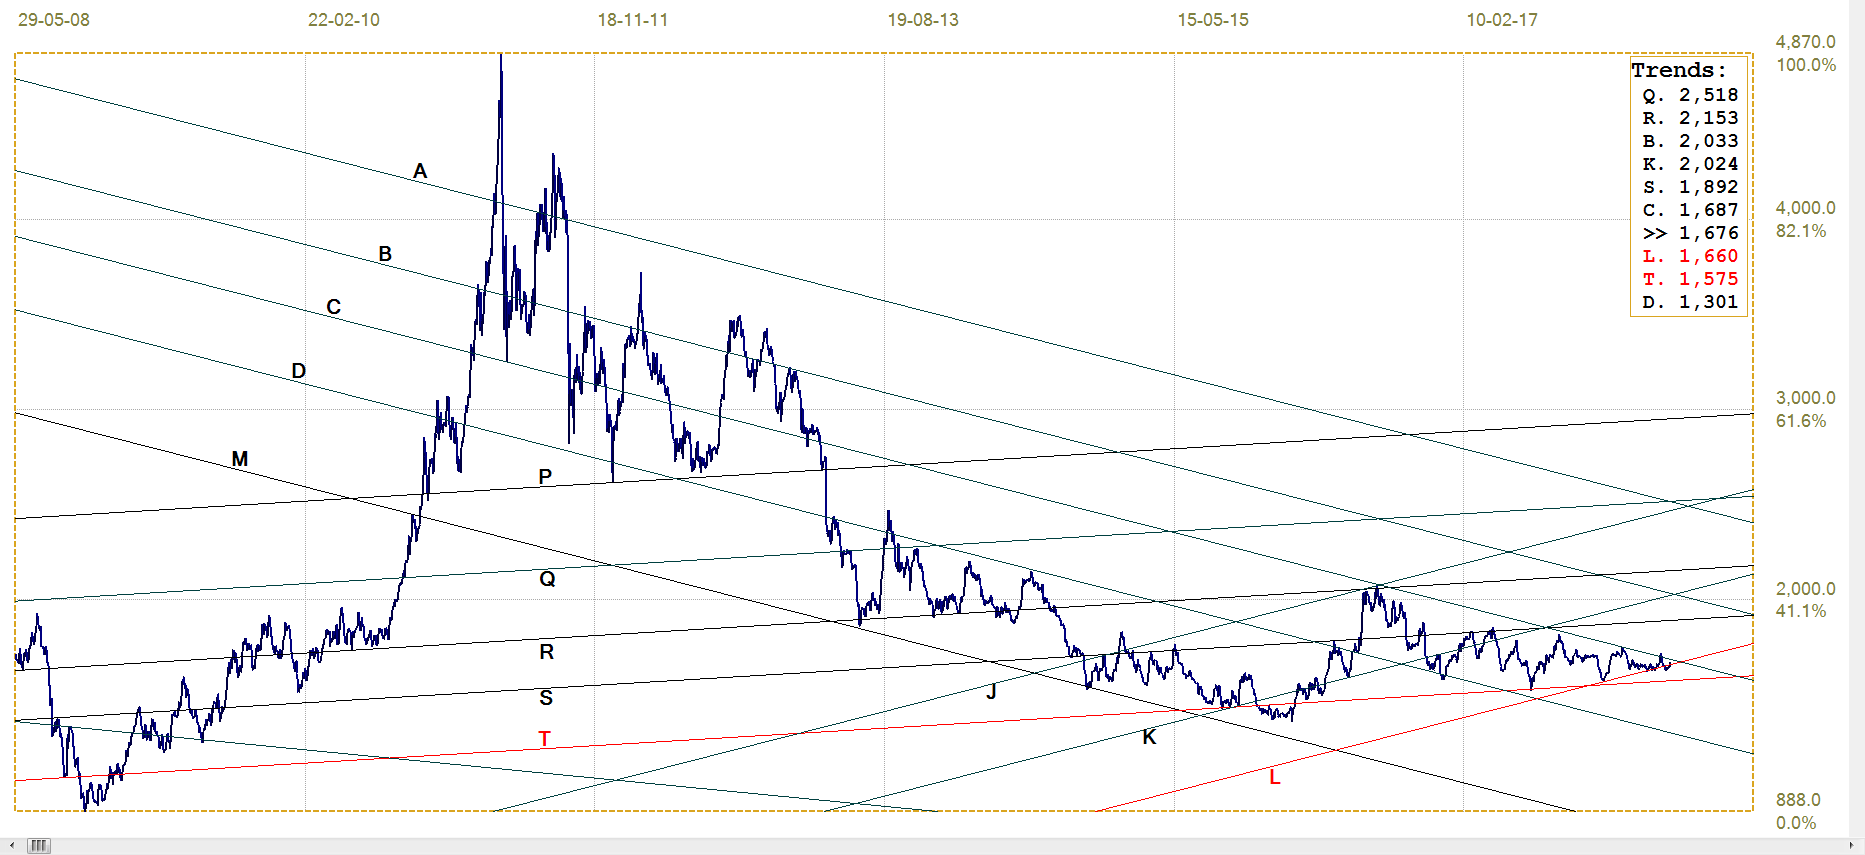
U.S. 10-year Treasury note, last = 2.970% (www.investing.com )
There are clear signs that there is a battle going on to keep the yield on th3e US 10-year Treasury note below 3%. That battle can be expected to intensify should the dollar reverse lower out of its recent rally and also turn bearish. However, as a comment in the introduction noted, this battle at 3% can be no more than a rear guard action in a war that is effectively already lost, given that the Fed has clearly stated itself committed to raising interest rates further.
The authorities must be watching the price of the Treasuries in other currencies – as influenced by their dollar exchange rate – very closely indeed. It would not do to have investors from through those currencies finding reason to close their positions and bank any profits they are making while there are still profits. There however, it seems, very little the authorities can do to avert such disinvestment and the effect this will have on the yield and the exchange rate.
West Texas Intermediate crude. Daily close
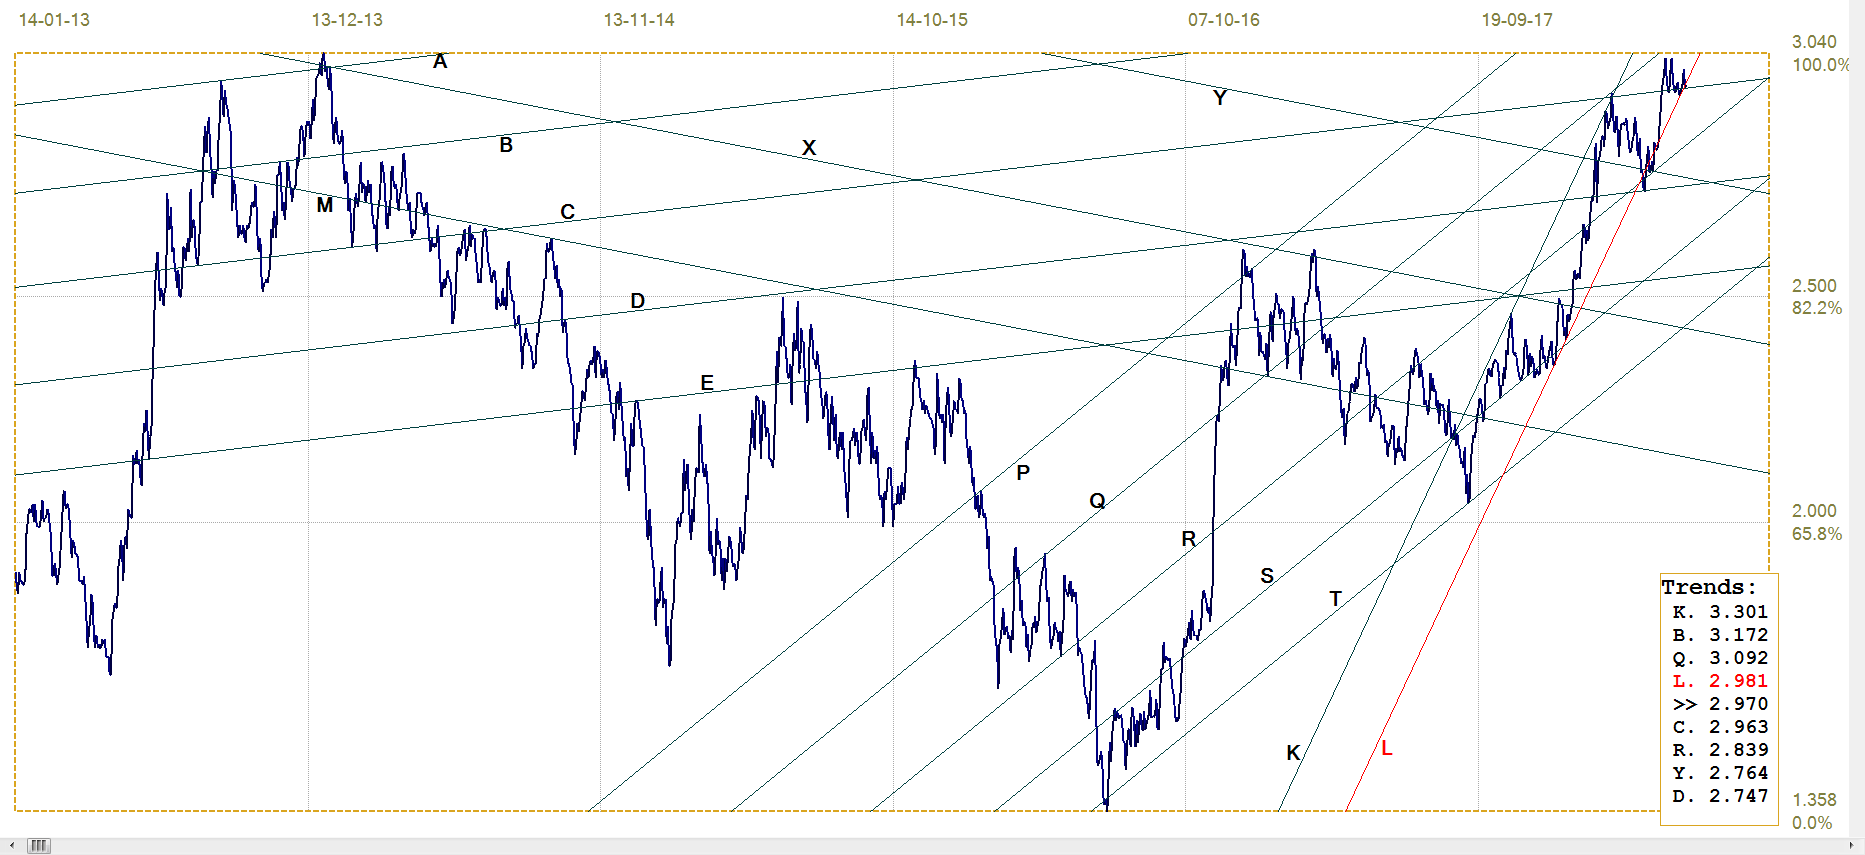
WTI crude – Daily close, last = $70.52 (www.investing.com )
The break above resistance at line W ($69.04) three weeks ago has not resulted in a spike higher, but a steady if slow improvement – so far. Higher prices for crude is one of only a number of factors that at placing pressure on the US economy and specifically on the ability of the consumer to put a spark into the economy.
More expensive crude will not only be felt at the gas pump, but will leaven an effect right through all aspects of the economy and the overall effect will be inflationary, even while food and energy are excluded from the widely used official CPI.
********


