Sell In May And Go Away!


Current Position of the Market
SPX: Long-term trend – The bull market is still intact.
Intermediate trend – Are long-term cycles sketching an important top?
Analysis of the short-term trend is done on a daily basis with the help of hourly charts. They are important adjuncts to the analysis of daily and weekly charts which ultimately indicate the course of longer market trends.
Last Hurrah – Take 2
Market Overview
Since you’ve heard this admonition so many times before, I am taking the risk that you will start snoring when you read my heading, but please don’t! This year appears to be shaping up as one when this old saw should be especially heeded.
Eric Hadik, who is much more than your average cycle analyst, is warning that we are in a time frame when several important cycles are topping. I have been warning of the 7-year cycle nearing completion of its topping phase, as demonstrated by the market which is forming a rounding top. He discusses it also, but does not stop there! To it, he adds the 40-yr, 17-yr, the 66-wk and the 32-wk, all converging around mid-May 2015.
If you have an active interest in the stock market, this should keep you awake! Furthermore, his warning is substantiated by the ending triangle that the market has been forming over the past few weeks as the fifth wave (from October 2014) of the move which started in October 2011 and which would most likely turn out to be the top of primary wave III.
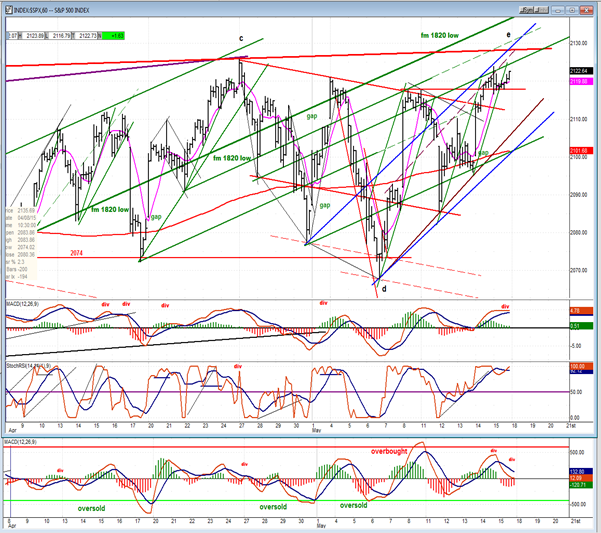
Triangles consist of five waves: a-b-c-d-e. This looks like an ending triangle, currently finishing its fifth wave (e). It is now a question of whether that wave ended on Friday at the close, or if it will do so early next week either at 2123/2124, or 2127/2128. These projections result from the sideways pattern formed by SPX on Friday which could be a small re-accumulation phase.
Should this analysis be correct, an intermediate downtrend could start as early as Monday! It would not be correct if there is a resurgence of buying which sends the index soaring decisively past 2131.
Indicators Survey
The weekly and daily MACDs are still positive, but showing pronounced deceleration in the form of negative divergence. I suspect that at the start of an intermediate downtrend, they would immediately go negative and this is what we need to look for.
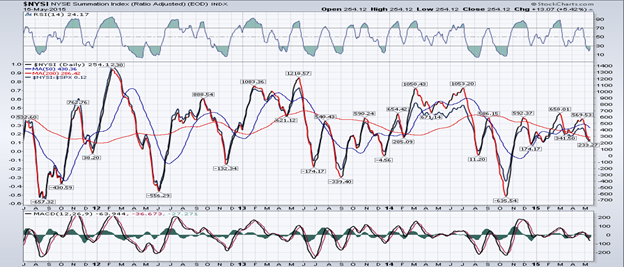
The Summation Index (next two charts courtesy of StockChart.com) continues to lose ground even when the SPX is closing at an all-time high. The implication is obvious and saying anything more would be repetitive.
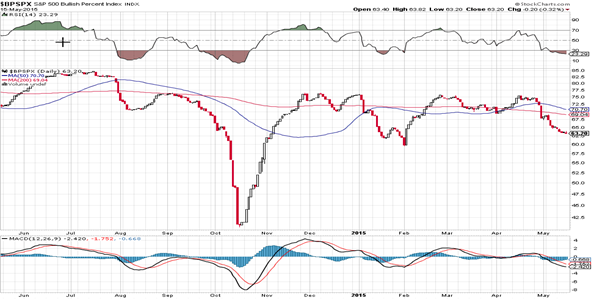
This next indicator, the Bullish Percent Index, appears to excel at showing the distribution which occurs in the market prior to a decline. The BPSPX has been declining for the past month while the SPX has climbed to a new high. Note that in January, it declined for two weeks in anticipation of the decline into the early February low. Even more prescient was the move which started in August and foresaw the October weakness. It is clearly flashing red right now.
On Friday, the lateral move by the SPX created a small ledge on the 1X P&F chart which could turn out to be bullish with a potential count up to about 1227/28.
The 3X price chart continues to form a rounding top, as does the bar chart.
Chart Analysis
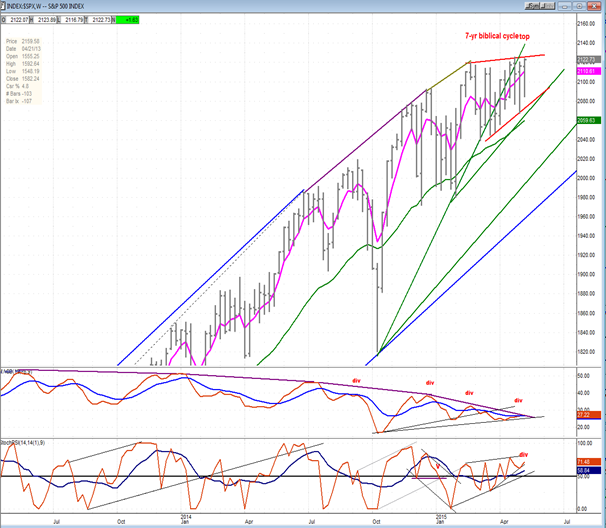
Let’s start with our analysis of the weekly chart of the SPX (courtesy of QCharts.com, as well as others below). I am only showing the phase from the October low that represents the 5th wave of the move from October 2011 and which appears to be completing an ending triangle pattern.
I have connected various tops with different colored lines to show the deceleration process which has taken place in this index. It was fairly mild until the rally from October was over, and after which it increased substantially. During the past three months the highs have created a flat pattern, while the lows continued to bottom at higher and higher levels. This has resulted in the ending triangle pattern which is outlined in red. Of course, it is possible that the index will continue to trade within the pattern for some time, but stock market history suggests that when this type of formation is complete, it is followed by a sharp drop which normally reaches its starting point. The EW Theory has certain rules guiding this type of pattern which will be discussed further when we analyze the daily and hourly charts.
The deceleration process is much more evident in the weekly MACD, and even the SRSI is making an ascending triangle pattern which is rare for this index. Also, note the negative divergence which formed on Friday in the latter.
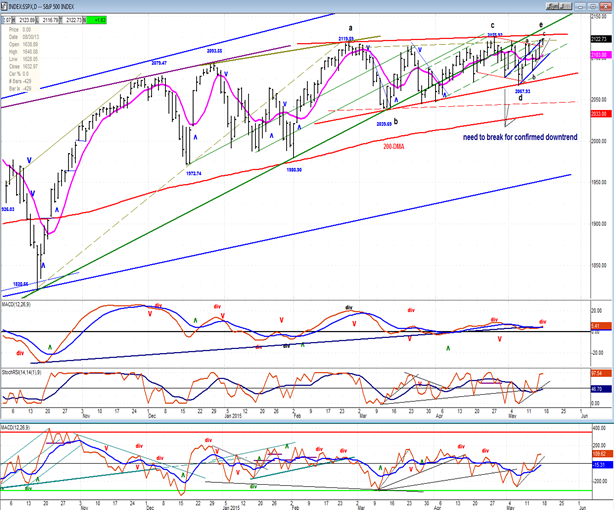
The daily chart shows the labeling given to the triangle by Tony Caldaro whose expertise in EW matters is considerably greater than mine. He points out that in a diagonal triangle, the five waves tend to have a Fibonnaci relationship to one another and that in this case, wave “e” should have gone to 2121 before ending. Since it went slightly higher to 2124, the move could have ended on Friday, with confirmation coming on Monday. (See under “Indicators Survey”, above, for another potential projection).
The indicators show the MACD in a weak position with negative divergence, while the SRSI and A/D reflect the advance of the past week and are neutral. The price is limited on the upside by two short-term trend lines (although it may try to back-test the green trend line), and it would have to break below the lower blue trend line to start a correction with a follow-through breach of the lower triangle line, as well as a former support level and the 200 DMA to really confirm that an important correction has started.
The hourly chart shows that the “e” wave is already very advanced in time and price, and could very well have ended at Friday’s opening with a small climactic move which seems to be a standard way of ending short-term uptrends. There are actually more than two trend lines providing resistance at this level, and a display of enough strength for a back-test of the trend line from the 1820 low would concern me that the ending triangle was evolving into a new uptrend. In addition, two clear channels have formed with the price reaching both in the first hour on Friday and being pushed back immediately. Going through these top channel lines would also be a warning that the ending triangle scenario was evolving into some other pattern.
Although it rallied at the close, the index was not able to get back up to the high of the first hour. In analyzing price structure and behavior we find evidence suggesting that the “e” wave may have ended on Friday, but we won‘t know for sure until Monday.
The indicators are in a good position to roll over with divergence showing in the MACD and notable weakness in the A/Ds.
Among the leading indicators discussed in previous articles, nothing really stood out as a change of behavior or price relationship to SPX. All seem to be mimicking that index’s trendless pattern. VIX continues to trade in a very tight range. IWM is retaining its relative weakness to the SPX. QQQ, in spite of its price gain remains below its former high.
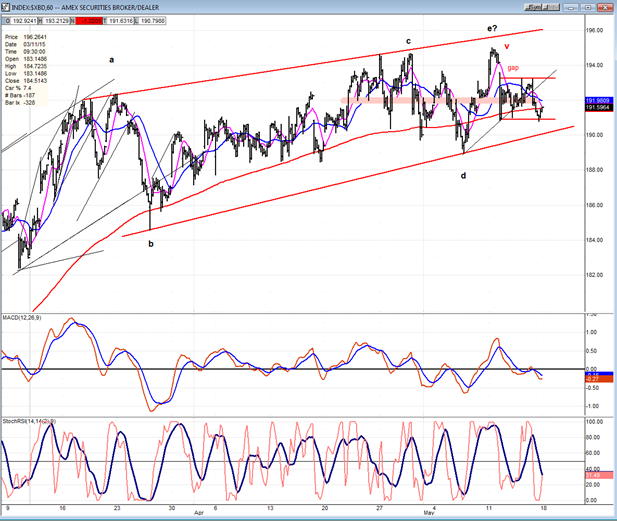
However, XBD (AMEX Securities Broker/Dealer) in particular has caught my attention. Since late March, XBD has formed what appears to be a distribution pattern which alreardy measures about 30 points across. This is only the tail end of a pattern which started at the March high and which has the potential of being an ending formation. I have labeled it similarly to SPX with one very important difference: the “e” wave may have completed sooner. Last Monday, price reached a recovery high of 195 which could have been the completion of its “e” wave, because it opened on Tuesday with a small down gap which it failed to fill during the rest of the week. Furthermore, on Friday, it was down for the day, clearly weaker than SPX, and barely able to hold its Monday low. If this leading indicator – which many analysts consider to be one of the best there is – gaps down again on Monday, it could keep on going and take the rest of the market with it.
UUP
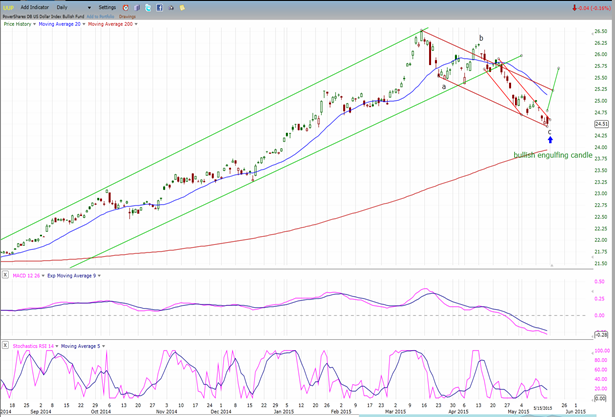
UUP does not yet appear to have found a reliable low, although Friday’s action formed a bullish engulfing pattern which may indicate that a low has been made. Let’s see if it follows through with some upside progress on Monday.
GLD
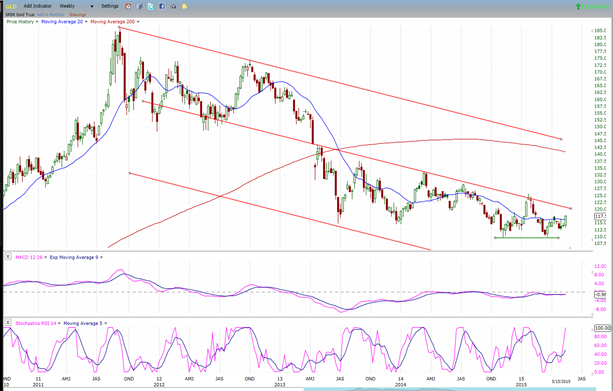
GLD is still trading below its mid-channel trend line. However, it moved up on Friday, perhaps finally responding to the upside pressure of its 25-year cycle low; or perhaps, in anticipation of some imminent weakness in equities?
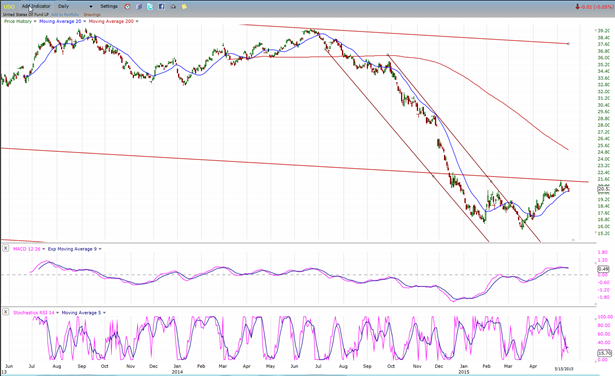
USO
USO has not been able to penetrate its mid-channel line resistance. It has pulled back after a second attempt and now needs some follow through to show that it is ready to start on a decline to its 13 price projection. A reversal in UUP would help push it lower, but would somewhat interfere with GLD’s attempt at moving up.
Summary
A technical analyst is continually looking for warnings of a change in market trend – on any time frame! Warning signs that an important change in trend was coming started to appear several weeks ago, and they have become more numerous and more urgent with every passing week.
This week’s analysis suggests that an important correction may be imminent, perhaps starting as early as Monday. The emphasis is on “may”, because future market behavior must confirm that the analysis is correct.
All eyes should be focused on next week’s market action, starting with Monday’s opening!
********
FREE TRIAL SUBSCRIPTON
Market Turning Points is an uncommonly dependable, reasonably priced service providing intra-day market updates, a daily Market Summary, and detailed weekend reports. It is ideally suited to traders, but it can also be valuable to investors since highly accurate longer-term price projections are provided using Point & Figure analysis and Fibonacci projections. Best-time reversal estimates are obtained from cycle analysis.
For a FREE 4-week trial, send an email to: [email protected]
For further subscription options, payment plans, weekly newsletters, and for general information, I encourage you to visit my website at www.marketurningpoints.com . By clicking on "Free Newsletter" you can access the latest newsletter which is normally posted on Sunday afternoon (unless it happens to be a 3-day weekend in which case it could be posted on Monday).
The above comments and those made in the daily updates and the Market Summary about the financial markets are based purely on what I consider to be sound technical analysis principles. They represent my own opinion and are not meant to be construed as trading or investment advice, but are offered as an analytical point of view which might be of interest to those who follow stock market cycles and technical analysis.

When Andre Gratian was a stock broker years ago, a friend introduced him to technical analysis of the market. Consequently, it is not an exaggeration to say that Andre fell in love with this approach! Ever since then, it has become an increasingly important part of his professional life. Gratian has studied the works of Wyckoff, Edwards & Magee, Edward J. Dewey (cycles) and many others. However, one of my most profitable undertaking has probably been to study Point & Figure charting, which he finds invaluable in analyzing stocks and indices. If he were restricted to one methodology, this is the one that he would choose. This well-rounded background has given him what he feels to be a special insight into the stock market, facilitating the recognition of meaningful patterns and the ‘turning points’ in all trends, whether they be short or long term. Andre feels very comfortable discussing the stock market and passing on meaningful information to others. His subscribers include individuals and money managers throughout the world. Moreover, his Newsletters are currently published on several financial sites, here and abroad.


