S&P500 And NASDAQ – Best Offense Is A Good Defense


If you do not use stops in a market, do not complain about giving back profits or taking larger losses. That is the negative approach to handling one’s portfolio, and for some reason, more the norm for stock investors/traders.
Change is inevitable, but it needs some direction. The use of stops will eliminate a lot of emotional decision-making and help shore up a weakness in strategy, but simply doing away with weakness does not ensure strength. Those areas which will improve overall performance need even greater development. The best way is to have a set of rules.
Every successful trader we know of not only has a set of rules, but they are also written down and reviewed weekly, if not daily. The rules need not be complicated, but they should be consistent, for consistency will have you acting in the same way under similar circumstances that ensures better performance results.
A set of rules develops out of your individual market approach and needs to fit your trading/investing style. One of the simplest is to always be in sync with the trend. This requires a knowledge and understanding of what constitutes a trend. Higher highs and higher lows is one easy measure. Some may employ a set of moving averages. Whatever the choice, it needs to be applied uniformly, instilling discipline by always adhering to your established and written rules.
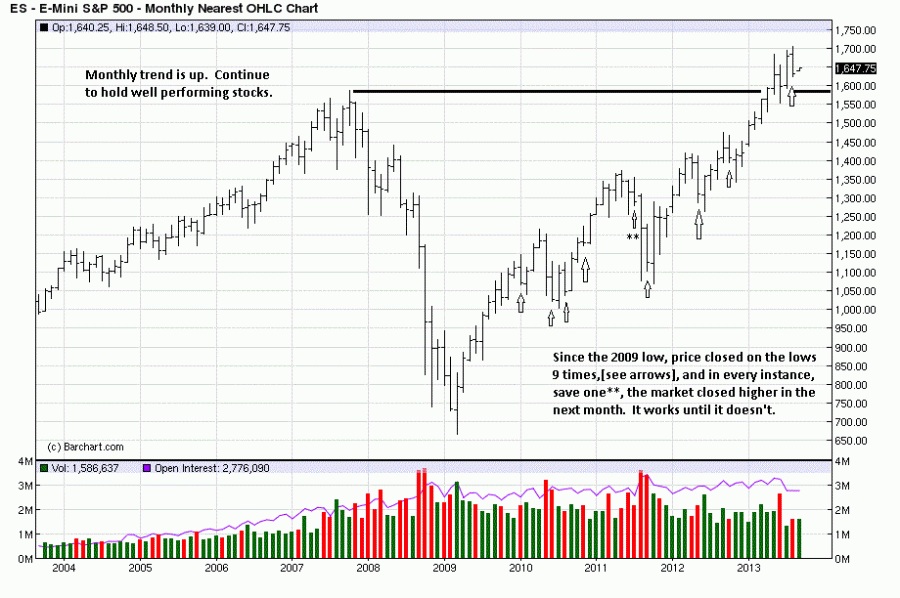
Trend application will be evident in the following charts to better understand where the market is and what it may be telling us. There is a divergence of strength between the S&P and the NASDAQ, the latter showing more strength than the former. We start with the S&P monthly.
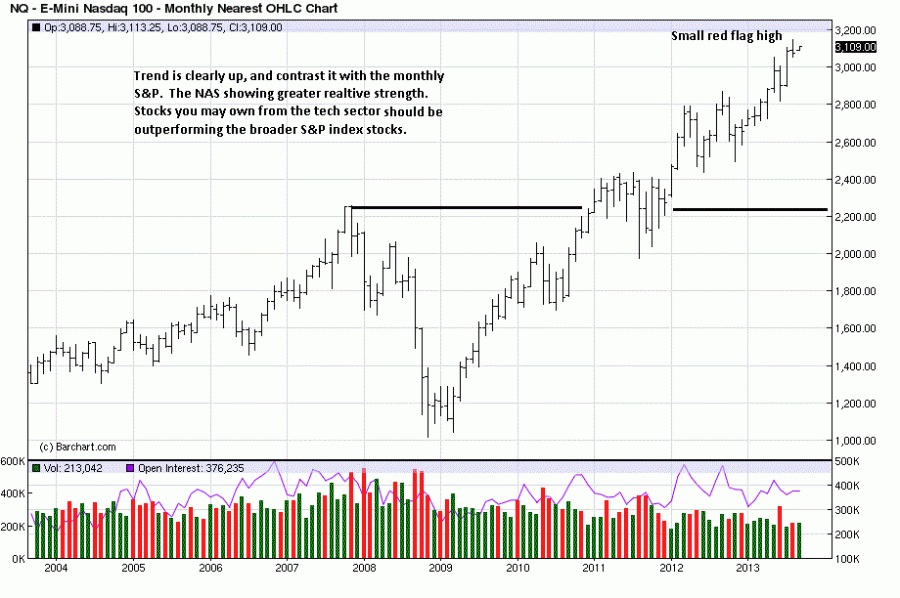
In addition to understanding trend, the concept of relative strength is a crucial part of knowing which stocks to hold and which to sell. Always stay with strength, and always sell weakness. That will become more apparent in the next chart.
The S&P has rallied into new high ground, but the bars have been overlapping since that event. The overlapping of bars indicates a struggle/balance between buys and sellers at a level where buyers should be in control.
This is where any holdings within this index should be reviewed, and marginal or poor performers should be weaned, for if they cannot do well as price enters new highs, they will not hold up very well if/when the market turns. Then, carefully monitor those that are profitable, and place a stop under a recent swing low or price level you would not want to see your stock go lower on you.
It will be worth watching to see if the low monthly close pattern of price reversal maintains itself for September, historically a month when prices are generally lower.
Here is where relative strength shines out. Compare the price location of the current high in the S&P, relative to its 2007 high, then look at where the NAS index is relative to its 2007 swing high. Tech stocks have been faring much better. Any holdings in tech stocks that have not kept pace with the index are relative weak performers, and one would not want to be holding onto weakness during a period of strength. It is just common sense.
You see greater detail on the weekly chart, and the 4 smaller rally bars leading up to the high shows a lack of demand. In new high ground, when price cannot rally in a stronger fashion, it raises a red flag. The trend is showing signs of being tired, not ending, but struggling. Marginal winners, and certainly all losers in one’s portfolio deserve attention as to retention.
From the high, there was Ease of Downward Movement, [EDM], three weeks ago. One has to watch how the next rally responds to a retest. If it struggles on small ranges and weak volume, the market will be signaling more weakness can easily follow. Plan accordingly.
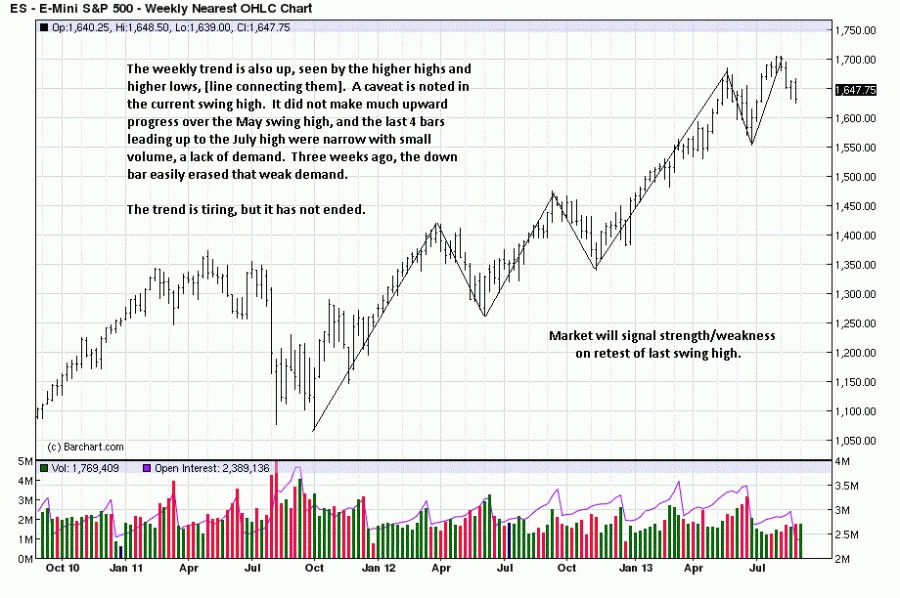
Stronger, again, compared to the S&P, the weekly NAS shows clearer signs of tiring by the overlapping of bars. Last week’s bar was wide with a poor close, but it held support from the May swing high, [horizontal line]. The arrow pointing to the September 2012 swing high demonstrates why small range bars can be a clear warning, and one should heed
them.

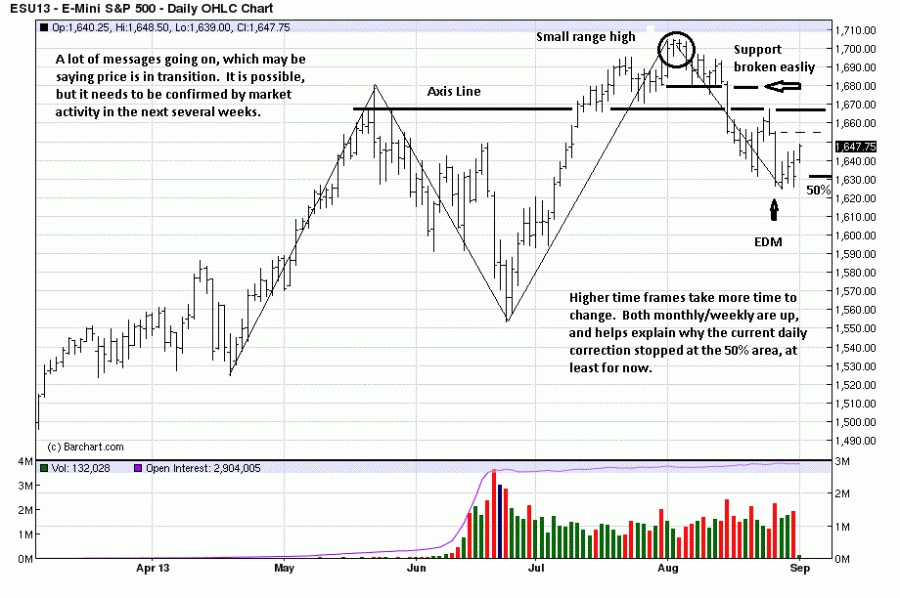
The detail from the daily shows why some concern was expressed for developing market activity on the weekly. The Axis Line acts as support when price is above and resistance when price is below. The latter August rally failed right at that level and produced an EDM bar which, interestingly, did not result in further downside movement. Price retested that low on Friday, [second bar from the end], and held, as the market has rallied on Monday.
The first test will be the small resistance dashed line, just under 1670. If price sails through it, the S&P should work higher. If not, stops become very important, or even selling some gains to lock in profits. It all depends upon one’s objectives, and profit ranks high.
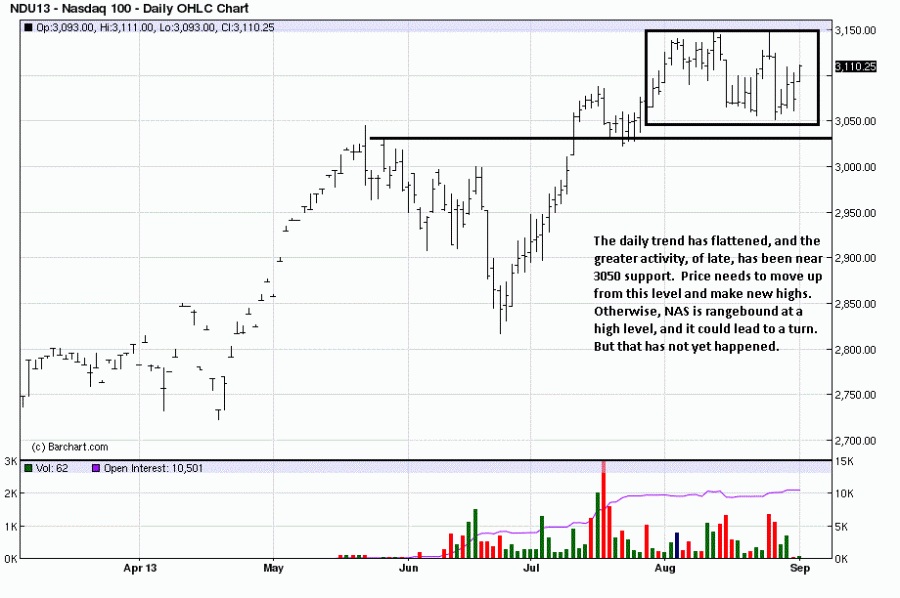
The struggle within the NAS is apparent. The strength of the monthly and weekly charts gives the benefit of any doubt to the up trend reasserting itself. If price breaks under the support area, around 3050, the daily trend turns down.
- See more at: http://edgetraderplus.com/market-commentaries/sp-and-nas-best-offense-is...


