The Start Of A 658% BULL Move??


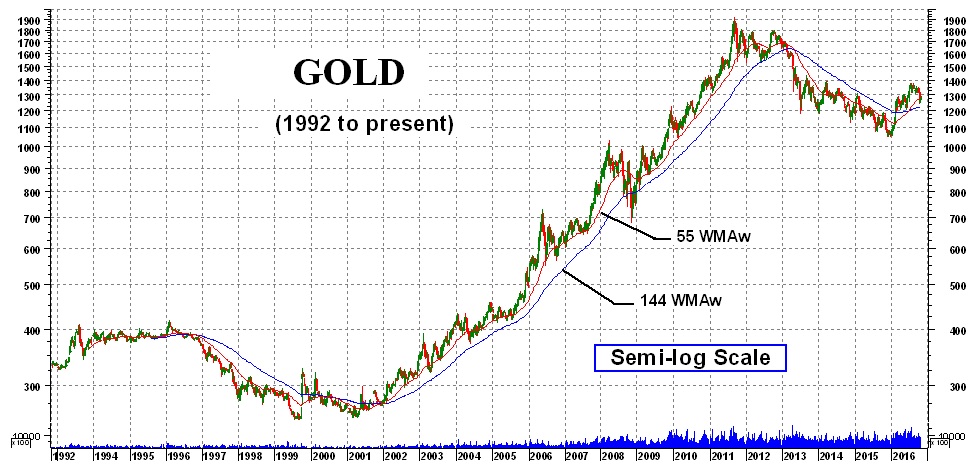
Do you believe that history repeats itself? If you do, then we just might be in for a 658% bull move in gold, to the $7,921 level (give or take a few pennies). That’s the type of bull move we had during the 2001 thru 2011 period (see chart). Will gold repeat that performance? I doubt it…but who knows, stranger things have happened. One thing the chart does show is that we just might be at the start of some kind of long-term bull move.
Shown on the chart are two very long-term moving average lines, a 55 week and 144 week weighted moving average lines. Why 55 and 144? Well, we technicians like the Fibonacci numbers and these two are the closest Fibonacci numbers representing about one and three year time periods. Besides, they fit the narrative (we wouldn’t go any earlier than the chart…as then the narrative gets blown all to pieces, but I shouldn’t be telling you that).
It seems that once the shorter moving average line crosses the longer moving average line, we are in for a significant move. That is where we seem to be on the bull side now.
Let’s keep our fingers crossed that recent history will repeat itself…but let the technical analysis tell you what is going on and not let dreams take over.
Normal Gold Commentary
Long-Term
Nothing has changed in the long term picture from my comments of last week. The rating remains the same, - NEUTRAL. The only slight change in the picture although not affecting the rating yet, is the fact that the intermediate-term moving average line is sitting right on top of the long-term line ready to break down for a very negative sign.
Intermediate-Term
As with the long-term, nothing has changed in the intermediate-term picture from last week. The rating therefore remains BEARISH.
Short-Term
I mentioned last week that the recovery may be slow and torturous. Well, it was slow and torturous this past week. Maybe things will perk up this coming week but somehow I’m not too confident of that. The gold price inched oh so gently during the week almost not enough to make any effect. The short-term moving average line turned to the up side during the week which upgraded the rating. The gold price remains just above its short-term moving average line. The momentum indicator continues to strengthen after being in its oversold zone. It remains above its positive sloping trigger line. The short-term rating can now be upgraded to a full BULLISH rating although a weak bull.
Gold And Silver Stocks
Last week I mentioned I would delve into the stocks in more detail this week. Since I have been keeping several Indices of my own for some time now I thought the best thing would be to use the Merv’s Gold & Silver 100 Index for such analysis. The Index seen the light of day way back in 1993 and the chart shows the full history of its subsequent performance. The Index has been updated and revised from time to time as required to maintain it as the top 100 market value gold and silver stocks traded on the North American Exchanges. In addition, some time back the Index was adjusted to show the start of the great bull move at a value of 10.00 for easier analysis. Unlike the major Indices, this Index is based upon the average weekly price change of the 100 component stocks. The major Indices vary but they all give the larger component stocks a greater weight towards the calculation of the Index and lesser weight to the smaller stocks. The major Indices therefore do not adequately reflect the performance of the smaller or secondary stocks.
The first interesting point one observes on this chart is that the average gold stock was already up 200% before gold started its bull move. Looking at the popular North American Indices, they bottomed out in late 2000 while the 100 Index was already ahead by 150%. Just an interesting note. It is not unusual for the gold stocks to start their moves ahead of the gold price, up or down.
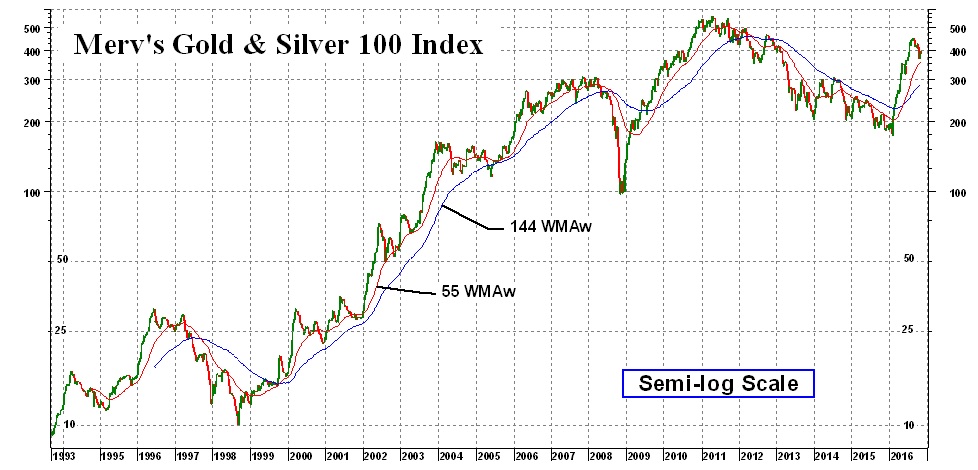
Despite a serious bear market in 2007 the average 100 Index stocks gained 5497% from the start of the bull in 1998 to its top in 2011. With gold gaining 658% during this period that gives us a ratio of average stock to gold at 8.36 to 1. It is noted that the most popular Gold Index, the PHLX Gold/Silver Sector Index (XAU) gained only 1709% during this same period, good but not up to speed versus the average of the top 100 stocks. This suggests that the secondary stocks are where the action is and the larger “quality” stocks are lagers holding back the major Indices.
Looking at the latest action we see that the 100 Index rallied almost back to its previous high, well above that 2013/14 resistance level. The popular North American Indices are nowhere near their previous highs, in fact hardly a third of the way there and still unable to decisively break above their 2013/14 resistance levels. Another example of the better performance of secondary stocks versus the “quality”.
So, what did the stocks do this past week and where do we stand?
The PHLX Gold/Silver Sector Index (XAU) lost 2.4% on the week.
The NYSE Arca Gold BUGS Index (HUI) lost 4.1%.
The NYSE Arca Gold Miners Index (GDM) lost 3.2%.
The Merv’s Gold & Silver 100 Index lost 2.6%.
The Merv’s Penny Arcade Index lost 1.9%.
The Merv’s Silver 30 Index lost 3.7%.
Long-Term
The 100 Index closed the week just above its positive sloping long-term moving average line. The momentum indicator is in its positive zone just on top of a negative sloping trigger line. From this I still get a BULLISH long term rating, but very close to getting downgraded if it doesn’t firm up… In addition, the shorter term moving average line is still above the long term line for some extra positive indication. Unfortunately, the individual stocks at something else. The overall BULL/BEAR performance of these 100 stocks gives us a 27% positive reading and 55% negative reading.
Intermediate-Term
The 100 Index closed the week below its intermediate-term moving average line and the line is pointing downward. The momentum indicator closed just above its neutral line in the positive zone and is sitting above a negative trigger line. The rating remains BEARISH. This is further confirmed with the shorter term moving average line continuing below the intermediate-term line. The week finished with an overall BULL/BEAR stock rating of 18% positive and 73% negative.
Shorter-Term
With the use of weekly data the time periods used for the shorter-term period is slightly longer than my normal daily data period but still significantly less than the daily intermediate-term period. Note the use of the term “shorter-term” versus the normal “short-term”.
The 100 Index closed just above its negative sloping moving average line. The momentum indicator is still in its negative zone but above a negative sloping trigger line. This suggests a recovering Index but still with a NEUTRAL rating. The week ended with an overall BULL/BEAR stock rating of 40% positive and 45% negative.
For the week there were 26 stocks closing on the up side with 74 stocks closing on the down side.
Next post I will look at the Penny Arcade Index in more detail. This is most likely in two weeks time, although I will try to make it next week.
********
Readers are invited to view my Facebook page at https://facebook.com/merv.burak where I will be slowly posting commentaries explaining in more detail my various indicators and techniques. I also present from time to time some individual stocks that look as if they may be good speculations. However, nothing I post is meant to be a recommendation to buy or sell. One should check with their broker or investment advisor before acting.
 Merv is a retired Aerospace Engineering consultant. He is also a retired market technician with over 40 years of market experience and research. Merv received his certification as a Chartered Market Technician (CMT) in 1992. Developer of many technical techniques and programs which he has been using in his previous Technically Speaking with Wil-Arm and Technically Precious with Merv commentaries posted throughout the globe. Developer of several gold and silver Indices, Merv continues to update his Merv’s Gold & Silver 100 Index and Merv’s Penny Arcade 50 Index and reviews them during his periodic on-going Technically Precious commentaries.


