Stock Market 'Vacuum' in Progress; Gold Cycle Update


 With the overall action in the markets, I wanted to take a look at the cyclical position of U.S. stocks this weekend, as well as to take a quick look at the picture for the Gold market - with the latter looking for additional weakness into early next year.
U.S. Stocks Locked in a 'Vacuum'
The last mid-term bottom in the SPX came from our 180-day time cycle, which troughed with the late-October tag of the 4103.78 SPX CASH figure - precisely where it was forecast to occur, in our Market Turns report, which covers the U.S. stock market.
Here is that particular cycle:
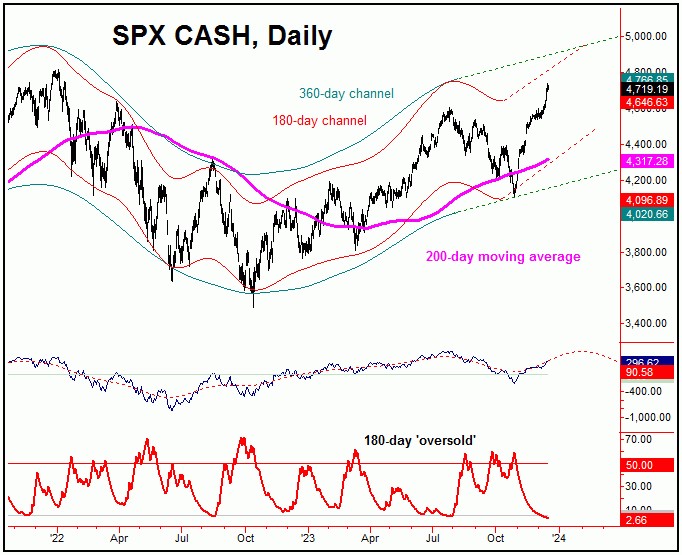
From the low registered in late-October, the upward phase of this 180-day cycle was later confirmed to be back in force. In terms of price, we noted at the time that a 17% rally was the normal expectation for the SPX, which was the average statistical rally for this wave - when coming off the pattern of a 'higher-low'.
Going further with the above, this 17% rally was expected to come in a fairly short time window - thus creating a market 'vacuum', one which would sweep prices sharply higher into early 2024. This vacuum should take prices into our next 'kill zone' date, where the next mid-term top should eventually form for the U.S. stock market.
In terms of time, the next mid-term peak for the SPX is expected to come from the combination of 180 and 360-day cycles, with the larger 360-day component shown on our next chart:
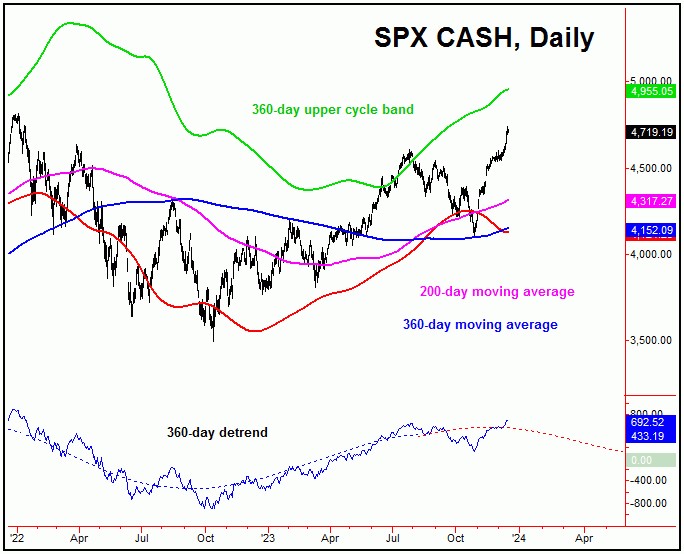
As can be seen on this 360-day chart, the wave that tracks this cycle is gently starting to roll over to the downside. Having said that, this will not turn out to be meaningful until early next year, where its upward phase should top with the smaller 180-day cycle - for what is anticipated to be the largest-percentage correction of 2024.
Until proven otherwise, however, the coming correction phase with the 180 and 360-day cycles seems favored to end up as a countertrend affair, before giving way to another sharp rally in the months to follow - most likely playing out into later next year.
Gold Cycle (Quick) Update
From my prior article: "higher highs into early-December for Gold were expected to peak this 72-day cycle, which is now favored to have topped with the 12/4/23 spike up to the 2152.30 figure. With the above, Gold is now deemed to be in a correction with our 72-day wave, which could last into the late-December to mid-January region, where our detrend is projecting its next trough to form."
As mentioned in my last article, a decent swing top was deemed to have formed in the Gold market, with that peak coming from our middle-most wave, the 72-day cycle - and which is shown again on the chart below:
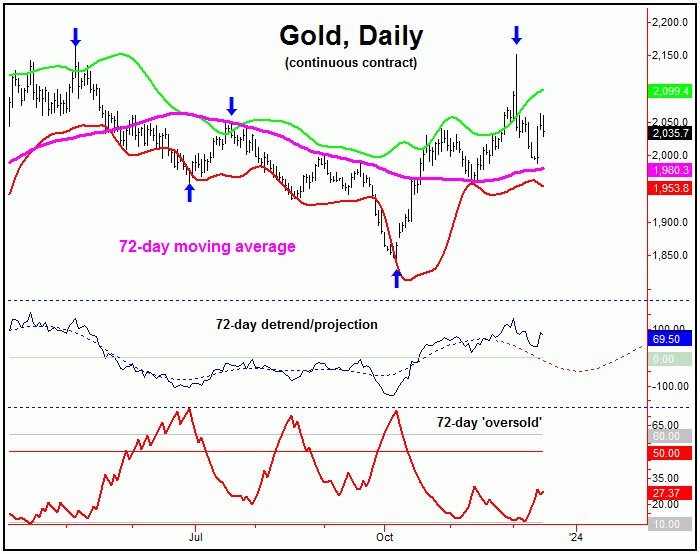
In terms of time, this 72-day wave is next due to bottom out around the late- December to mid-January (2024) region. With that, the most recent short-term rally - which was forecast in our Gold Wave Trader market report - is favored to end up as a countertrend affair, before turning south again into that early-2024 timeframe.
Stepping back further, the drop back to lower lows in the coming weeks - if seen as expected - should also end up as a countertrend affair, against the bigger upward phase of our next tracked wave, the 310-day cycle:
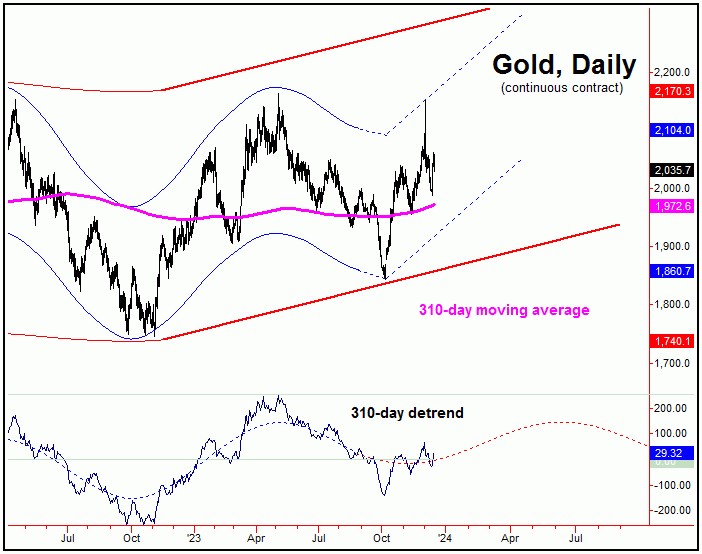
With the above said and noted, a countertrend correction with our smaller 72-day wave - if seen as expected in the coming weeks - should set the stage for our next key bottom for Gold.
In other words, once this decline is finished with the 72-day cycle, the ideal path would be looking for a push back above the highs again on the next upward phase of this wave, with a 10-14% rally being a normal expectation.
The 'trigger' for the next 72-day cycle bottom looks to be our Gold Timing Index, which is shown on our next chart:
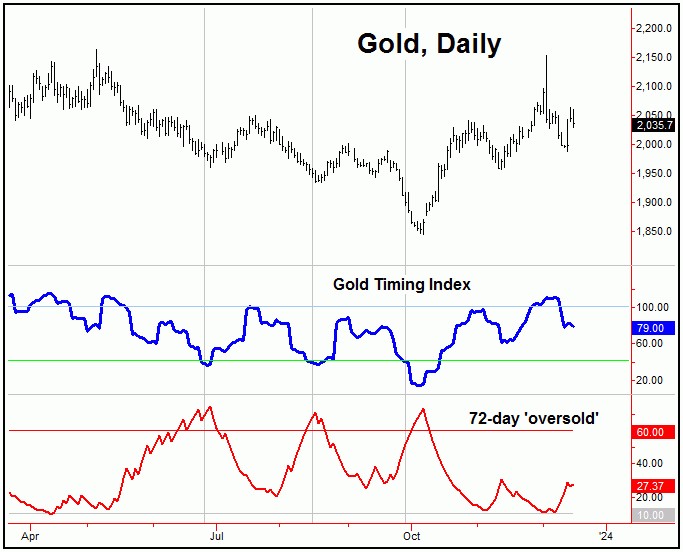
With the above said and noted, price tends to form bottoms when our Gold Timing Index drops below the 40 level - as it did back in early-October of this year.
Right now, we are still in the middle-to-upper-end range with this particular indicator, which favors price to see additional correction in the coming weeks - following the completion of the recent short-term rally.
As mentioned above, should our Gold Timing Index drop below the 40 level in the coming days/weeks, we will have the strongest signal that our next key low is forming with Gold. As always, precise and the most up-to-date updates on this indicator are always posted in our thrice-weekly Gold Wave Trader report.
Jim Curry
The Gold Wave Trader
http://goldwavetrader.com/
http://cyclewave.homestead.com/
********


