Stocks Continue Their Rally As Investors Remain Bullish Ahead Of Earnings Releases


In our opinion, speculative short positions are favored (with stop-loss at 2,100, and profit target at 1,950, S&P 500 index).
Our intraday outlook is bearish, and our short-term outlook is bearish. Our medium-term outlook remains bearish, as the S&P 500 index extends its lower highs, lower lows sequence:
Intraday outlook (next 24 hours): bearish
Short-term outlook (next 1-2 weeks): bearish
Medium-term outlook (next 1-3 months): bearish
Long-term outlook (next year): neutral
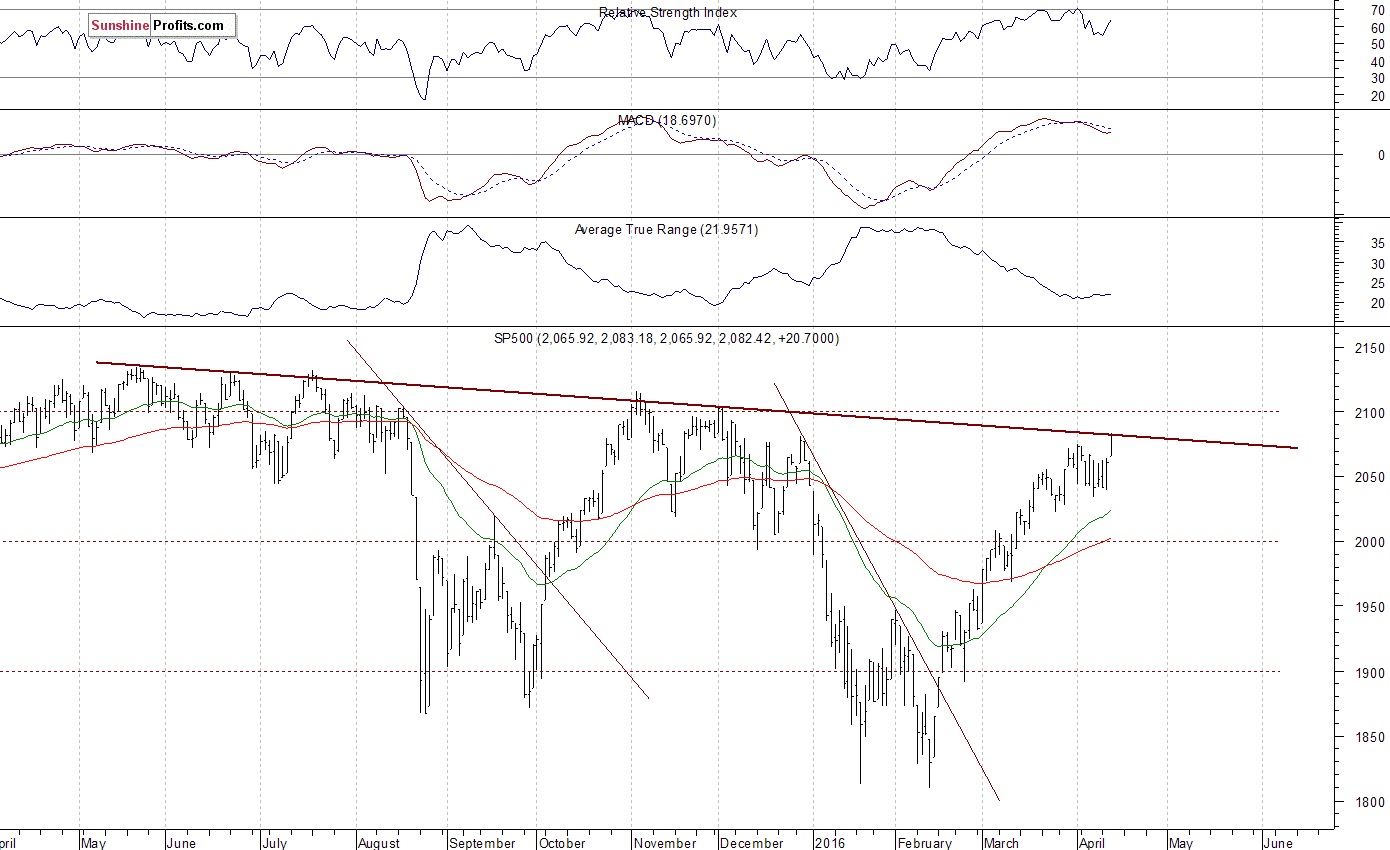
The U.S. stock market indexes gained between 1.1% and 1.3% on Wednesday, extending their short-term uptrend, as investors' sentiment improved ahead of quarterly corporate earnings releases, among others. The S&P 500 index broke above its recent consolidation along the level of 2,050. The nearest important level of resistance is at around 2,080, marked by the late December high. The next resistance level is at 2,100-2,120. On the other hand, the support level is at 2,030-2,040, marked by recent consolidation, and the next level of support is at 2,000-2,020, marked by the previous level of resistance. The index continues to trade within a descending medium-term trading channel, as the daily chart shows:
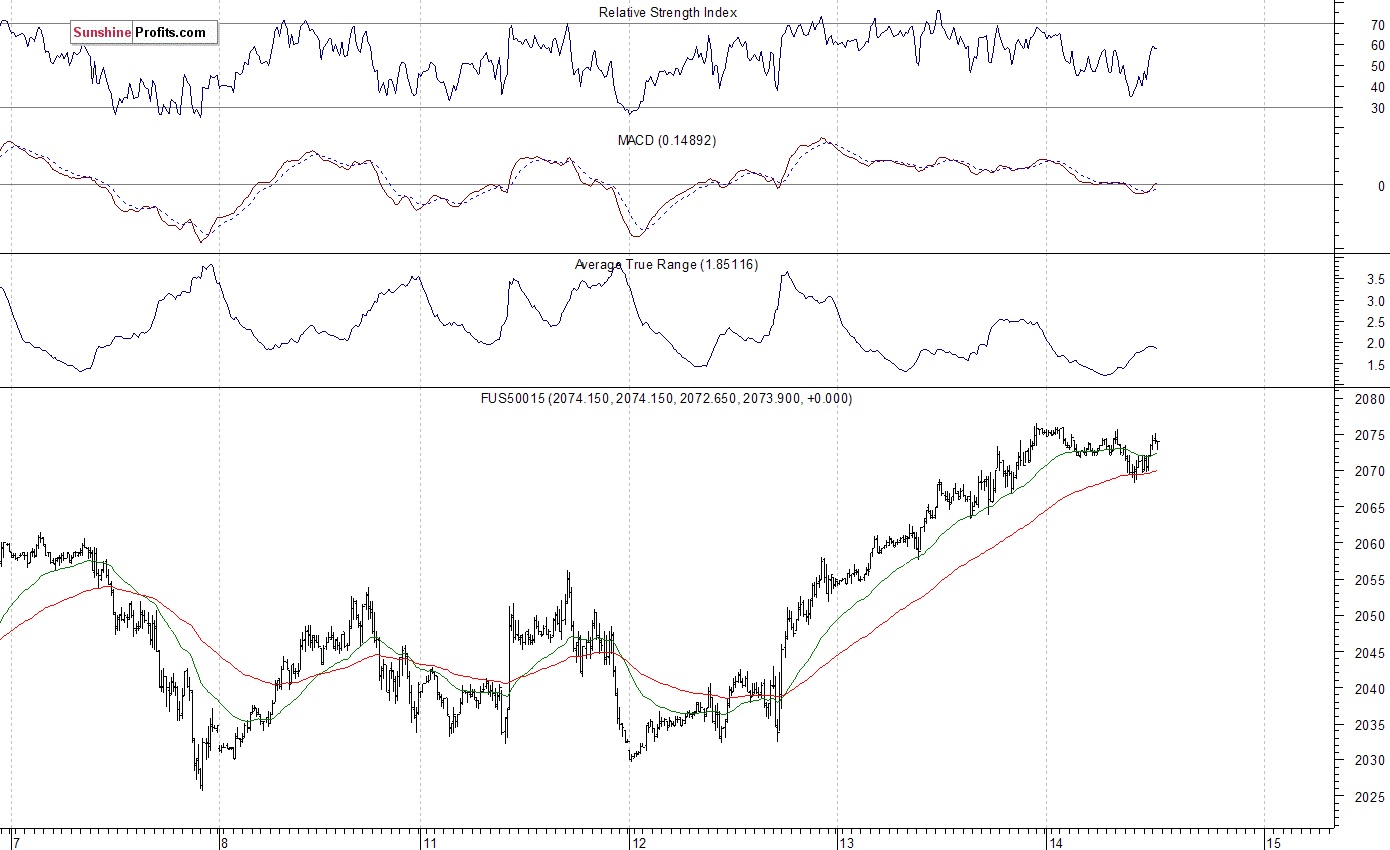
Expectations before the opening of today's trading session are slightly negative, with index futures currently down 0.2%. The European stock market indexes have been mixed so far. Investors will wait for some economic data announcements: Consumer Price Index, Initial Claims at 8:30 a.m. The S&P 500 futures contract trades within an intraday consolidation, as it fluctuates along the level of 2,070, following yesterday's advance. The nearest important level of support is at around 2,060-2,065, marked by recent consolidation. On the other hand, resistance level is at around 2,075, marked by yesterday's local high, as we can see on the 15-minute chart:
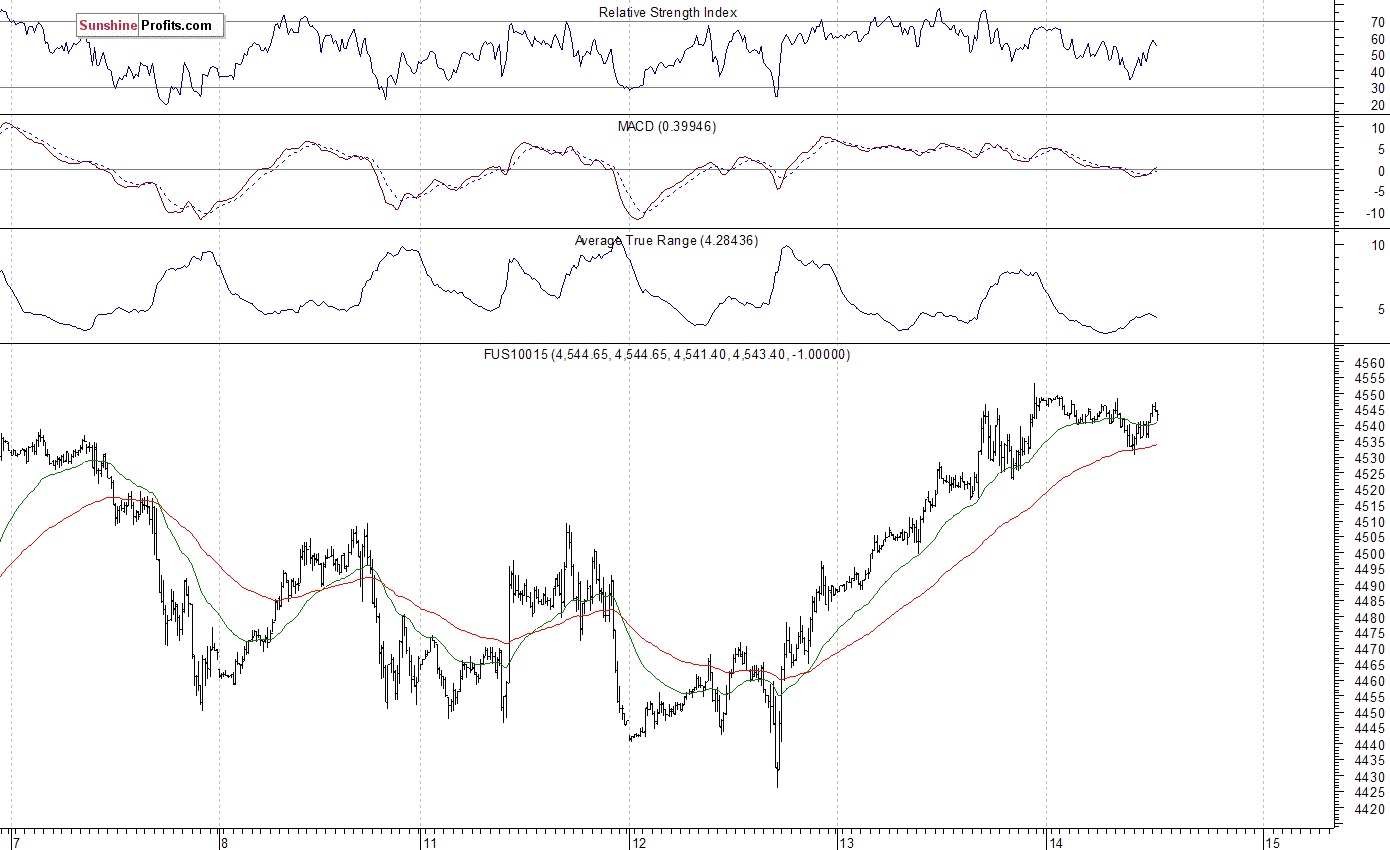
The technology Nasdaq 100 futures contract follows a similar path, as it fluctuates along the level of 4,550, following yesterday's rally. The nearest important level of resistance is at around 4,550, and the support level is at 4,500-4,520, among others. There have been no confirmed negative signals so far. However, we can see some short-term overbought conditions:
Concluding, the broad stock market broke above its recent consolidation, as the S&P 500 index reached its late December local high above the level of 2,080. We still can see technically overbought conditions that may lead to uptrend's reversal or downward correction at some point. Therefore, we continue to maintain our speculative short position (opened at 2,045.56 - last week's Wednesday's opening price of the S&P 500 index). The stop-loss level is at 2,100 and potential profit target is at 1,950 (S&P 500 index). You can trade S&P 500 index using futures contracts (S&P 500 futures contract - SP, E-mini S&P 500 futures contract - ES) or an ETF like the SPDR S&P 500 ETF - SPY. It is always important to set some exit price level in case some events cause the price to move in the unlikely direction. Having safety measures in place helps limit potential losses while letting the gains grow.
********
Courtesy of SunshineProfits.com


