The Super Blood Wolf Moon Eclipse And The Markets
 share
share
 share
share
 share
share
 share
share
 share
share
Having watched Van Helsing I thought "There must be a way to work this stuff into chart analysis" and there is, for tomorrow night there is a "Super Blood Wolf Moon Eclipse" which might synchronize with a reversal in the markets. Before you burst out laughing, I point out that it is an established fact that reversals in the Precious Metals often synchronize with full and new moons, and whether this is a matter of astrology or simple gravitational pull or a combination of these factors is an open question.
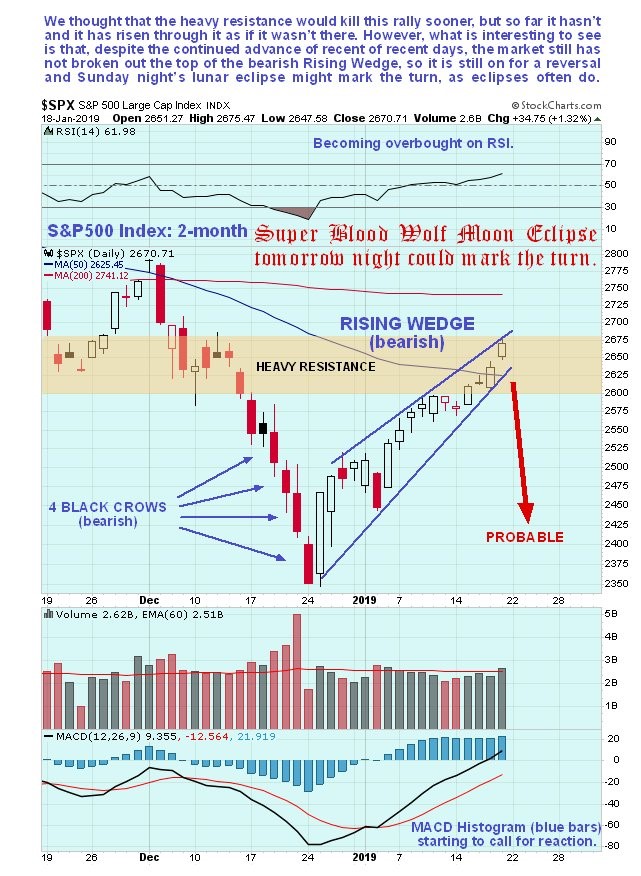
As you will be aware we had expected the rally in the broad US stockmarkets to be snuffed out by heavy resistance some days back, but it wasn't and the market has continued to advance, as we can see on the latest 2-month chart for the S&P500 index shown below. However, a very important point to observe is that it has not broken out upside from the bearish Rising Wedge, and remains within its confines, and this Wedge continues to portend a reversal and sharp drop soon. We were in error defining the lower boundary of this Wedge and thought it had broken down from it, but it hadn't, not quite, and the uptrend picked up steam again and it made another run at the top of channel, arriving at its upper boundary on Friday, which obviously pressured our short positions. Now though, with the Wedge closing up and the market deep into heavy resistance, the chances of a near-term reversal are considered to be higher than ever.
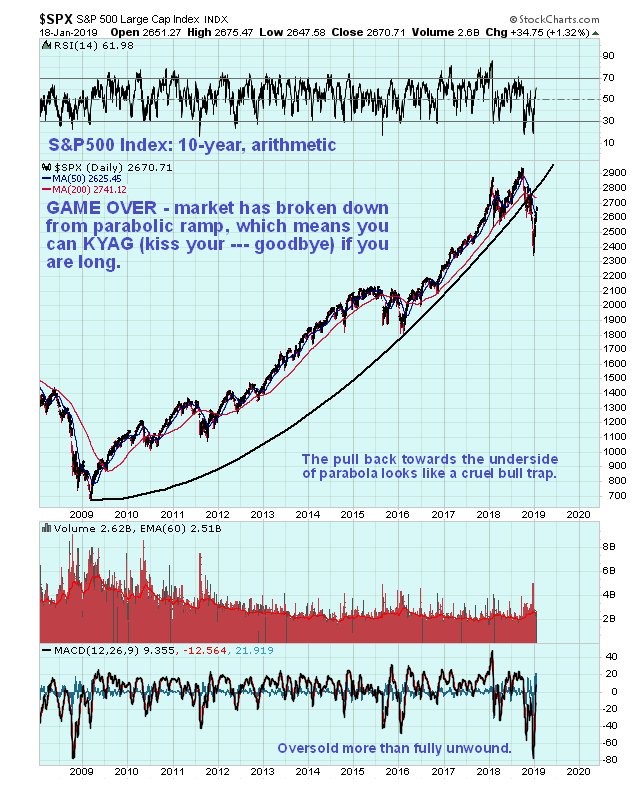
In this update we will take the opportunity to briefly consider the market from other perspectives. For example on the 10-year arithmetic chart for the S&P500 index we can see that the drop late last year broke the market down from a parabolic blowoff top and thus the short-covering rally of recent weeks back towards the underside of the parabola looks like a cruel bull trap...
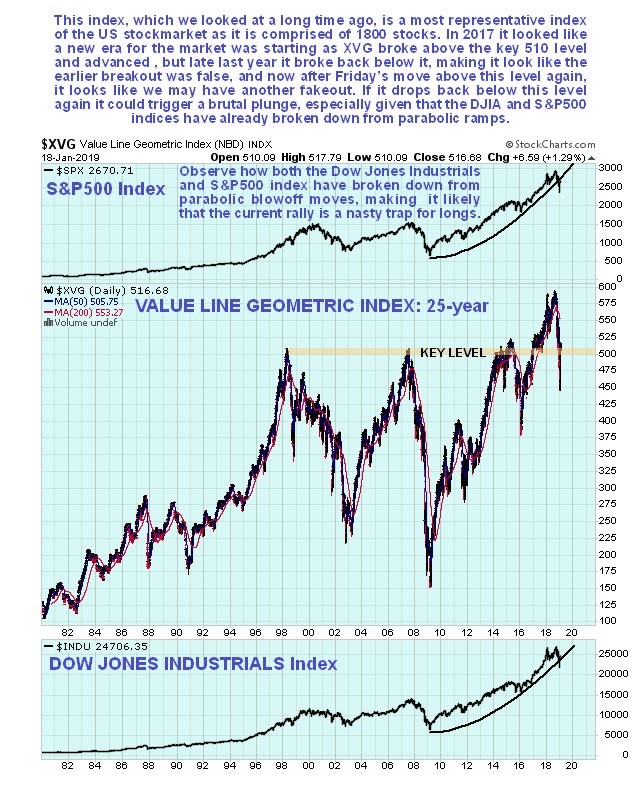
Another chart well worth examining is that of the Value Line Geometric Index, which is the most accuarate representation of the entire US stockmarket as it comprised of 1800 unweighted stocks. Its long-term 25-year chart reveals the importance of the 510 level on this index, which capped major advances on 3 occasions, in 1998, 2007 and 2014 - 2015. It only really got clear above this resistance in 2017 and that appears to have been a false breakout as it dropped back below 510 late last year, but on Friday it popped back above this level again. However, given what we are seeing elseehere this break above this level looks like another false dawn for the market, and if it drops back below 510 again it could plunge.
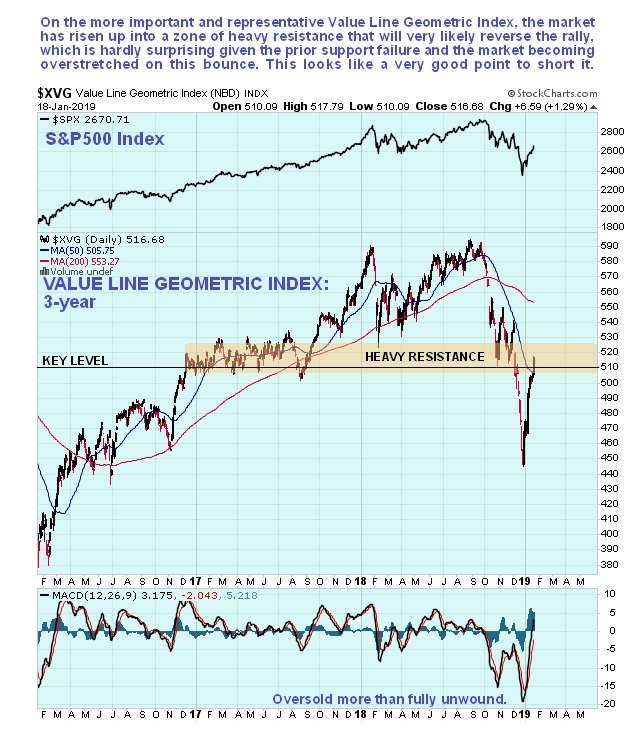
The 3-year chart for the Value Line Geometric Index shows that the index poking its nose above 510 has brought it up into a zone of heavy resistance arising from choppy trading in a range late in 2016 and during the 1st 8 months of 2017 which, given how sharply it has risen over the past several weeks through a falling 50-day moving average, makes it very vulnerable to a reversal and drop here, especially as the 200-day is now falling, which together with the major support failure has opened up the risk of a deepening bearmarket.
Will the Super Blood Wolf Moon Eclipse tomorrow night mark the turn? - it very well could, and if it does it will leave the newly bullish howling. What does the term "Super Blood Wolf Moon Eclipse" mean? - super refers to the moon being close to the closest point to the Earth in its monthly cycle at the eclipse, blood is because during totality the moon turns red-orange in color, Wolf moon refers to a January full moon.
So let's see what happens. Certainly the combination of the technical factors that we have looked at here and esoteric ones in play tomorrow night strongly suggests that the market will reverse early next week - whatever happens just be sure to keep some garlic handy.
End of update.
Posted at 8.35 pm EST on 19th January 19.
Postscript…
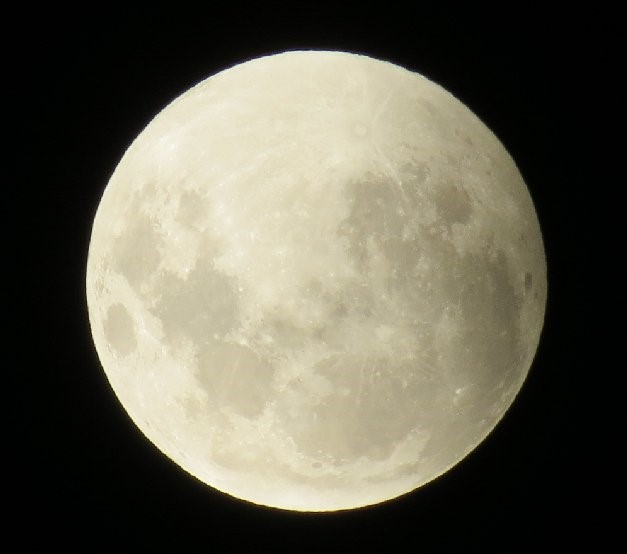
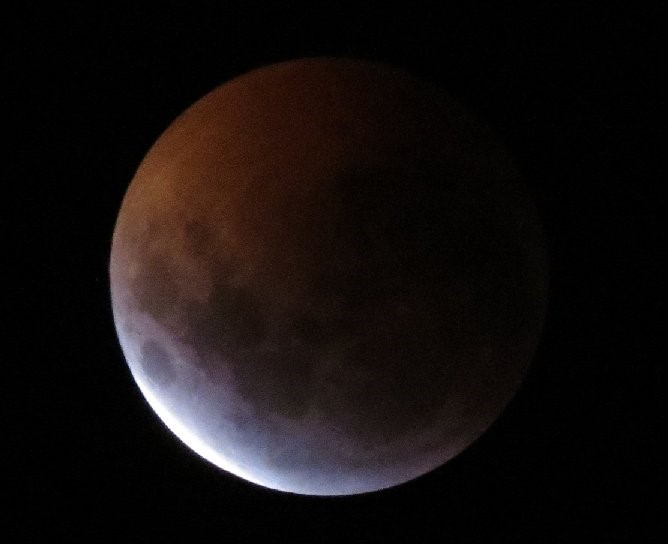
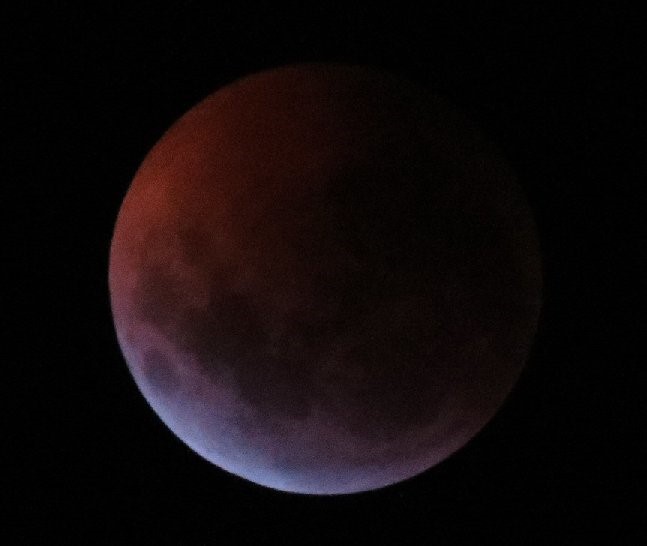
The eclipse was visible at Maund Acres in southern Chile, and for the benefit of those of you with an interest in celestial phenomena, a selection of photos that I took of the eclipse are shown below. Note that there are none of the moon later emerging from the shadow because I went to bed.
The moon enters the penumbra, or partial shadow…
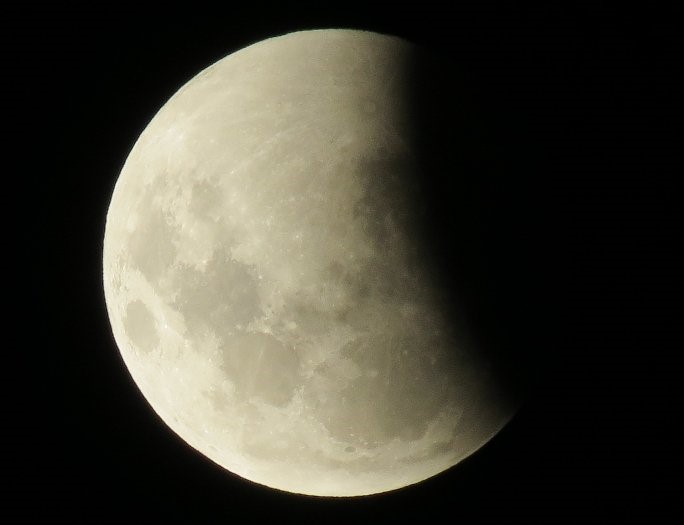
The moon entering the umbra or zone of total shadow. On this photo we can see the large ray crater, Tycho, towards the top, about to be plunged into total darkness, total that is apart from the pale orange light refracted from the Earth’s atmosphere onto the lunar surface…
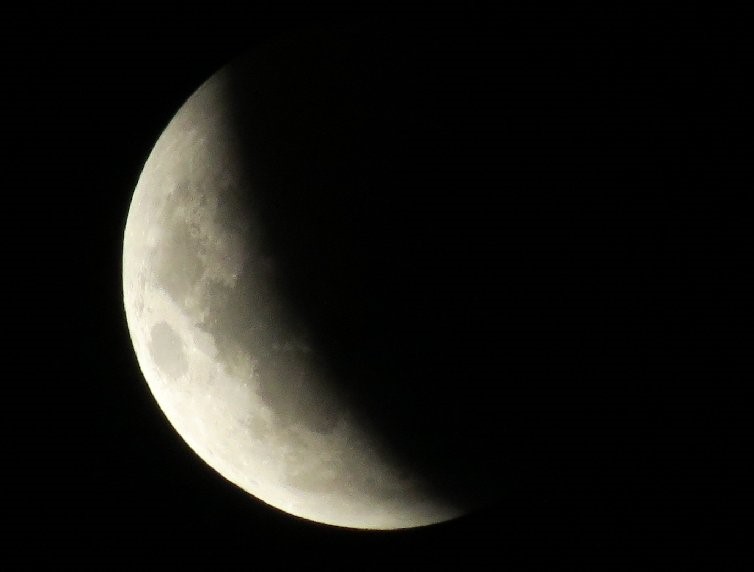
The moon being swallowed up by the Earth’s shadow. Because the Earth’s shadow at this distance is considerably larger than the moon’s diameter, this does not look like a normal crescent moon…
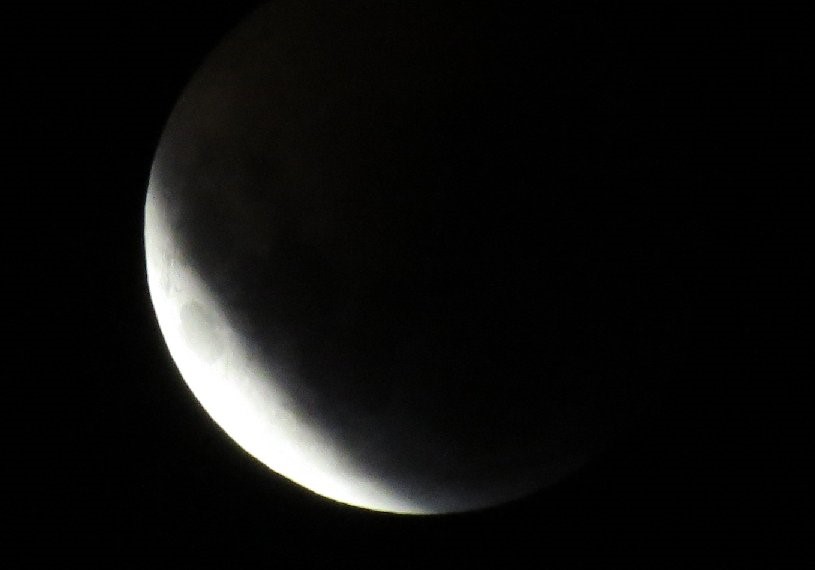
Not much left – the circular Mare Crisium can be seen in this photo…
Going, going…
Gone – with the sun totally eclipsed by the Earth, the lunar surface receives a faint red light refracted around through the Earth’s atmosphere…
All photos by Maund, Maund Acres, Villarrica, Chile.
share
share
share
share
share

Clive P. Maund’s interest in markets started when, as an aimless youth searching for direction in his mid-20’s, he inherited some money. Unfortunately it was not enough to live a utopian lifestyle as a playboy or retire very young. Therefore on the advice of his brother, he bought a load of British Petroleum stock, which promptly went up 20% in the space of a few weeks. Clive sold them at the top…which really fired his imagination. The prospect of being able to buy securities and sell them later at a higher price, and make money for doing little or no work was most attractive – and so the quest began, especially as he had been further stoked up by watching from the sidelines with a mixture of fascination and envy as fortunes were made in the roaring gold and silver bull market of the late 70’s.
Clive furthered his education in Technical Analysis or charting by ordering various good books from the US and by applying what he learned at work on an everyday basis. He also obtained the UK Society of Technical Analysts’ Diploma.
The years following 2005 saw the boom phase of the Gold and Silver bull market, until they peaked in late 2011. While there is ongoing debate about whether that was the final high, it is not believed to be because of the continuing global debasement of fiat currency. The bear market since 2011 is viewed as being very similar to the 2-year reaction in the mid-70’s, which was preceded by a powerful advance and was followed by a gigantic parabolic price ramp. Moreover, Precious Metals should come back into their own when the various asset bubbles elsewhere burst, which looks set to happen anytime soon.
Visit Clive at his website: CliveMaund.com


