A Tale of Two Stocks…and Two Economies


The government recently reported that the U.S. economy grew at an annual rate of 2.2 percent, below the expected 2.5 percent rate. The jobless rate has declined, but mainly because so many job seekers have given up in their search for a job. The economic recovery, in other words, isn't as strong as it appears on the surface.
The recovery to date since March 2009 has mainly been a product of loose monetary policy and the subsequent surge in the profits of corporations with global exposure. While a few domestic industries have done well (e.g. the auto industry), many others have struggled, including the pivotal housing construction industry.
The pillar industries of the U.S. domestic economy remain weak, so what's keeping the economy afloat? In a word, retail. As Zacks analyst Sheraz Mian observed today in his blog, "While 'headline' growth rate missed expectations and dropped from the preceding quarter's level, the composition of growth improved. Weak spending by governments and businesses offset surprise strength on the consumer spending front to give us the negative surprise."
The latest quarterly economic research by Zacks is important to our narrative, so I'm quoting it at length:
"Consumer spending, which accounts for close to 70% of the economy, increased by 2.9%, compared to the 2.1% increase in the fourth quarter. Households spent more on non-durables and services compared to the fourth quarter, driving the strong PCE gain. The major negative contributor to growth during the quarter was government spending, which declined 5.6% in the quarter following a 6.9% drop in the fourth quarter. Contribution from state and local governments was also negative."
This is the first early warning signal that deflation is on its way again, though we may not see it in its fullest extent until next year. Much of the strength in the economic and financial market recover since 2009 was predicated on government spending coupled with central bank policy. With the Fed no longer pursuing quantitative easing and government spending on the wane, the economy will sooner or later run out of steam as we head closer to the final "hard down" years of the 60-year cycle in 2013-2014.
Zacks further observed:
"The deceleration in business spending during the quarter does not look promising. Non-residential fixed investment was down 2.1% in the quarter, compared to the 5.2% increase in the fourth quarter.
"Corporate spending on software and equipment decelerated materially from the fourth quarter's 7.5% growth pace to an increase of only 1.7%. Inventories were less of a growth contributor to growth this quarter, adding only 0.59% compared to the 1.8% growth contribution in the fourth quarter."
It was easy enough for Wall Street to ignore the slowdown in government and corporate spending. What really got investors excited this week was the quarterly increase in consumer spending. Consumers in recent months have spent more money than they have in the 3+ years since the credit crisis. There is no better example of this than Amazon.com (AMZN), whose net sales increased 34% in the first quarter to $13.18 billion. Amazon's stock has been rewarded for this and is up nearly 20% in the last month alone.
Putting aside Amazon's stellar sales numbers, investors ignored the fact that Amazon's net income has been on a decline since early 2011. According to Wall St. Cheat Sheet, "Net income [for Amazon] has dropped 41.2% year-over-year on average across the last five quarters. Performance was hurt by a 72.7% decline in the third quarter of the last fiscal year from the year-earlier quarter."
In a previous commentary we talked about the Amazon/Apple ratio. As I wrote back in February, "There is typically a sympathetic price performance between both stocks. But when one of these stocks gets out of line with the other one, a correction typically follows in which the stock that has overshot on the upside (in this case AAPL) comes back closer into line with the laggard."
I should add that if a significant correction doesn't occur in the outperforming stock, the only way the underperforming can re-establish sympathy with the other stock is by rallying to "catch up" with the over performing stock. In recent weeks, both these outcomes have taken place as Apple's stock has declined while Amazon's has vigorously rallied. The following graph is a simple comparison of the stock prices for tech leader Apple Inc. (AAPL) and online retailer Amazon.com (AMZN). It illustrates the extreme divergence of the two stock prices since December 2011 and the subsequent reversion to the mean which is now underway.
The dichotomy between Apple's and Amazon's stock price is instructive on more than one count. While sales growth for both behemoths has been impressive, profit margins for Apple have been considerably higher than for Amazon. Moreover, the P/E ratio for Apple is significantly less than that of Amazon. Thus, two of the biggest "story stocks" in the market today are actually on divergent paths in terms of earnings growth and valuation.
The divergent paths of Apple and Amazon serve as a microcosm for the divergence between the corporate earnings recovery since 2009 versus the weak "recovery" in household incomes. Below is a chart showing the long-term trend in real median household income from 1967 to 2011, courtesy of Hoisington Investment Research.
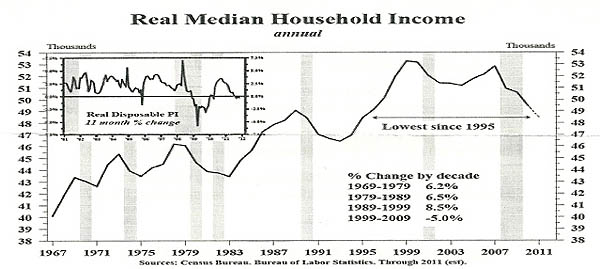
The above chart shows that over the past 40 years, real (inflation adjusted) median household income is an excellent recession indicator. Six out of the last six recessions that have occurred since 1967 were preceded by a fall in household incomes. As Robert Campbell of The Campbell Real Estate Timing Letter(www.RealEstateTiming.com) observed: "During the downturn that occurred from 2007 to 2011, household income fell to its lowest level since 1995. This represented a fall of 11%, the steepest (and fastest) fall since at least 1960."
Campbell's conclusion based on the above chart is that the statistical evidence strongly favors the bet that housing prices likely haven't hit bottom yet. We can go one step further and say that the falling household income trend points to the fact that the economy hasn't recovered yet. Moreover, since corporate profits are to a large extent predicated on consumer spending, the corporate recovery since 2009 is most likely living on borrowed time unless we see a dramatic reversal in the household income trend.
While cyclical recoveries in consumer spending may keep the recovery alive for a while longer, a truly lasting recovery can only come at the expense of stronger household balance sheets. As with Amazon vs. Apple, something has to give in this divergence between strong corporate income and weak U.S. household income.
Gold ETF
Political uncertainty in Europe over the debt crisis pushed stocks and commodities lower earlier this week with gold getting caught in the cross-hairs. Investor concern over the euro-zone debt drama has resulted in a bid to raise cash by investors with equities as well as hard assets exchanged for dollars. The U.S. dollar index has risen for the last seven consecutive days on the back of the rush to get liquid. There's an old saying in the financial market, to wit: "When they back the truck up, all the girls go." That means even a traditional safe haven like gold can be sold off when investors start to panic.
There are two responses that are typically made by analysts and advisors after a poor showing like we saw on Tuesday. The first reaction is to throw in the towel and capitulate with advisors telling their clients to "sell everything" in anticipation of even further declines. The other response is to assume prices can't possibly go any lower and to advise clients to "buy with both hands." Based on my reading of the indicators it's still a little too early to start banging the gong for a bottom, but there is reason to believe we're not far from seeing a buying opportunity.
The first clue that gold isn't far from a bottom is found in the relative strength line for the gold ETF (symbol IAU). When a market (in this case gold) begins showing relative strength versus the S&P 500 Index, it suggests the smart money traders have taken an interest in the stock or commodity in question. Our job as independent traders is to follow in the footsteps of the smart money crowd whenever possible.
Following is the relative strength (RS) line for the iShares Gold Trust ETF (IAU) since the beginning of this year. Notice the negative divergence in the RS line versus the higher high the IAU made in February, which warned of potential weakness in the gold market. Since then the RS line has mostly trended lower up until recently.
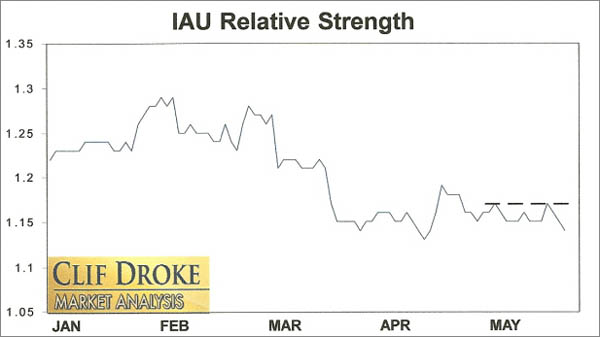
Although IAU on Tuesday made its lowest close since the first trading day of 2012, the relative strength line didn't go lower. This is a small improvement to be sure, but a positive step in the right direction in any case. This early sign of relative strength isn't good enough to hang our hat on and issue a buy signal for gold, but it does suggest that given perhaps a few more weeks, the gold market could be strong enough to begin a new bull run. To get a confirmed buy signal in the gold ETF we'll need to see the relative strength line break out above the dashed line shown in the above chart. This would tell us that gold has once again returned to a strengthening position relative to the S&P.
Gold & Gold Stock Trading Simplified
With the long-term bull market in gold and mining stocks in full swing, there exist several fantastic opportunities for capturing profits and maximizing gains in the precious metals arena. Yet a common complaint is that small-to-medium sized traders have a hard time knowing when to buy and when to take profits. It doesn't matter when so many pundits dispense conflicting advice in the financial media. This amounts to "analysis into paralysis" and results in the typical investor being unable to "pull the trigger" on a trade when the right time comes to buy.
Not surprisingly, many traders and investors are looking for a reliable and easy-to-follow system for participating in the precious metals bull market. They want a system that allows them to enter without guesswork and one that gets them out at the appropriate time and without any undue risks. They also want a system that automatically takes profits at precise points along the way while adjusting the stop loss continuously so as to lock in gains and minimize potential losses from whipsaws.
The methods revealed in "Gold & Gold Stock Trading Simplified" are the product of several year's worth of writing, research and real time market trading/testing. It also contains the benefit of my 14 years worth of experience as a professional in the precious metals and PM mining share sector. The trading techniques discussed in the book have been carefully calibrated to match today's fast moving and volatile market environment. You won't find a more timely and useful book than this for capturing profits in today's gold and gold stock market.
The book is now available for sale at:
www.clifdroke.com/books/trading_simplified.html
Order today to receive your autographed copy and a FREE 1-month trial subscription to the Gold & Silver Stock Report newsletter. Published twice each week, the newsletter uses the method described in this book for making profitable trades among the actively traded gold mining shares.
Clif Droke is the editor of Gold & Silver Stock Report, published each Tuesday and Thursday. He is also the author of numerous books, including most recently, "Gold & Gold Stock Trading Simplified." For more information visit www.clifdroke.com


