Technical Analysis of Gold And Precious Metal Stocks
 share
share
 share
share
 share
share
 share
share
 share
share
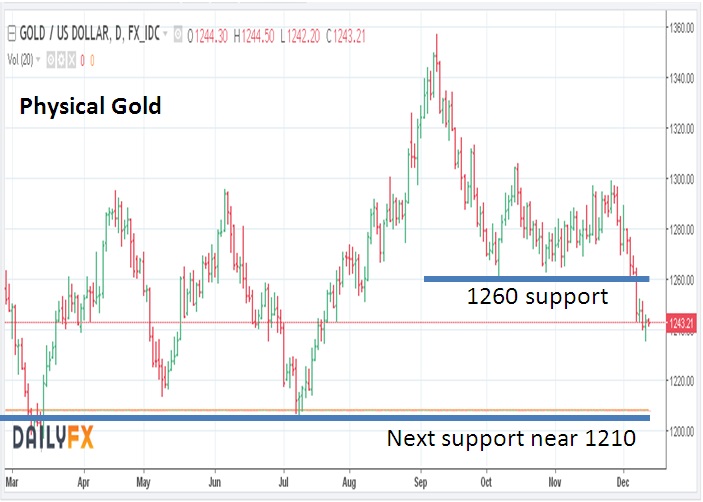
Physical Gold
Since our last update, both gold and gold stocks have weakened significantly with physical Gold breaking below our key $1260 support zone, with the HUI breaking below184.50 and GDX breaking below $22.40. As can be seen in the chart below (courtesy of Daily FX.com) there is not a lot in the way of a prior low standing between a break of $1260 which occurred five days ago and a test of more medium term support at $1210. Of course, anything is possible, and gold could always try to find a low right here. However, at the moment, we believe there is still potentially significant near term downside risk and that prices may need to test the prior lows in the $1200 area, and possibly even the December 2016 lows at $1150 before a major and final bottom is seen. We admit that sounds pretty gloomy, and we are hoping we are wrong, but at the very least, the short term picture for the next few days seems weak.
Dwelling on the gloomy side of things for a moment, this seems a good time to review the bigger picture Elliott Wave count for gold, which is actually pretty clear. From the all-time high near $1950 in August 2011 prices traced out a classic A-B-C decline with Minor Wave (A) bottoming in Sept 2011, a (B) wave peaking in October 2012 and a panicky (C) wave bottoming in June 2013 near $1176. Following that panic decline which also troughed Intermediate Wave [A] at $1176, prices then traced out am Intermediate Wave [B] triangle (a,b,c,d,e) that peaked in July 2014. This was then followed by a text book five wave falling wedge (i,ii,iii,iv,v) that bottomed the entire Primary Wave (2) correction in December 2015 at $1045. In our view, that low was the low for gold for many years and is unlikely to be broken or retested.
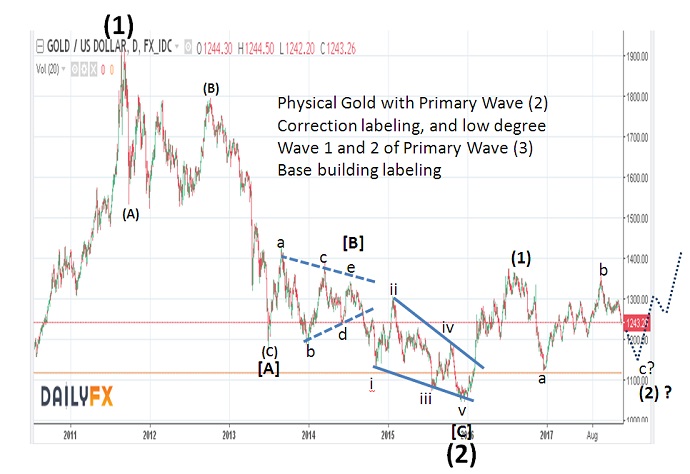
Since the Primary Wave (2) low in December 2015 at $1045, prices have traced out a mediocre quality advance that could be labeled as an Intermediate Wave (1) of a developing new bull market. That rally ended with a failing fifth wave in early August 2016 at $1362 and was then followed by a big break into a panicky low in late December 2016 (wave a) which hit a low of $1124 and is bets labeleded as Minor Wave “a” of a developing three step “a-b-c” Wave (2) Intermediate degree correction.
This means that the recent highs near $1360 in September of this year finished the “b-wave” leg of that sequence with the current decline tracing out the final down leg, minor wave ‘c’ of Intermediate Wave [2]. We are sorry if all this sounds like a lot of technical mumbo-jumbo, but hopefully we have tied in our writing with the wave labelings in the chart above to give you a good idea so you can follow along. The key take away is that Minor Wave C (the current dip) could easily equal or closely approach the lows seen at Minor Wave A. It does not have to, but it is common and within the realm of possibilities> it also keeps gold within a larger bullish configuration. We would get a lot more concerned if at any point, the December 2016 Minor Wave “a” low at 1124 was violated for more then a few days, and by more then one or two percent. That is just very unlikely. Far, far more likely in our view is that gold remains on the soft side for a few more weeks, heading into year end, and pushs down toward the low $1200 zone. That would give the overall pattern a very normal look and would likely build up enormous bullish compression which would be the catalyst for a resumption of the long term advance in the yellow metal and could set the stage for a rally over time to new all time highs.
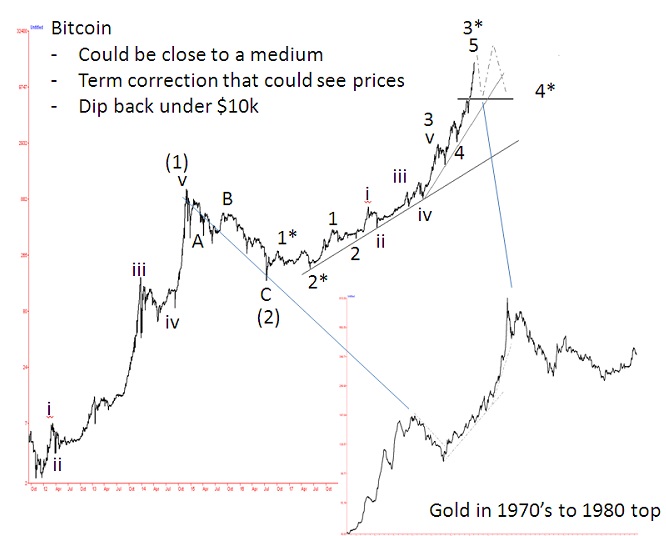
Now, at this point, many are reading this and asking the question, have cryo-currencies replaced gold as a safe haven asset? Our short answer is that we doubt it, and if you look the long term arithmetic chart of Bitcoin it looks fully parabolic. We would assume that even in the best of all worlds, Bitcoin is now, where gold was back in late 2011, namely topping a parabolic wave of Primary degree which should be followed in the months ahead by a crushing pull back that will be Primary Wave (4). Bitcoin traders should be adviced that such a
decline could easily shave 66% off the total value, and sometimes a log retracement of the preceeding advance can be even more substantial then that. Our hunch is that the long hand of global government regulation will soon embrace Bitcoin sending a chill over the market for some time to come. At the very least, a sizeable pull back toward $10,000 to $9,000 seems likely in the weeks and months ahead and that could in turn be followed by months and months, if not several years of consolidation. There is also a reasonably close parallel between Bitcoin today as a kind of mini-mania and gold in the 1970’s up to the major top in 1979-80. While we can’t say how high Bitcoin could spike in the near term, the chances are good that such a spike may be short lived and when the big break finally comes it could be crushing with prices even dipping into the high $7000 area which on a log scale chart see below, (the horizonal line we have inked in at 7,500) is really no big deal as a relative give back. However, the psychological impact of a potentially 62% decline could lead many to conclude that the Bitcoin bull is over and that also maybe an incorrect conclusion as even a 60% dip could just be part of a longer range consolidation pattern.
Gold Stocks
Gold stocks currently have built up significant downside momentum, which in a best-case scenario would take at least a few days to arrest an reverse. As we can seen in the chart on the top of the next page, over the last few days, the HUI AMEX Gold Bugs Index broke below the 3/09/2017, 05/04/2017, and 07/07/2017 lowswhich represented horizontal support at 180.50. Since then, the only near term rally has stopped cold (179.07) at the underside of that support, which we must now assume is resistance. While it is always possible that the market could find some kind of low right here, we note that the 9 day RSI is currently at a reading of +21.65. That implies that the market is short-term significantly oversold and therefore could experience a decent 2-3 day rally.
At the same time, it also suggests a lot of downside momentum is present and the need for divergence to be present (more likely then not) before a final bottom is seen should be high. So we do not think that a final price low is in place at this time, even if the market bounces for a few days, expect a retest. What’s more, this is a vulnerable place on the charts. The HUI probably cannot handle a really bad day in gold at this juncture. If, for example, the gold price were to decline from $1244 where it is now, toward $1220, chances are high that HUI would crack and move below 170 pretty quickly. That said, we have seen some meaningful improvement in a number of technical indicators and while the case for a low has definitely gathered strength, we are still not down to oversold levels that would be consider major/historic oversold values.

Above: Amex Gold Bugs chart daily – break of support seems to be containing the upside so far.
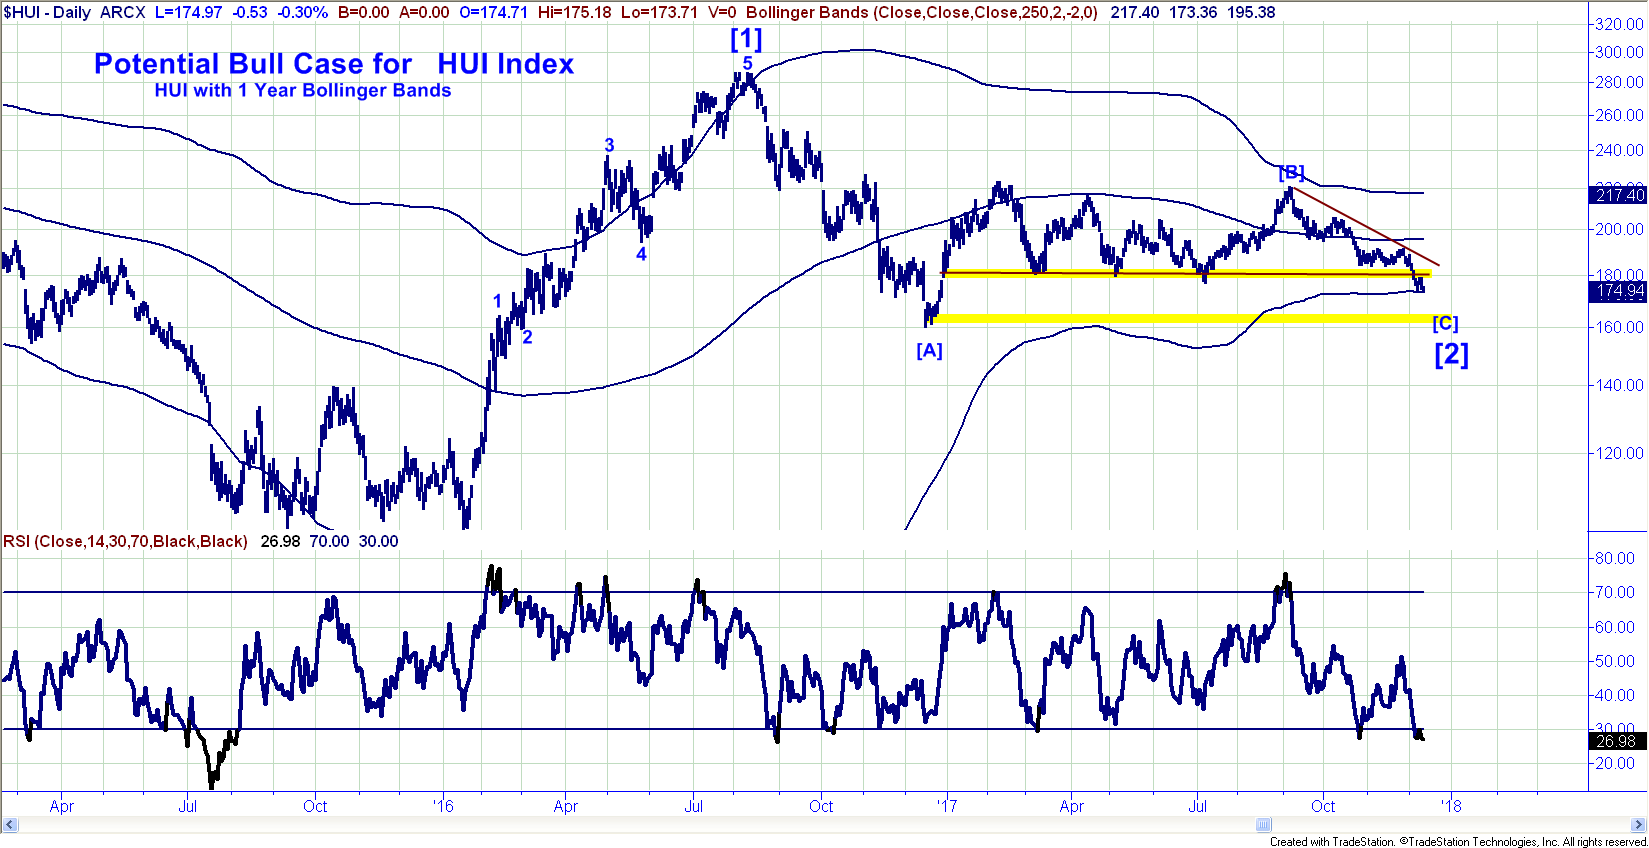
Above: HUI with 1 Year Bollinger Bands
Perhaps the best evidence we can find that this area could become an important bottom is the presence of the one year Bollinger Band where both XAU and HUI (but not GDX yet) have come down to tag that band. Generally speaking, that lower band can be a very powerful shelf of support and so if prices can hold at these levels for a few days or even rally a bit it, it could be the first sign that a bottom has been seen. On the HUI, we think resistance on a rally will come in at 182 and that if prices are going to make a stand the 173.00 area needs to hold over the next three to five days.
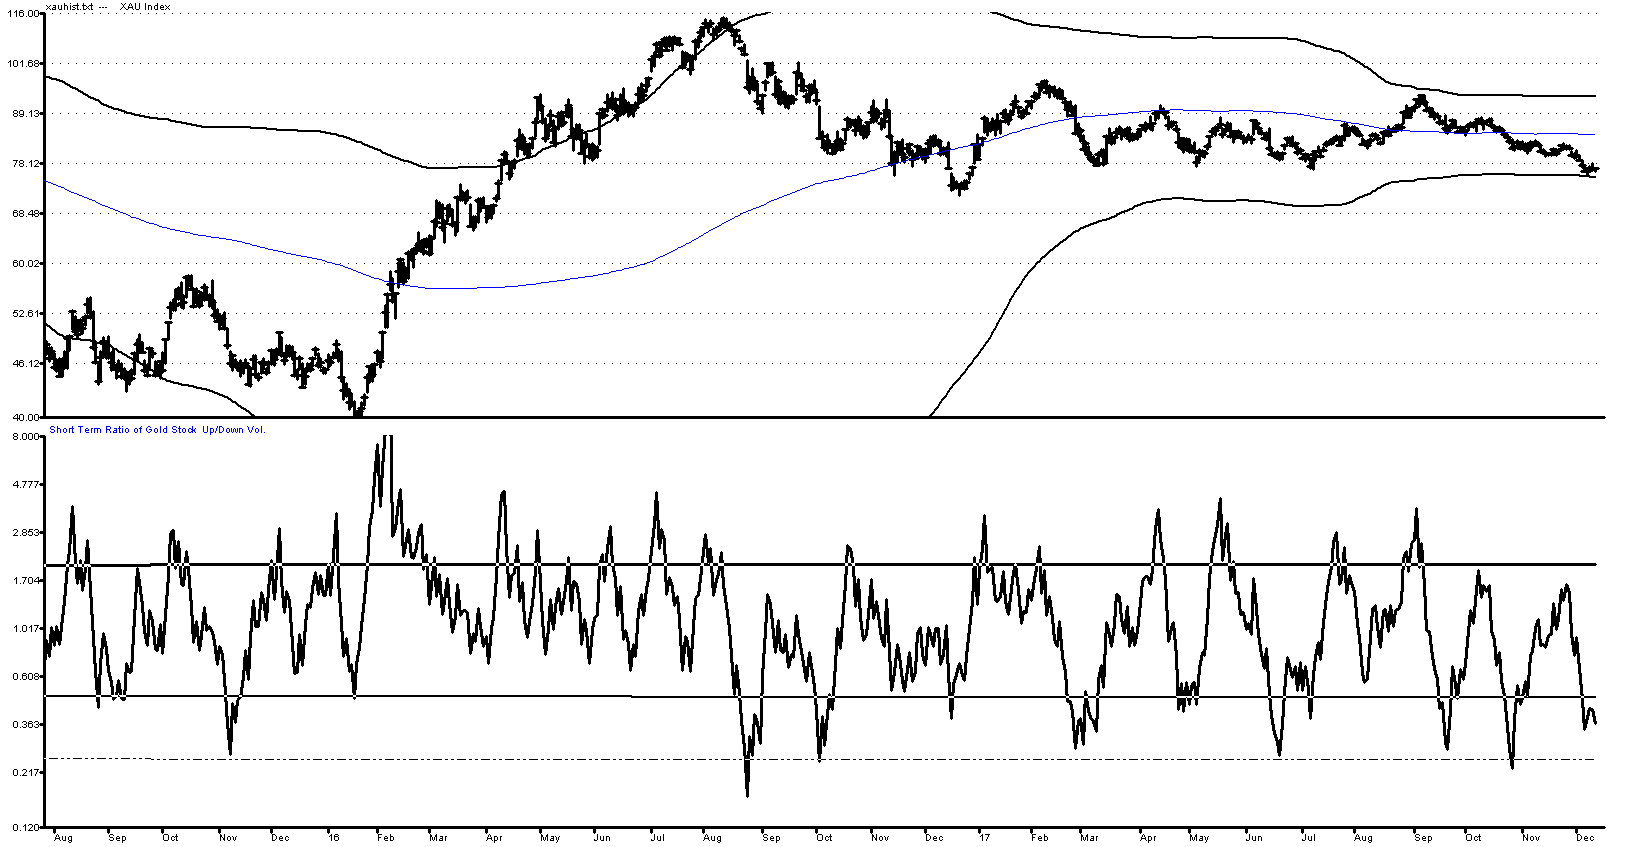
On the technical front, short term indicators like the McClellan Oscillator and the Up-to-Down Volume Ratio for gold stocks (above) are reasonably oversold with the Up to Down Volume Ratio at a reading of .36 as of Tuesday Dec 12th close. While it can still go lower, normally, if there is going to be a downside extension in prices we would see that break over the next one to three days and this gauge would move down to very dramatic oversold levels, the .25 area shown in the lower dashed line. That would then take more time to build a base. So we should know a good deal more over the next few days as to to whether gold Stocks and gold will make a stand at these levels or extend to the downside one more time.
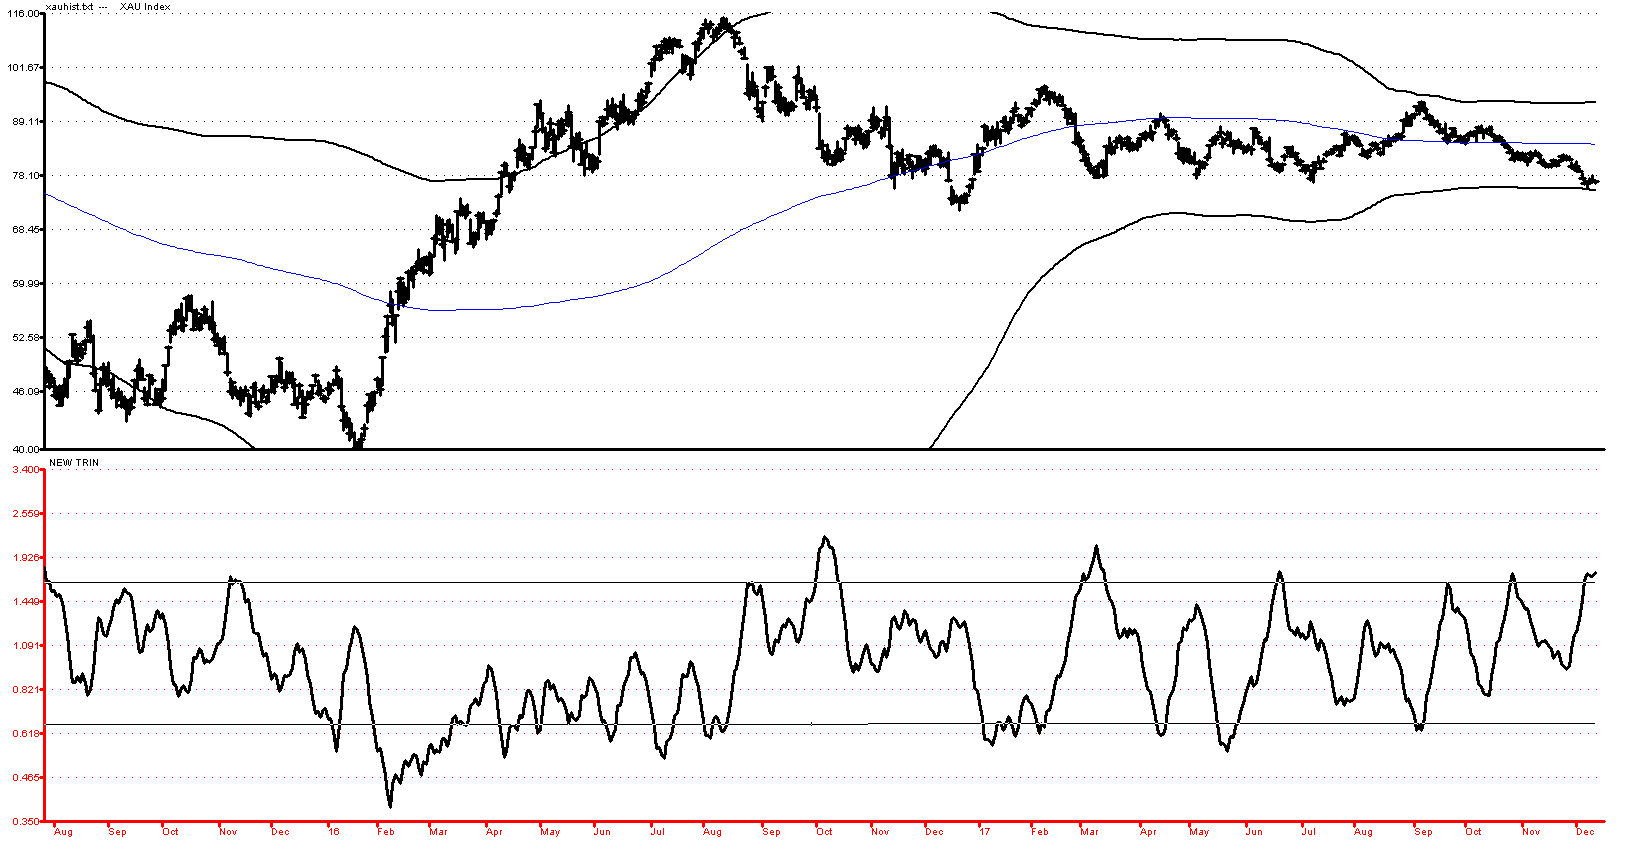
Other intermediate term gauges like the NEW TRIN (ARMS Index (bottom prior page) are just above key oversold thresholds with the NEW TRIN ending Tuesday at 1.748, Monday at 1.643 and last Friday at 1.711. These are all at least potentially consistent with the zone for a major low, but we would need to see some real sign of revival first from prices and then likely a divergent retest of these lows in a week to ten days before we could get a little more confident that a major bottom has formed. A move on physical gold back above $1270 would also be a good near term sign to watch for as a potential bullish change in the wind.
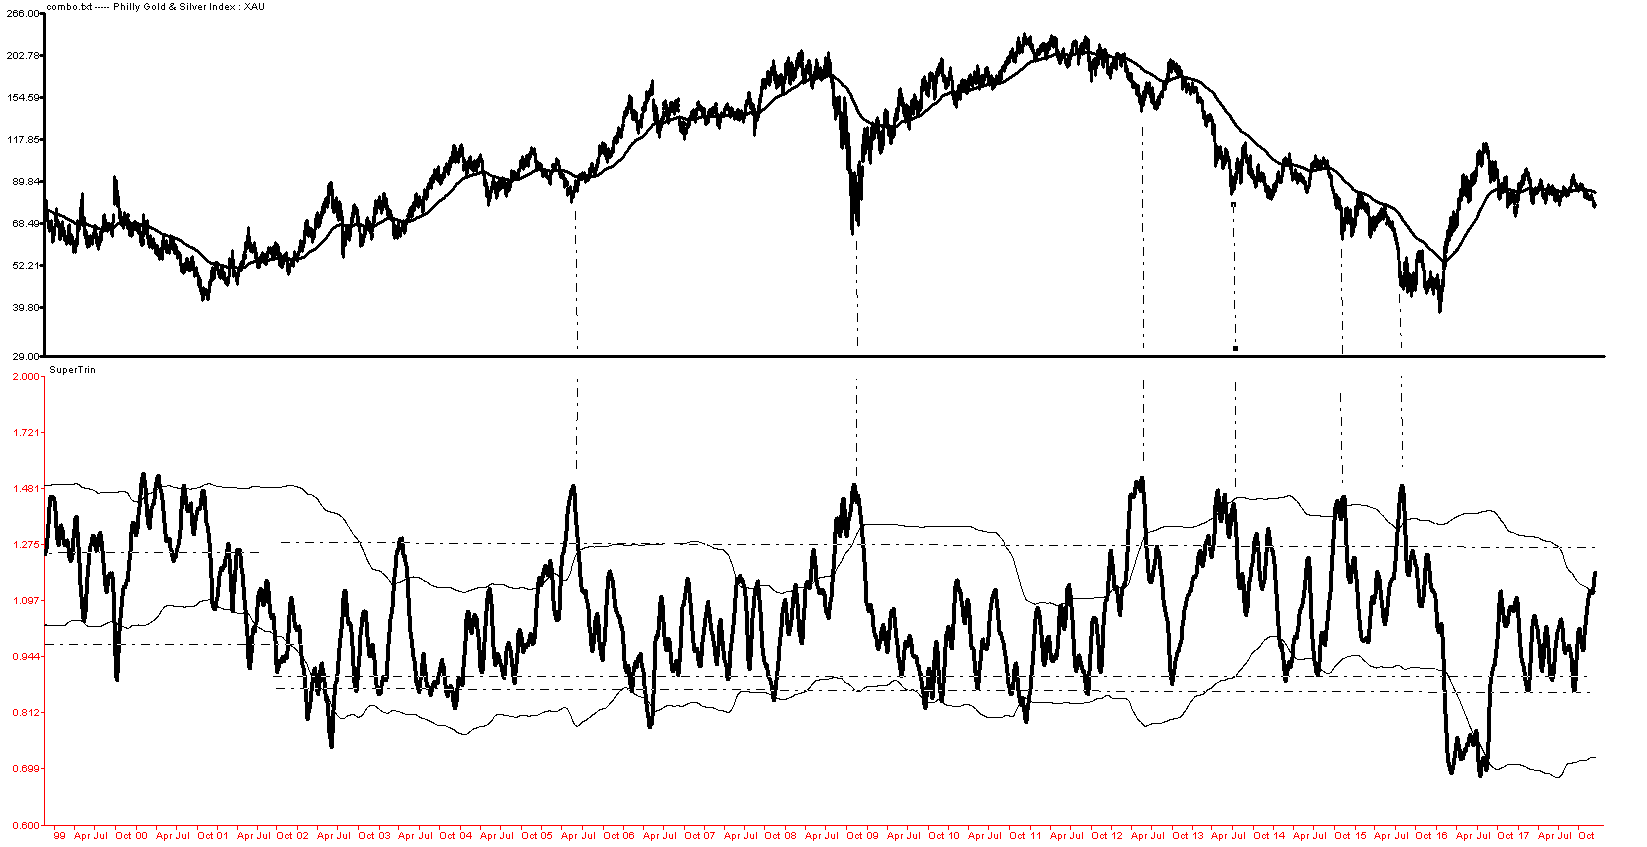
One reason to be holding back just a bit are the long-term gauges. In the case of the Super TRIN (above), we see that the indicator has been moving straight up over the last five to eight days and ended Tuesday at 1.18. Typically, major low values here range between 1.40 to 1.50 and since this looks like the end of a Primary Wave (2) pull back in gold stocks, we have to be contemplating these kinds of seminal values. Under that lens, it would seem to allow at least the potential for another 8 to 10 days of decent selling before those kinds of readings would be reached.
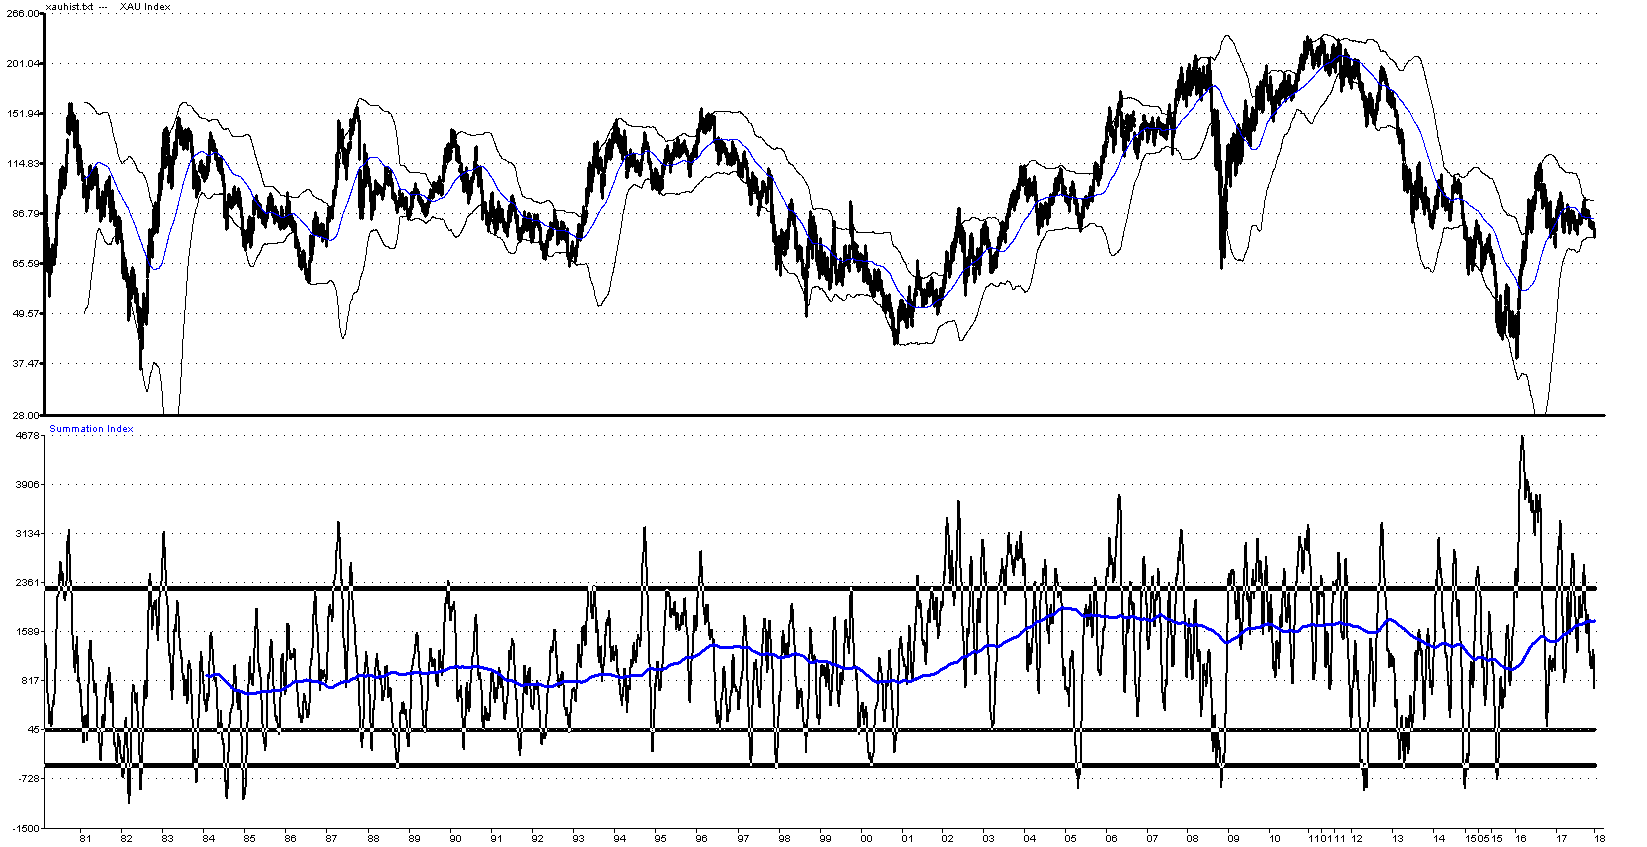
The same is also true of the longer range McClellan Summation Index (bottom clip-prior page) for gold stocks which is not yet down to its zero line, or even better, readings below -500. While some of history’s best bottoms have occurred in the -500 area on this gauge, many intermediate lows have developed near zero and with the gauge currently at +687, it could take several days of reasonable selling pressure on the gold stocks to generate that kind of oversold value – so the longer term gauges are making progress but are presently NOT oversold.
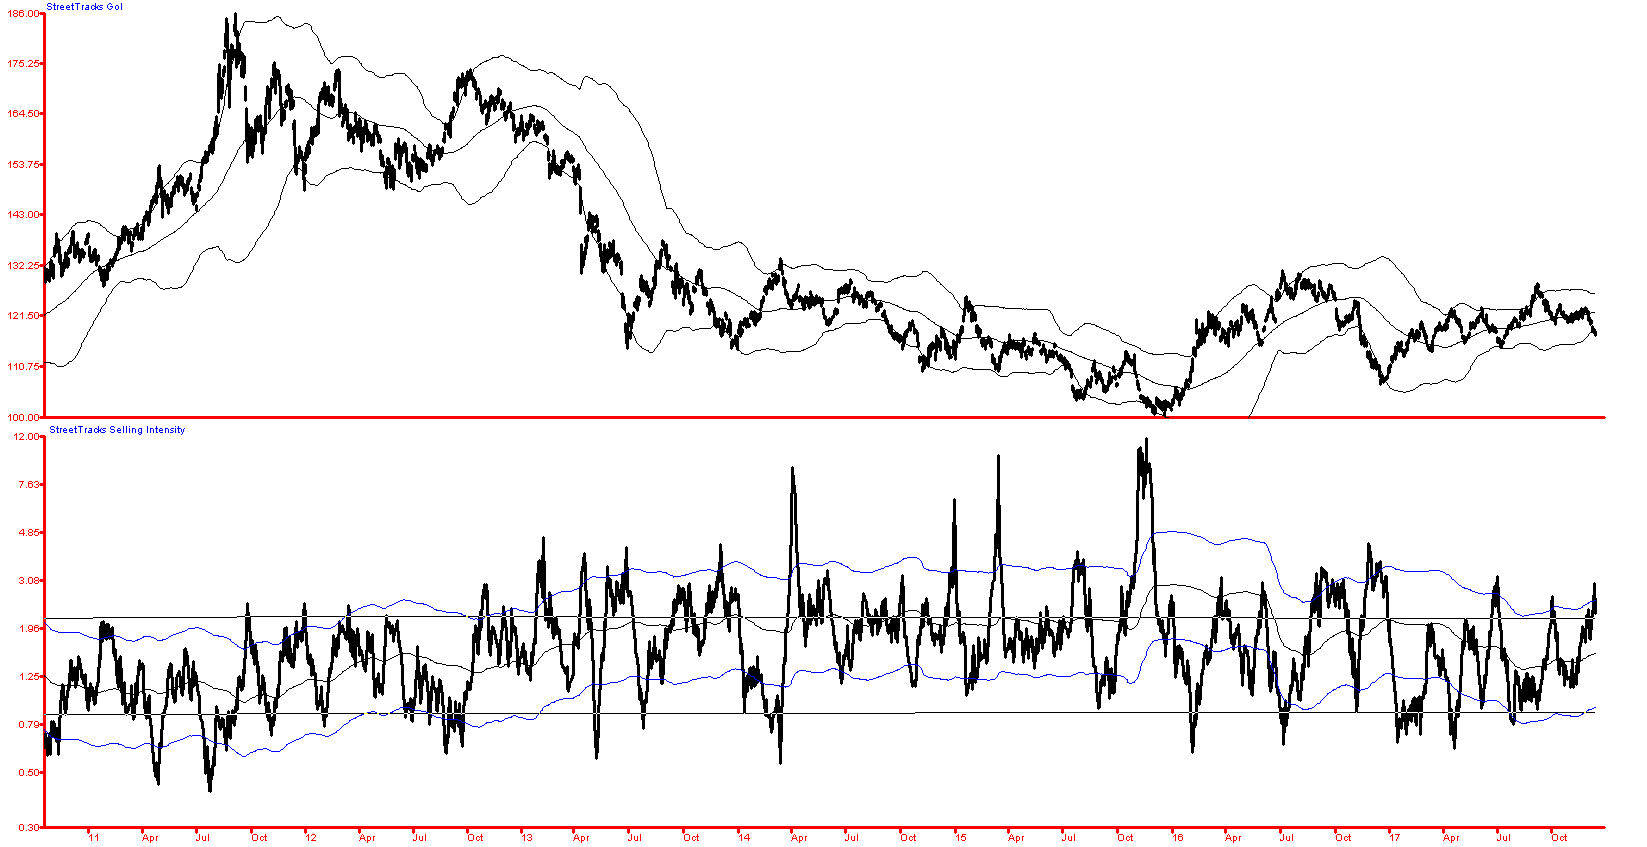
Finally, we also point out that the Selling Intensity Index for gold is high (oversold) showing fear, but is also not among the highest values of the last few years. Again, for a potential significant inflection point in the larger pattern, these readings are modest. While we can make a case that we could be near a low, at the moment, prices are in a clear near term down trend and we would need to see something that looks like a credible base develop from here, where downside momentum begins to dissipate before we get really bullish. Essentially, we would need some real evidence that the short term trend is changing from down to up and right now, gold is still soft.
Bottom Line: We still cannot be sure whether or not this sector is near an important bottom, but a number of indicators have moved significantly toward oversold values. We see high short-term downside momentum and so far, weak price action that is not enough to suggest a turnaround at hand. Our best guess is that on the bull side prices could try and rally and then retest over the next five to eight days and perhaps at that time we might see a set up that looks move enticing. On the bear side, any break in the near term by gold much below $1240 will probably just add fuel to the downside momentum already in place and could produce a panicky move down to lower levels in the mining stocks. As a result, at the moment, we are going to continue recommending a defensive stance and until we can get a better read on the very short term picture. We will continue with more regular updates in this time period as things are getting very interesting.
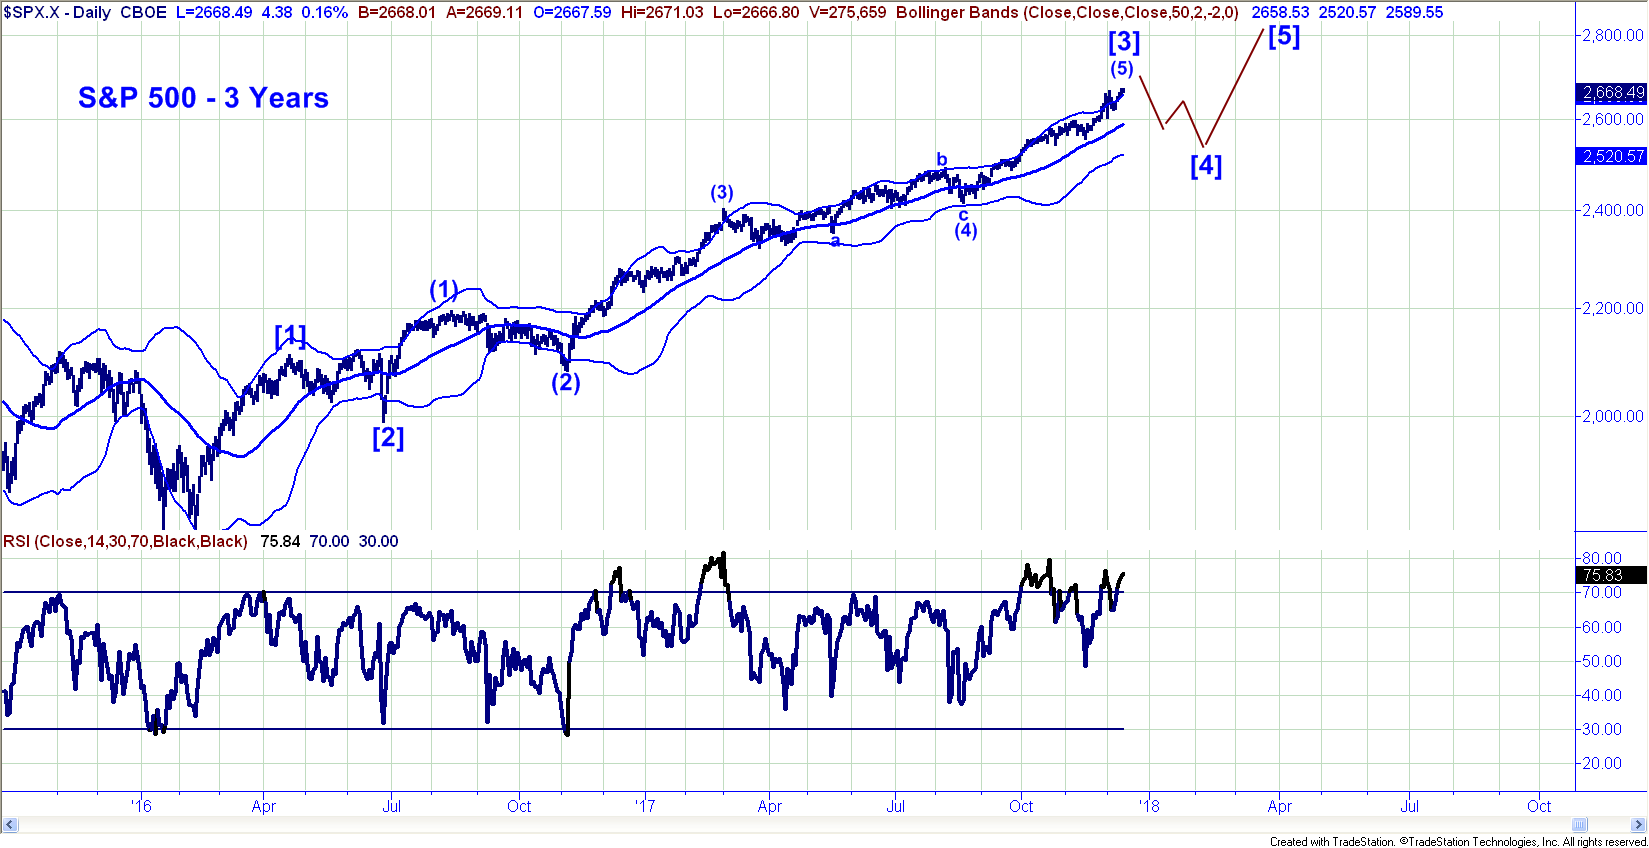
The stock market is still in a strong uptrend and looks capable of testing 2700 in the days just ahead. We strongly suspect that 2700 will be the high end of the range for the S&P for a number of weeks and that prices will likely peak in that area into year end. In our view, within internal strength weakening and the recent Ohama Titanic Sybdrome signals, we would not be surprised to see January roll in with a sharp downside corection in the stock market. Chances are that this would be a Intermediate Wave [4] pull back which could last 8 to 10 weeks and could set back price toward the high 2400 to low 2500 zone. A 7% to 8% correction between early January into Valentines day/late February could then be followed by a final surge to new all time highs (Intermediate Wave [5]) which would then end the bull and likely usher in a serious bear market by mid-year.
Right now, we would stand aside from stocks for all new money. Bonds continue to look bullish in our view and we like the long side of high quality Corporates and Treasuries.
*********
Disclosures: The Gold Stock Technician (GST) by Frank Barbera is offered to individuals to share some of our views on current markets. Materials in this report are copyrighted and proprietary to Gold Stock Technician and may not be reproduced or distributed without our expressed written approval. All rights are reserved. Past performance is no guarantee of future results. All opinions expressed constitute GST’s judgment as of the date of this report and are subject to change without notice. This information should not be used as the primary basis for investment decisions. It should not be assumed that any security transactions, strategies, holdings or sectors discussed were or will be profitable, or that future recommendations will be profitable or will equal the investment performance discussed herein. Investing in equities and other securities involves risk to your principal. Individual client account performance will vary and no guarantee of any kind is made as to the results that may be obtained from using these reports. These reports are impersonal and do not provide, nor are they intended to provide, individualized advice or recommendations for any specific audience or portfolio. To the maximum extent permitted by law, Gold Stock Technician, Frank Barbera disclaim any and all liability in the event that any information, commentary, analysis, opinions or advice contained in these reports proves to be inaccurate, incomplete or unreliable, or result in losses on any investment. The information provided in these reports is obtained from sources which the author believes to be reliable. However, the author has not independently verified or otherwise investigated all such information. Neither the author, nor GST guarantees the accuracy of any such information.
share
share
share
share
share

Frank A. Barbera, Jr. CMT joined Salem Partners Wealth Management in 2015 and has over 28 years of experience in the global capital markets. Prior to joining Salem, Mr. Barbera was an Executive Vice President and Co-Portfolio Manager for the Sierra group of mutual funds including the Sierra Core Retirement Fund (SIRIX) and the Sierra Strategic Income Fund (SSIIX) where he helped managed more than $2 Billion in assets. Prior to Sierra, Mr. Barbera worked with Caruso Affiliated Holdings where he successfully managed the Caruso USA Hedge Fund LLC navigating successfully through both the 2001-2002 and 2007-2008 bear markets. In 2007, Mr. Barbera penned a long series of weekly articles on Financial Sense.com, which remain archived online, forecasting in advance many of the major corporate failures that were seen in 2008, along with much of the breadth and scope of the 2008 global financial crisis.
In 2003, Mr. Barbera was featured in the popular book published by the New York Institute for Finance entitled “Master Traders: Strategies for Superior Returns from Today’s Top Traders” Over the last two decades, Mr. Barbera has functioned in the role of Investment Strategist, Global Macro Economist, Portfolio Manager and Market Technician. From 1994 to 2012, he edited the bi-monthly newsletter, “The Gold Stock Technician” which focused on the technical outlook for equity and metals markets with a special focus on mining stocks. Mr. Barbera specializes in rules based trend following systems for both high and low volatility securities.
From 1991 to 2000, Mr. Barbera hosted two daily live television shows on the Business Channel, “ChartWatch” and “Technically Speaking”. From 1998 to 2013, Mr. Barbera acted as a consultant to several large scale institutional trading desks including Bel Air Capital in Los Angeles as a trading advisor on their multi-billion dollar Core Equity portfolio.
A student of Austrian School Economics and Minsky Boom/Bust credit market dynamics, Mr. Barbera has been widely quoted in the media and on TV including Fox Business News, CNBC, The Wall Street Journal, Investor’s Business Daily, Money Magazine, the Washington Post and Barron’s, Mr. Barbera is a frequent guest speaker at Investment Conferences across the United States, where he remains in high demand.


