Technical Analysis Of The Gold Price


 NOT time to panic, YET…but time to be on your guard.
Many analysts claim that if you decide that a security is not a BUY, then it must be a SELL. There is, of course, a great space between these two conditions. That space is occupied by the HOLD. This is one of those HOLD times for gold speculators.
Charts can be quite confusing at times, and if you look at more than one chart, confusion doubles. That’s why I like to keep things simple but even I look at more than one chart and at times two charts give me two somewhat different stories. My basic chart is one like that which is shown here, with basic indicators. That’s all one needs to understand what’s happening in the market. The second most popular chart that I look at is the point and figure chart (shown two weeks ago). I like this type of chart for its simplicity. I look at it as confirmation on break-outs and trends. My point and figure technique is especially useful while speculating in the penny resource stocks where the limited market action often does not lend itself to analysis in the conventional technical manner.
Today, there is a little difference in the two types of charts as they relate to gold. So let’s get to it.
Short-Term Gold Price
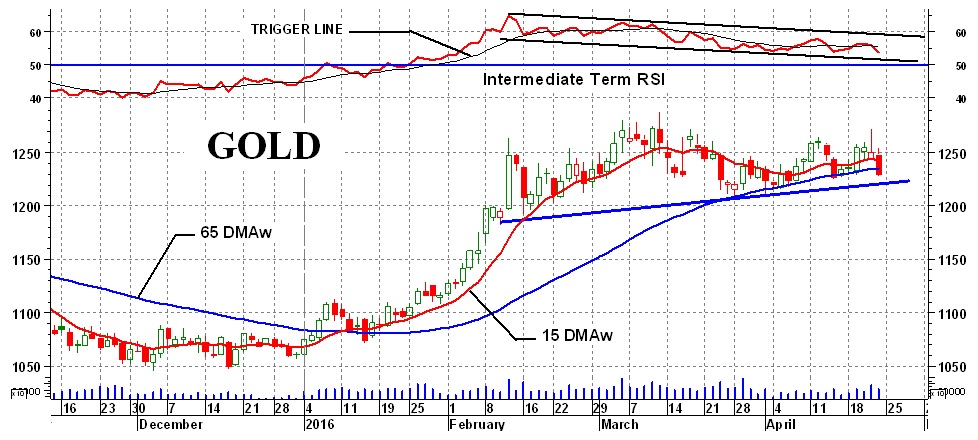
Friday saw the price of gold drop below the short term moving average line and force the line to start a downward sloping trend. However, the basic price activity may be seen as primarily a lateral or sideways trend although with a very minor tinge to the up side. The short-term momentum indicator (not shown) has also been tracing a lateral trend over the past few weeks and has been bouncing above and below its neutral line. This is a neutral sign until the indicator breaks either above or below its recent activity to suggest the direction of the forthcoming price strength. From this, I would rate the short term as – NEUTRAL, i.e. neutral but trending towards the negative.
The short to intermediate-term point and figure chart has now crossed below its up trend line and has moved below one recent low. It still needs to move to $1225 to get below two recent lows and indicate a bearish signal, thereby nullifying the previous point and figure projections.
Intermediate-Term Gold Price
The chart clearly indicates the intermediate-term action. The gold price just inched below the intermediate term moving average line on Friday however the line itself is still in an upward slope. Over the past 4 weeks, the price action has been very slowly meandering in an upward direction but without much enthusiasm. This sideways upward drift is also reflected in the momentum indicator. There are many things one can determine from this momentum indicator which I wouldn’t go into today. It does show that the momentum has been steadily moving lower but still remains in the positive zone.
There are three price activities that could cause the momentum indicator to show weakness. First, the price upward move starts to get weaker (i.e. possibly reaching for a top). This occurred in February and early March. Next, the price activity starts to move lower. This should be self-evident. The third condition is when the price goes into a lateral trend. When a price trend moves sideways neither advancing nor declining (i.e. trending neutral) the momentum should also reflect this neutral trend. If the momentum indicator is still in its positive zone reflecting strength it will, therefore, continue to move lower just to get to its neutral level. Often, analysts mistakenly see this as a negative but it is just what comes naturally for the indicator.
In our case here the momentum indicator has actually halted and is moving sideways at about the 55% level, with the sideways trend of the price. What this suggests is that the sideways price trend is more like a slightly upside lateral trend. A pure lateral trend would have the momentum continuing to move towards its neutral line. More on reading the momentum indicator during my simple tutorials at my Facebook page.
From the standpoint of rating the intermediate term, I would rate it as + NEUTRAL due to concern should the price continue to move lower.
Head & Shoulder (H&S) Pattern
The H&S pattern was mentioned a few weeks ago and is still in its development stage. A crossing to the down side below that neckline would complete the pattern. It is showing an elongated right shoulder but this is not unusual. Should the price action break below this neckline, all bets are off in the short term.
Point & Figure (P&F) Chart
The short/intermediate term P&F chart was mentioned above. A move to the $1225 level would break below that up trend line from the 2015 bottom and move below two previous lows for a bearish signal, nullifying the previous bullish signal.
The intermediate term P&F chart would require a move to the $1210 level, or more realistically the $1200 level for a bear signal.
The long term P&F chart requires a move to the $1200 level for a bear signal or a move to the $1290 level for a continuation of the long-term bull move.
Gold And Silver Stocks
Looking at the various industry Gold Indices, they are all still some distance from breaking into new highs after the debacle of 2013. Not so my Merv’s Gold & Silver 100 Index. My Index of 100 gold and silver stocks is well into new high ground since the 2013 debacle. The average price of these 100 stocks is far out performing the heavily large capitalized weighted Indices. This suggests that the secondary stocks are outperforming the larger stocks, which is what one would like to see for a bull market to have wings.
On the short term, the 100 stocks have a BULL/BEAR rating of 78% bullish and 11% bearish. On the intermediate term, we have 87% bullish and 9% bearish while on the long term we have 95% bullish and 4% bearish. While these ratings look very good the only problem is that there is only one direction for them to move now, lower. They could stay at about these levels for some time but the turn will come.
********
Readers are invited to view my Facebook page at https://facebook.com/merv.burak where I will be slowly posting commentaries explaining in more detail my various indicators and techniques. I also present from time to time some individual stocks that look as if they may be good speculations. However, nothing I post is meant to be a recommendation to buy or sell. One should check with their broker or investment advisor before acting.
 Merv is a retired Aerospace Engineering consultant. He is also a retired market technician with over 40 years of market experience and research. Merv received his certification as a Chartered Market Technician (CMT) in 1992. Developer of many technical techniques and programs which he has been using in his previous Technically Speaking with Wil-Arm and Technically Precious with Merv commentaries posted throughout the globe. Developer of several gold and silver Indices, Merv continues to update his Merv’s Gold & Silver 100 Index and Merv’s Penny Arcade 50 Index and reviews them during his periodic on-going Technically Precious commentaries.


