Technical Analysis Of Major Markets


 SPX: Long-term trend - Bull Market?
Intermediate trend – SPX is in the midst of an intermediate correction (at least).
Analysis of the short-term trend is done on a daily basis with the help of hourly charts. It is an important adjunct to the analysis of daily and weekly charts which discusses the course of longer market trends.
TESTING IMPORTANT LEVELS
Market Overview
“Last week, the SPX gave a strong indication that it had completed the counter-trend rally which started from 1865 on 8/24.”
And the following week (last week) confirmed the resumption of the decline by dropping to 1909, where it met with support and rallied to 1952 before pulling-back and closing at 1932.
The area between 1903 and 1911 is a strong support zone which has arrested near-term declines before. The upper level was tested again on Thursday and produced a 40-pt rally. From an EWT perspective, this can be attributed to the possible completion of wave 3 from 2020. The bounce to 1952 would then be wave 4 and the pull-back from that level potentially being the beginning of wave 5. That is one theory! Others already see the completion of 5 waves from 2020 to 1909 which, if correct, would be followed by a very weak wave 3 that would most likely drop to a new low.
Either way, if (when) the 1911 and 1903 levels give way, we could expect to test the former low of 1867 once again. Even if we did complete a 5 wave pattern down to (cr.) 1867, that may produce only a temporary pause in the entire downtrend from 2135. There are lower projections, some of them potentially much lower. How the index handles the 1911/1903 and the 1867 support could give us some clues concerning whether or not we have started a bear market.
Intermediate Indicators Survey
The weekly MACD continues to make new lows (currently -32.77) while SRSI gave up its brief attempt at reversing and turned down again.
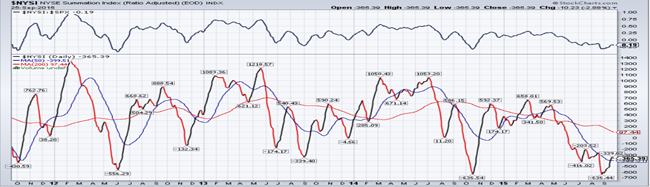
The weekly cumulative A/D made a fractional new low last week. The NYSI will be discussed below.
The 3X P&F chart is testing a very important level at 1911 which, if broken, will enable lower projections to materialize. The entire formation since the 1867 low could turn out to be a re-distribution pattern instead of a consolidation.
Chart Analysis
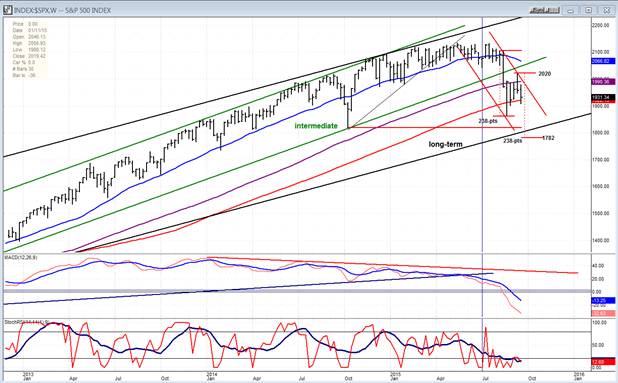
The Weekly SPX chart (courtesy of QCharts.com, as well as others below) provides us with some important clues about what the index is doing. First, if we look at the MACD, we must acknowledge that whatever we are doing is still in process since it is very negative and continues to make new lows week after week. The NYSI posted below rallied along with price but last week, just started ticking down again.
Getting back to the price action: we are in a well-defined declining channel which is at least of intermediate nature because we broke below the green intermediate channel line. Since making its initial low, the index has had a rally which stopped at the top red channel line, preventing it from fully back-testing the broken intermediate trend line.
Also worth noting is that for the past five weeks, price action has essentially been confined between the 90-wk MA and the 120-wk MA. The latter has been violated three times, and all three times it prevented the index from closing below. At the same time, the former has stopped all attempts at rallying. The one which finally gives way will indicate the direction of the next short-term trend.
Since neither indicator appears ready to warn about a reversal of the downtrend, our assumptions should lean toward further weakness. A good case can be made for a measured move down to 1782. That potential is enhanced by the fact that there is a re-distribution count in the P&F chart which projects to 1785. Considering that the time frame into October is more often than not a very negative period for the stock market, I would not dismiss the possibility of reaching that target by the middle of next month.
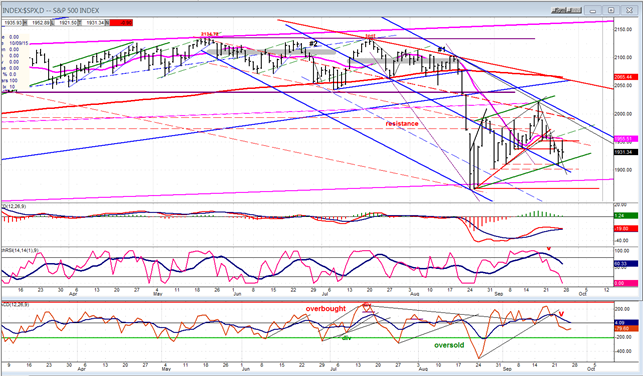
On the following chart of the Daily SPX, we can see the price action in more detail. What stopped the decline to 1909 is not so much the support from the former short-term low, but that provided by the conjunction of the blue and green parallels (especially the green one), plus the filling of the 1911 phase count. Breaking the green trend line is likely to signal the start of the next leg down. Should this happen, the next support is on the pink line (1880), and at the former low (1867) which also coincides with the next phase count to 1869.
Of the indicators, only the SRSI is oversold, but there is no sign of turning, and this is the level at which it was when the market broke support and dropped sharply, last time. If the MACD, which is currently neutral, makes a bearish cross, we can expect the decline to continue. The A/D is declining but has not yet reached oversold. There is no positive divergence showing anywhere.
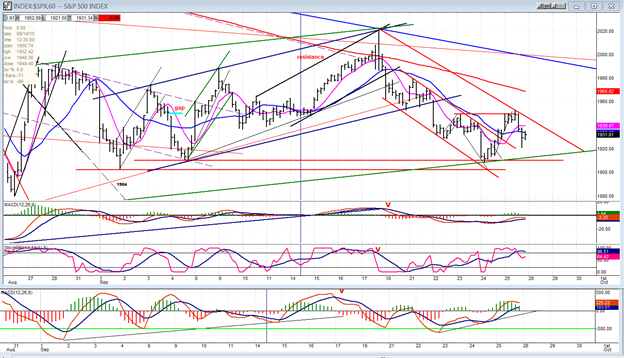
On the Hourly chart, it’s unclear if the index is ready to break support right away or needs to do a little more preparation first. The indicators have turned down, but only the SRSI MAs have crossed. Until they all do, prices should remain above 1909, and it is possible that we have only completed wave “b” of an a-b-c correction. However, when that level is penetrated, expect a sharp plunge right away. We are in the last stages of some declining cycles and during such periods, very little time is spent on short consolidations.
A drop below the green trend line could quickly lead to the next target of about 1869.
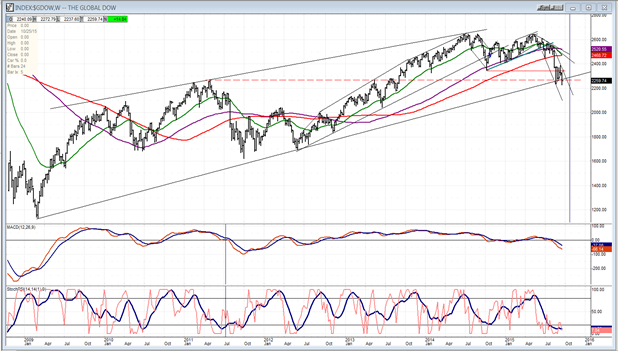
GDOW (Global Dow)
This week, we’ll look at the Global Dow. It is an index made up of 150 blue chip stocks from around the world. Consequently, the collectivel trend of the most prestigious companies in the world cannot be ignored.
What do we see when we look at this chart? The index broke its intermediate trend line at the same time that it traded below its 90-wk MA. In one fell swoop, it also fell below its 120-wk MA and its October low by a wide margin. That initial decline stopped on the long-term uptrend line from March 2009. Last week, it resumed its decline, made a new low, and closed slightly below that trend line for the first time.
Since it double-topped on 5/10, GDOW has been leading the SPX on the downside. Until this trend reverses itself, we have to assume that it will continue. Based on this assumption, it should only be a matter of time before the SPX trades below its former low of 1867 and confirms its intermediate downtrend. Some may also take this action (should it happen) to be that we are now in a confirmed bear market.
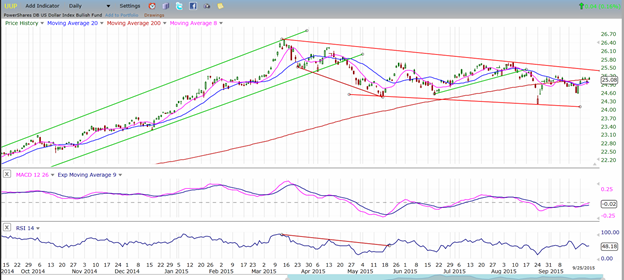
UUP (dollar ETF)
UUP continues to look as if it wants to resume its uptrend. This will become a reality when it can trade above the downtrend line which has not been challenged, yet. For now, it is dealing with its 200-DMA. Each time it has fallen below it, there was a quick attempt at getting back above. If it cannot rise above it conclusively soon, it risks turning its trend back down.
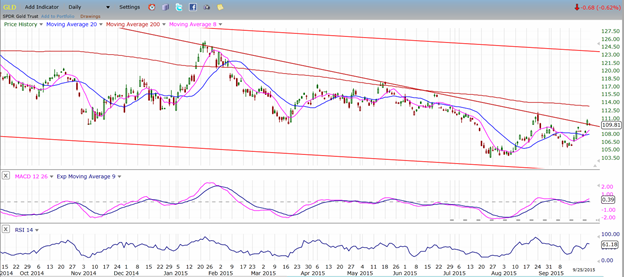
GLD (Gold Trust)
The longer-term cycles which bottomed in August are beginning to make their presence felt. First, they stopped the index from completely filling the projection to 100/102 which had been established as a result of massive distribution after it had made an all- time high at 185. Next, a second attempt at reaching that projection fell short and established 103.43 as a credible low. The fact that it has had a good rebound after that retracement suggests that the 25-26-wk cycle may have bottomed a couple of weeks early.
The index is now challenging the downtrend line from the January top and has already violated it. But even if it makes a clean break above, the 200-DMA lies in wait a couple of points higher to stop the move. At the same time, GLD will run into the sizeable distribution area between 112-115 which stopped the initial bounce. Finally, a significant rally from this level would be more credible if a base had been established. A few more reversals in this general area may be necessary before the index is ready to start a serious uptrend.
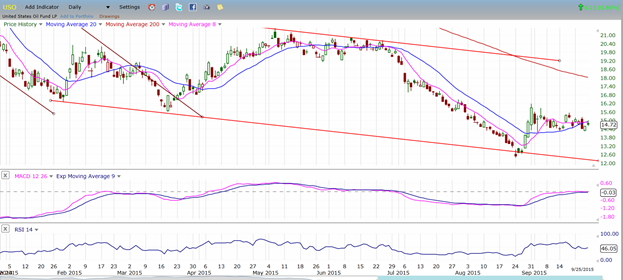
USO (US Oil Fund)
USO has only gone sideways since its initial rally from the 13 target. This has established a base of about 9 points which could send it to about 24 if it starts to trade aggressively above 16. This is its short-term potential! Long-term is another matter! Potential downside targets have yet to be filled by WTIC. The price is currently 45. Computer evaluation of the distribution pattern in the 90’s gives it a bearish objective of 15! These projections are not infallible, but it is something to ponder about the future of oil.
Summary
The best technical evaluation of the chart pattern that SPX is making is that the index has started another down-phase that could turn out to be similar to the first one, which had a decline of about 250 points. Should it be exactly the same, the index could drop to 1780 over the next few weeks.
In order to confirm this possibility, SPX will have to show that it can trade below 1909 and then make a new low below 1867. Should it spend the next couple of weeks consolidating above 1867 and then start to rally, a new evaluation of the index’s technical position will have to be made.
********
FREE TRIAL SUBSCRIPTON
Market Turning Points is an uncommonly dependable, reasonably priced service providing intra-day market updates, a daily Market Summary, and detailed weekend reports. It is ideally suited to traders, but it can also be valuable to investors since highly accurate longer-term price projections are provided using Point & Figure analysis and Fibonacci projections. Best-time reversal estimates are obtained from cycle analysis.
For a FREE 4-week trial, send an email to: [email protected]
For further subscription options, payment plans, weekly newsletters, and for general information, I encourage you to visit my website at www.marketurningpoints.com. By clicking on "Free Newsletter" you can get a preview of the latest newsletter which is normally posted on Sunday afternoon (unless it happens to be a 3-day weekend in which case it could be posted on Monday).
The above comments and those made in the daily updates and the Market Summary about the financial markets are based purely on what I consider to be sound technical analysis principles. They represent my own opinion and are not meant to be construed as trading or investment advice, but are offered as an analytical point of view which might be of interest to those who follow stock market cycles and technical analysis.

When Andre Gratian was a stock broker years ago, a friend introduced him to technical analysis of the market. Consequently, it is not an exaggeration to say that Andre fell in love with this approach! Ever since then, it has become an increasingly important part of his professional life. Gratian has studied the works of Wyckoff, Edwards & Magee, Edward J. Dewey (cycles) and many others. However, one of my most profitable undertaking has probably been to study Point & Figure charting, which he finds invaluable in analyzing stocks and indices. If he were restricted to one methodology, this is the one that he would choose. This well-rounded background has given him what he feels to be a special insight into the stock market, facilitating the recognition of meaningful patterns and the ‘turning points’ in all trends, whether they be short or long term. Andre feels very comfortable discussing the stock market and passing on meaningful information to others. His subscribers include individuals and money managers throughout the world. Moreover, his Newsletters are currently published on several financial sites, here and abroad.


