Technical Analysis Of Major Markets


SPX: Long-Term Trend - Bull Market
Intermediate trend – SPX has resumed its uptrend in order to complete the last phase of the bull market.
Analysis of the short-term trend is done on a daily basis with the help of hourly charts. It is an important adjunct to the analysis of daily and weekly charts which discusses longer market trends.
LOOKING FOR A (TEMPORARY?) LOW
Market Overview
The first phase of the correction from 2116 was mild but, after a brief hold, the decline accelerated into Friday, bringing the total loss to almost 100 points. The short-term is now very oversold and some positive divergence is beginning to appear in the hourly indicators. The vicinity of some key projections levels have also been reached, all of which, under normal circumstances, would call for at least an oversold rally. However, Friday night’s terrorist attack in Paris may delay a recovery although, by Monday morning, emotions will have had a chance to somewhat subside.
A more important question about whether or not we have made a short-term low is, what does all this weakness mean? Is it only the volatile nature of the market which tends to reach its objectives quickly, or should we start having some second thoughts about the generally accepted notion that we are in wave V? It’s too early to pass final judgment on the market’s position, and we should not feel pressured to do so. The next couple of weeks should clarify where we are in the current bull market, and what we can expect the near future to bring. For now, let’s go through the charts to see what they tell us – to date!
Intermediate Indicators Survey
As a result of the correction, the weekly MACD flattened at -4.60 and the histogram lost ground but remained positive.
The weekly SRSI brought its shorter MA down to the longer one, but did not go through.
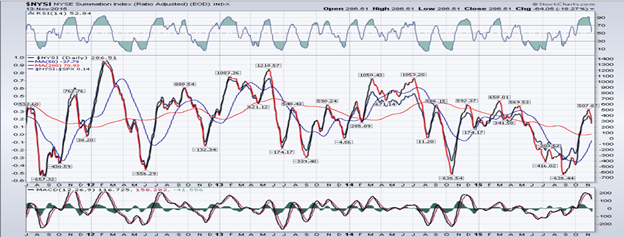
The NYSI (courtesy of StockCharts.com) peaked at last week’s 508 and started to correct a very overbought RSI and MACD to a more normal level. Those indicators remain in an uptrend, as does the index itself.

Both 3X and 1X P&F charts point to the current level for a low.
Chart Analysis
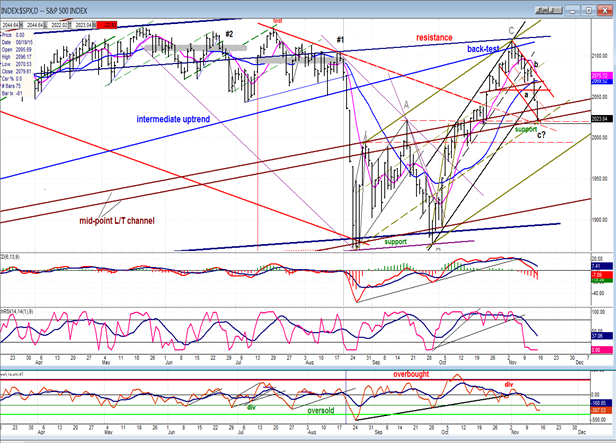
Daily SPX chart (courtesy of QCharts.com, as well as others below).
Last week I mentioned that the path of the SPX should be easy to track. It still is, in spite of this week’s weakness.
Two short term uptrend channels are drawn on the chart. The black, which encompassed the uptrend from 1872, and the broader green one which delineates the longer trend from 1867. The trend from 1872 was steep and kept within the upper half of the black channel. When it broke into the lower half of the channel, it paused briefly and then came out of the channel entirely. On Friday, it stopped on a parallel drawn from the 1867 level after retracing about two-thirds of that broader channel. This corresponds with all sorts of trend lines, tops of former moves, P&F and Fib projections, and the bottom of the small red channel which defines the current downtrend. In other words, a logical point for support and a bounce. Should we get one, we will have to determine if the rally we get is a resumption of the uptrend from 1872 and the continuation of the assumed primary V wave, or if it’s just a rally in a downtrend from the 2116 top which will retrace only part way and then continue to decline to the bottom of the broader green channel. If this is what happens, we are back to the theory that the 5/20 high of 2135 is the bull market high, and that the rally to 2116 simply completed a large A-B-C (marked in grey) wave II correction! This will become more plausible if, after a bounce, the index makes a 5th wave down to about 2000 or lower. This is what we must decide over the next couple of weeks. No rush! Just follow the market’s action. It will reveal itself.
The indicators are all in a downtrend, although the A/D oscillator is beginning to show some divergence but the momentum indicators will need to do more work and may need to rally and then have a final decline. This places the current bias on 2116 being the top of a “C” wave and not a primary V in progress.
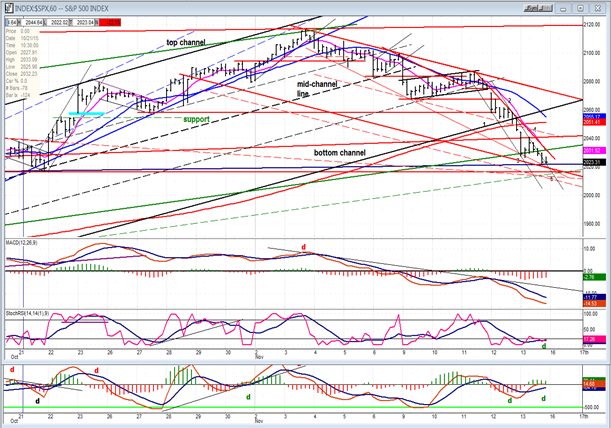
Hourly SPX Chart
On the hourly chart, I have labeled the waves of the second phase of the decline to show that there are 5 distinct waves, and that wave 5 is showing some deceleration, which is typical of this wave. It also shows how the first phase traded in the top half of the red channel and then accelerated to the bottom of the channel (which could widen to the dashed line). The acceleration really came when prices broke out of the black uptrend channel. Now, the index has declined to a level of support mentioned in the daily chart analysis and, technically, should hold around this level providing that Friday night’s terrorist attack in Paris does not have a major impact on the market.
The hourly indicators tend to support the view that this decline should end around here with the A/D oscillator showing the most positive divergence, with some also reflected in the SRSI. The MACD is still declining, but the histogram has begun a minimal uptrend.
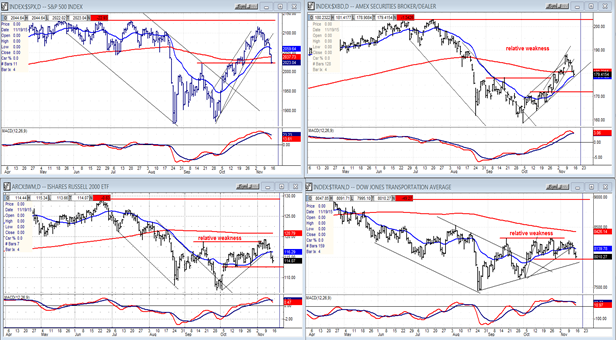
XBD (American Securities Broker/Dealer) And More
All three of the leading/confirming indexes (XBD-IWM-TRAN) showed some clear relative weakness to the SPX during the rally phase, especially the bottom two. They were correct! Now, what are they saying? Nothing conclusive, so far. Their retracements over the past two weeks have been proportional to that of the SPX, although XBD has shown some reluctance to follow by refusing to break its uptrend line. Unless this changes drastically on Monday, it would indicate that we are ready for a bounce.
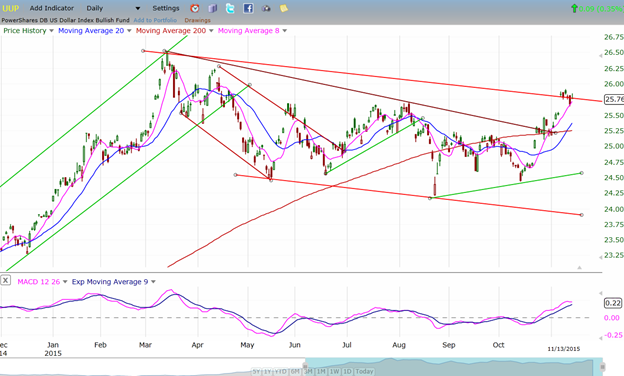
UUP (Dollar ETF)
UUP has paused at the top of its correction channel, but there is no sign of selling and if it can’t even retrace its gap completely, it’s a sign of strength which should lead it to new highs before too long. The P&F projection is at about 29, so there is plenty of room on the upside if its intention is to fill that projection. That should put the dollar at about 113 or a little higher before it tops out.
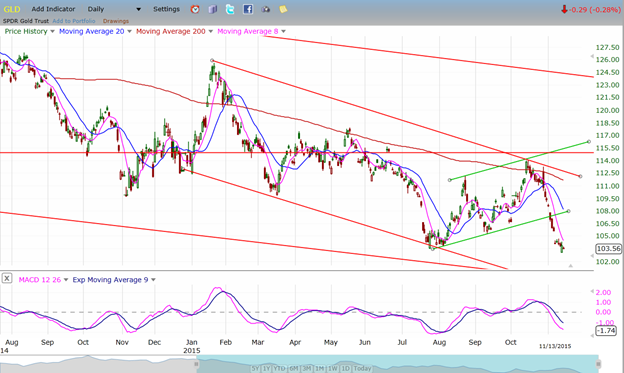
GLD (Gold Trust)
After creating some uncertainty, GLD looks as if it will have no problem reaching my projection of 100. Since that does not look to be that far away, it is going to create a dilemma with the dollar anticipating higher prices. Can GLD hold this level while the dollar continues to rise? Perhaps it will simply build a base and start moving up after the dollar peaks! Of course, it could also continue to decline beyond 100!
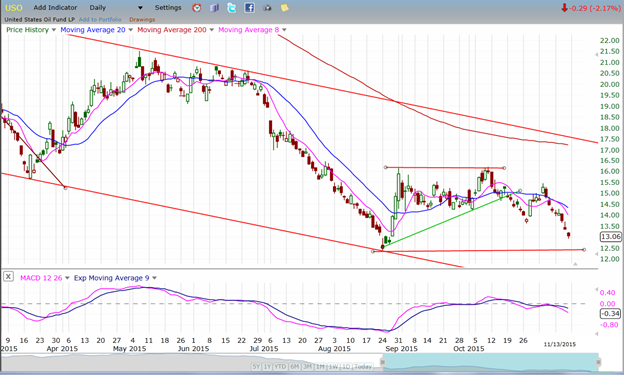
USO (United States Oil Fund)
Oil continues to show that its long term weakness is persisting. After meeting its 13 projection, an attempt at re-starting an uptrend has failed. It is now re-testing the low. If it fails to hold, 8 is a good possibility. WTCI has a potential count of 35.
Summary
In the past week, the market correction has greatly accelerated. It is not yet time to dismiss the present rally’s capability to make a new bull market high; but if the current trend continues, the projected primary wave V structure may have to be revised to an A-B-C wave II correction.
********
FREE TRIAL SUBSCRIPTON
Market Turning Points is an uncommonly dependable, reasonably priced service providing intra-day market updates, a daily Market Summary, and detailed weekend reports. It is ideally suited to traders, but it can also be valuable to investors since highly accurate longer-term price projections are provided using Point & Figure analysis and Fibonacci projections. Best-time reversal estimates are obtained from cycle analysis.
For a FREE 4-week trial, send an email to: [email protected]
For further subscription options, payment plans, weekly newsletters, and for general information, I encourage you to visit my website at www.marketurningpoints.com. By clicking on "Free Newsletter" you can get a preview of the latest newsletter which is normally posted on Sunday afternoon (unless it happens to be a 3-day weekend in which case it could be posted on Monday).
The above comments and those made in the daily updates and the Market Summary about the financial markets are based purely on what I consider to be sound technical analysis principles. They represent my own opinion and are not meant to be construed as trading or investment advice, but are offered as an analytical point f view which might be of interest to those who follow stock market cycles and technical analysis.

When Andre Gratian was a stock broker years ago, a friend introduced him to technical analysis of the market. Consequently, it is not an exaggeration to say that Andre fell in love with this approach! Ever since then, it has become an increasingly important part of his professional life. Gratian has studied the works of Wyckoff, Edwards & Magee, Edward J. Dewey (cycles) and many others. However, one of my most profitable undertaking has probably been to study Point & Figure charting, which he finds invaluable in analyzing stocks and indices. If he were restricted to one methodology, this is the one that he would choose. This well-rounded background has given him what he feels to be a special insight into the stock market, facilitating the recognition of meaningful patterns and the ‘turning points’ in all trends, whether they be short or long term. Andre feels very comfortable discussing the stock market and passing on meaningful information to others. His subscribers include individuals and money managers throughout the world. Moreover, his Newsletters are currently published on several financial sites, here and abroad.


