Technical Analysis Of Major Markets
 share
share
 share
share
 share
share
 share
share
 share
share
Gold
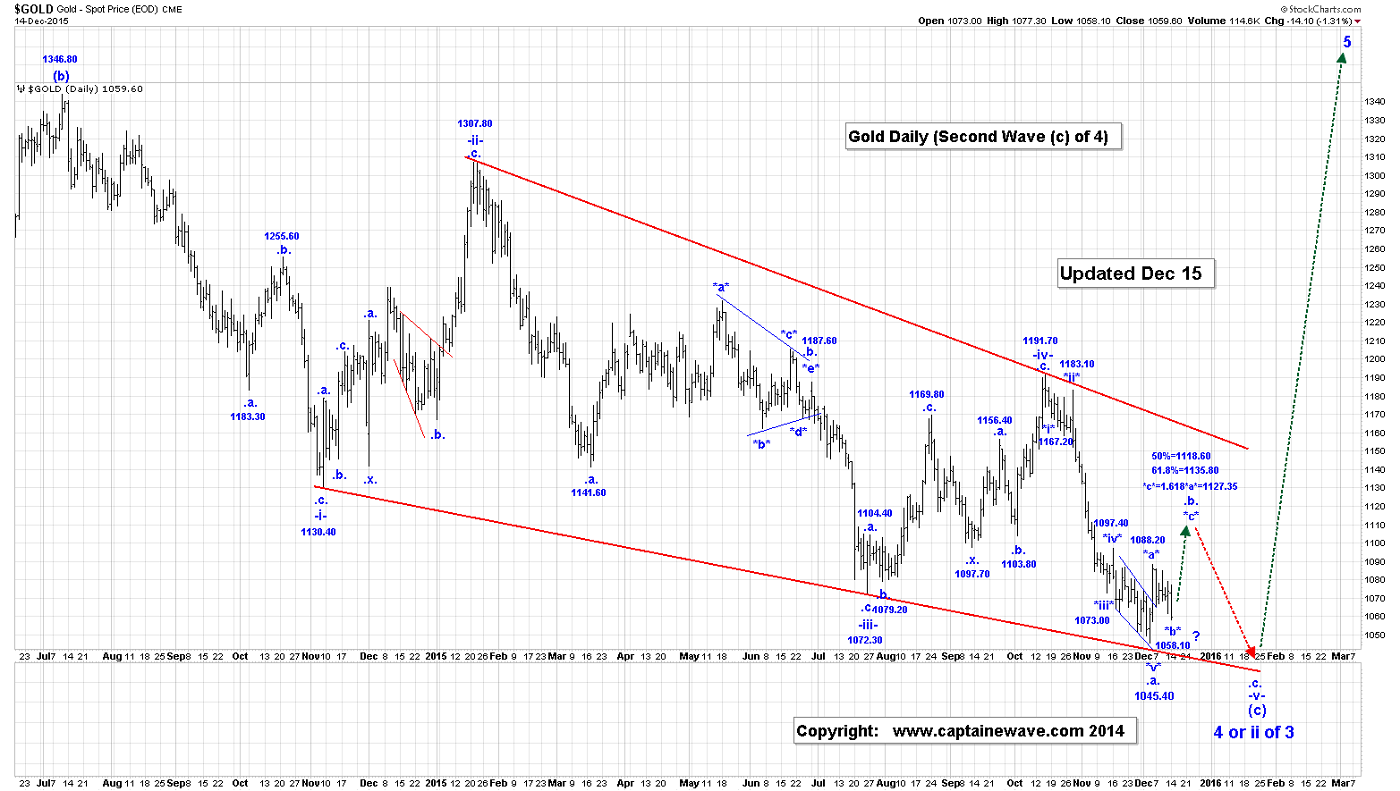
Late in yesterday’s day session, gold reached a low of 1058.20, and in the overnight session, that low held.
We are now looking for the first signs of an impulsive sequence. That will confirm that all of wave *b* of .b. is complete at the 1058.20 low.
A break above the overnight high of 1068.00 would be a good sign in that effort!
Our updated count for wave .b. is:
*a* = 1088.20;
*b* = 1058.20, if complete. Our 61.8% retracement of wave *a* is 1061.60.
*c* rally to go.
Our retracement levels for all of wave .b. are:
50% = 1118.60;
61.8% = 1135.80.
Unfortunately, upon completion of wave .b., we would expect one more drop in wave .c. to at least the 1045.40 low to complete all of wave 4 or wave ii of 3.
We are long 20 positions, with puts at 1085.00!
Crude Oil
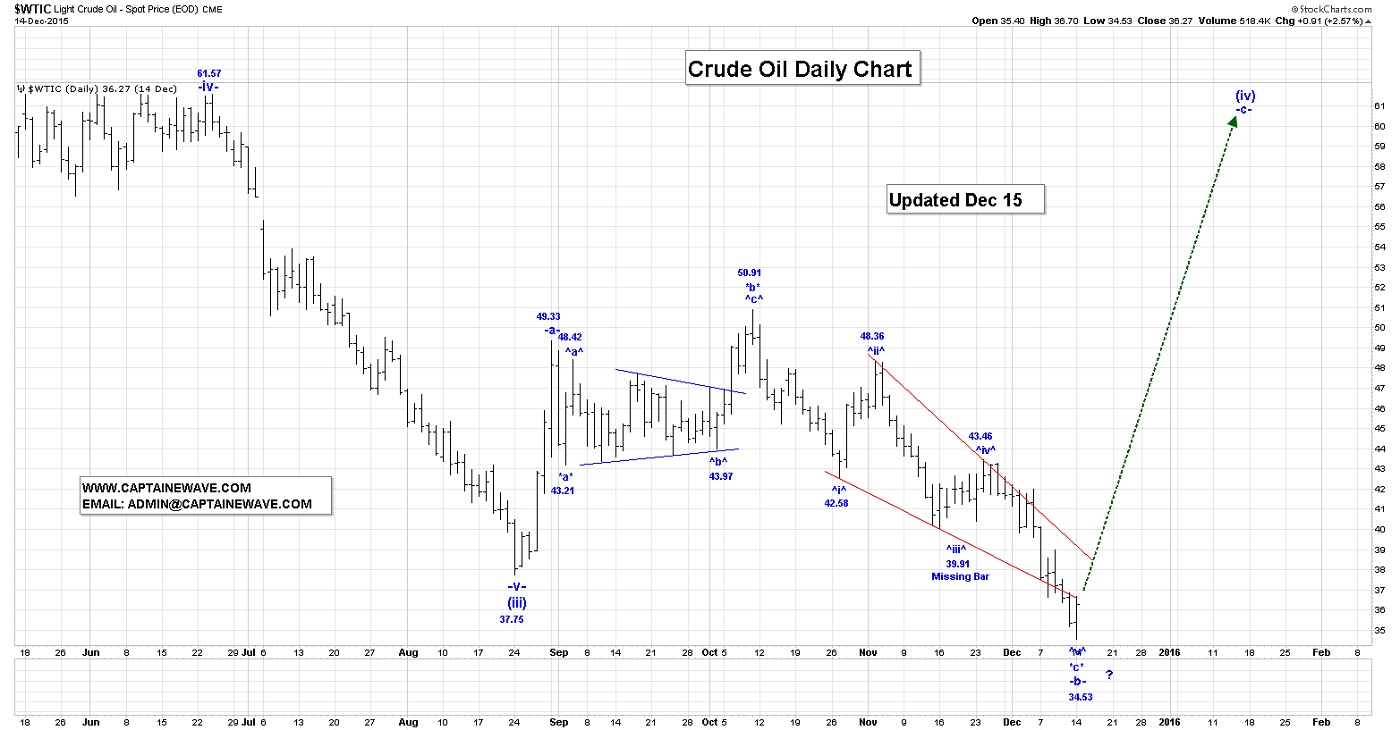
Crude reached a high of 37.10, in the overnight session. We are expecting a major low, in our wave *c* ending diagonal triangle, which is part of wave (iv) as follows:
-a- = 49.33:
-b-:
*a* = 43.21;
*b* = 50.91;
*c* ending diagonal triangle = 34.54, if complete, to complete all of wave -b-;
-c- rally is next.
Our projections for the end of wave -c are:
-c-= 1.618-a- = 53.28;
-c-= 2.618-a- = 64.86.
In order for us to confirm that wave -b- is now complete we will need crude to rally above the down trend line connecting 48.36 and 43.46.
We also mentioned in yesterday’s End of Day Post, that we need to see a clear impulsive wave structure coming out of the 34.54 low to give some confidence that wave -b- is complete at the 34.54 low.
On the Intraday Chart, we are starting to see that wave development, and based on the current pattern we should expect one more rally above the overnight high of 37.10, to complete the minimum requirements for that first impulsive sequence.
The bottom line: Evidence is building a major low in crude has been made at 34.54.
We are long 15 positions, with 42.00 puts, plus 5 positions with 37.00 puts, as stops!
S&P500
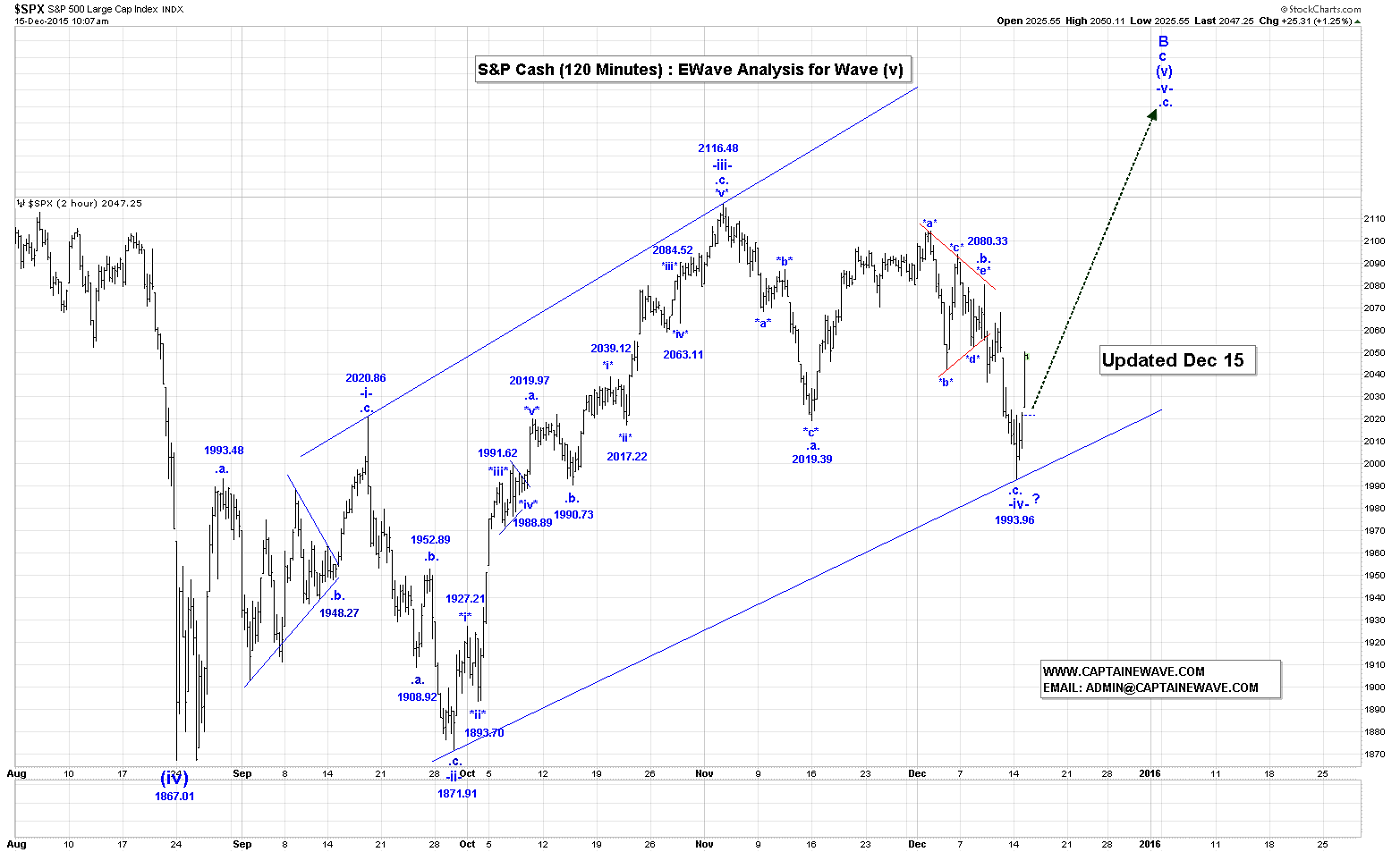
The S&P Futures are up about 14 points at the time that this Post was being written. As we indicated in yesterday’s Post we are now assuming wave -v- to all time new highs (very temporarily!) is now underway.
Before Ewave enthusiasts get too excited about the rally, please view this longer term wave analysis for the SP500:
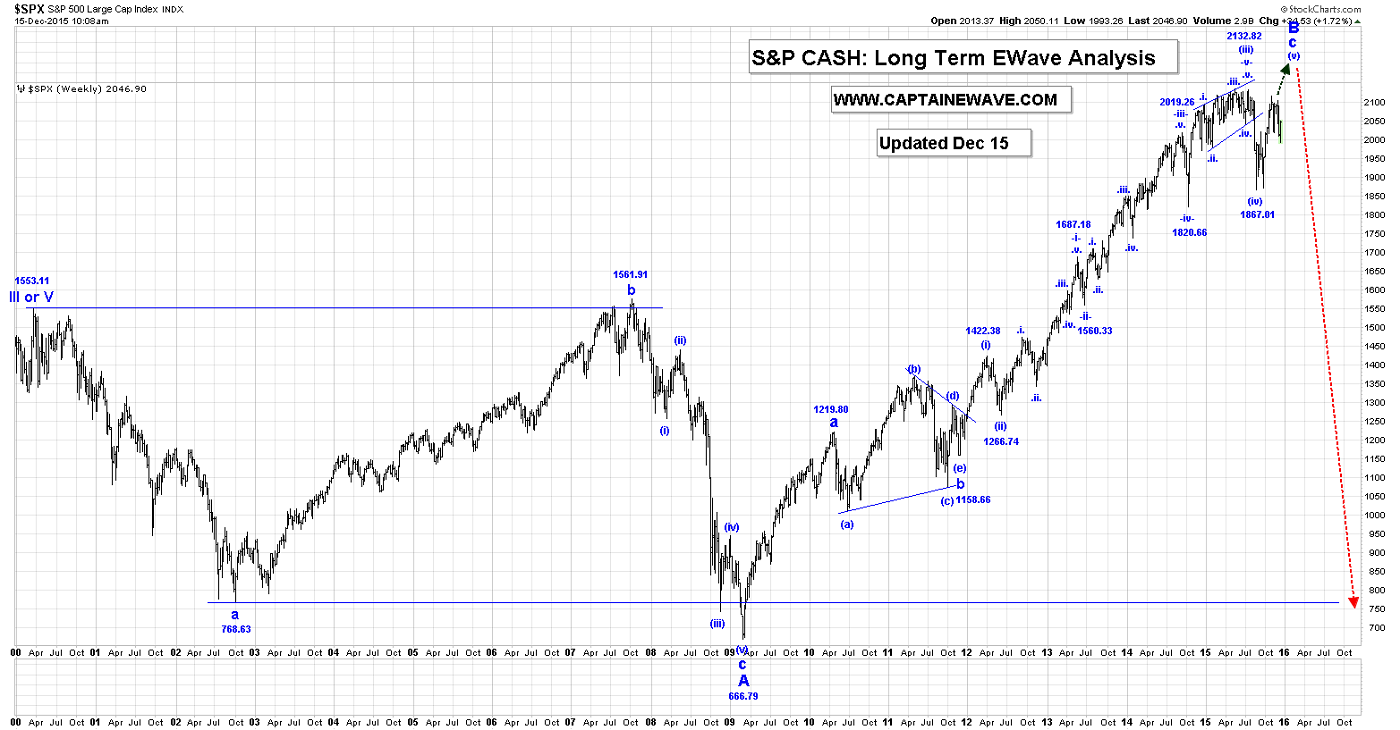
Regular technical analysis doesn’t allow for this kind of scenario, where a top pattern forms, and then the price goes a bit higher before collapsing, but that’s exactly what our wave analysis suggests is about to happen!
USDX
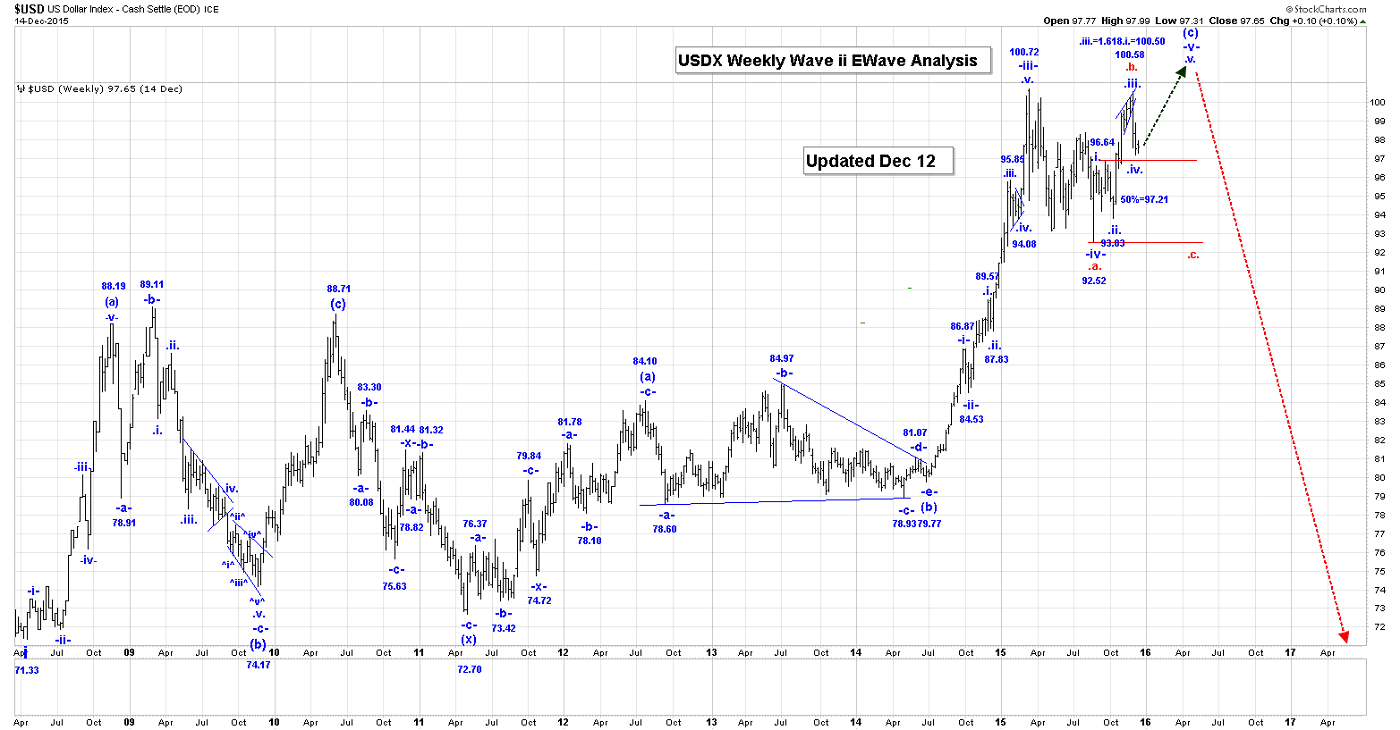
In the overnight session, the USDX reached a low of 97.23. All of our current options remain valid, and we are starting to lean a bit to the alternate option where wave .iv. is not complete and we are heading back to 97.21 low.
The USDX remains at the crossroads, as to whether all of wave .iv. is complete at the 97.21 low, or are we going to continue to drop to at least the 92.51 low, in our alternate count for wave .iv., as shown in red on the attached Weekly USDX Chart.
The trigger point for this decision will be if the USDX trades below the wave .i. high of 96.64. If it does then we will have overlap with wave .iv. which is not allowed, and then the alternate count for a drop to at least the 92.51 high will become the preferred.
So if wave .iv. is complete at the 97.21 low, then we have the following count:
*a* = 97.59;
*b* = 98.90;
*c* = 97.21, to complete all of wave .iv.
We would then be working on wave .v. higher with a minimum target of 100.71, which is the wave -iii- high.
The details of our other Options are:
Option 1: The USDX continues to fall from here and overlaps with the wave .i. high of 96.64, then we will adopt as our alternate as the preferred. On the Intraday Chart, if this analysis is correct, then the USDX should be falling in a sharp wave .c. of -iv-. This wave .c. drop could be developing into:
*i* = 97.60;
*ii* = 98.90;
*iii*:
^i^ = 97.21;
^ii^ = 98.08, if complete, with a retracement zone of between 50 to 61.8% of the entire wave ^i^ drop. These values are: 98.05 and 98.25, respectively;
^iii^ lower may have started, and a break of the 97.21 low would likely confirm this to be the case.
Option 2 Wave *b* of .iv. is becoming more complex, like an irregular type correction, and will again revisit the 98.90 area before wave *b* ends.
For the time being we will assume that all of wave .iv. is now complete at the 97.21, but we remain suspicious based on what gold is doing. We will leave our short order positions in play for another day.
Our current count for all of wave -v- is:
.i. = 96.64;
.ii. = 93.83;
.iii. = 100.58;
.iv. = 97.21, if complete now;
.v. rally to go to at least the 100.71, wave -iii- high.
In Friday's day session the USDX reached a low of 97.32.
We will short 5 at 99.25, risking to 100.59!
NatGas
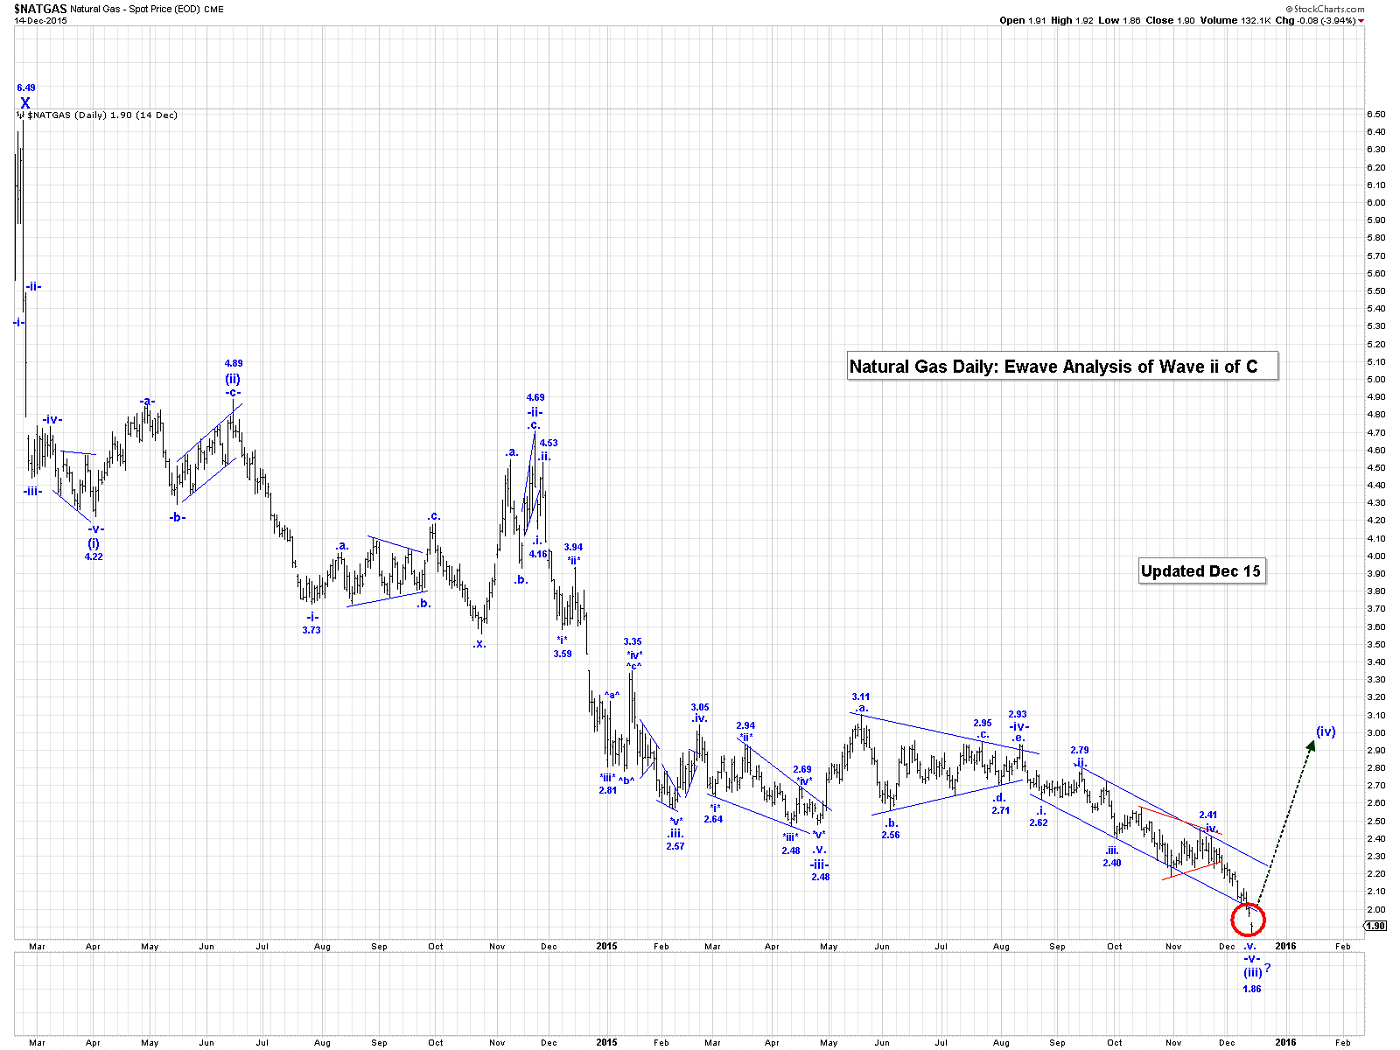
AS you can see on the attached daily NG Chart, there is a gap down in yesterday’s trade. Although not part of EWave theory, this gap down is likely an exhaustion gap, which is a sign that an imminent reversal in the market is at hand. We appear to be at the final stages of wave (iii).
In the overnight session, NG continued to drop reaching 1.857, at the time that this Post was being written.
Like crude we will need to give this market a couple of days, so that we can see a clear impulsive wave structure out of the 1.862 low…We should very soon be embarking on a multi-month wave (iv) rally that is expect to see the price of NG almost double, before all of wave (iv) ends!
Upon completion of wave (iii), we will give our projections for the end of wave (iv), which will be a retracement that ranges between 23.6% and 38.2% of the entire wave (iii) drop.
The wave (iv) rally should reach the 3.00 to 3.50 level!
HUI/GDX
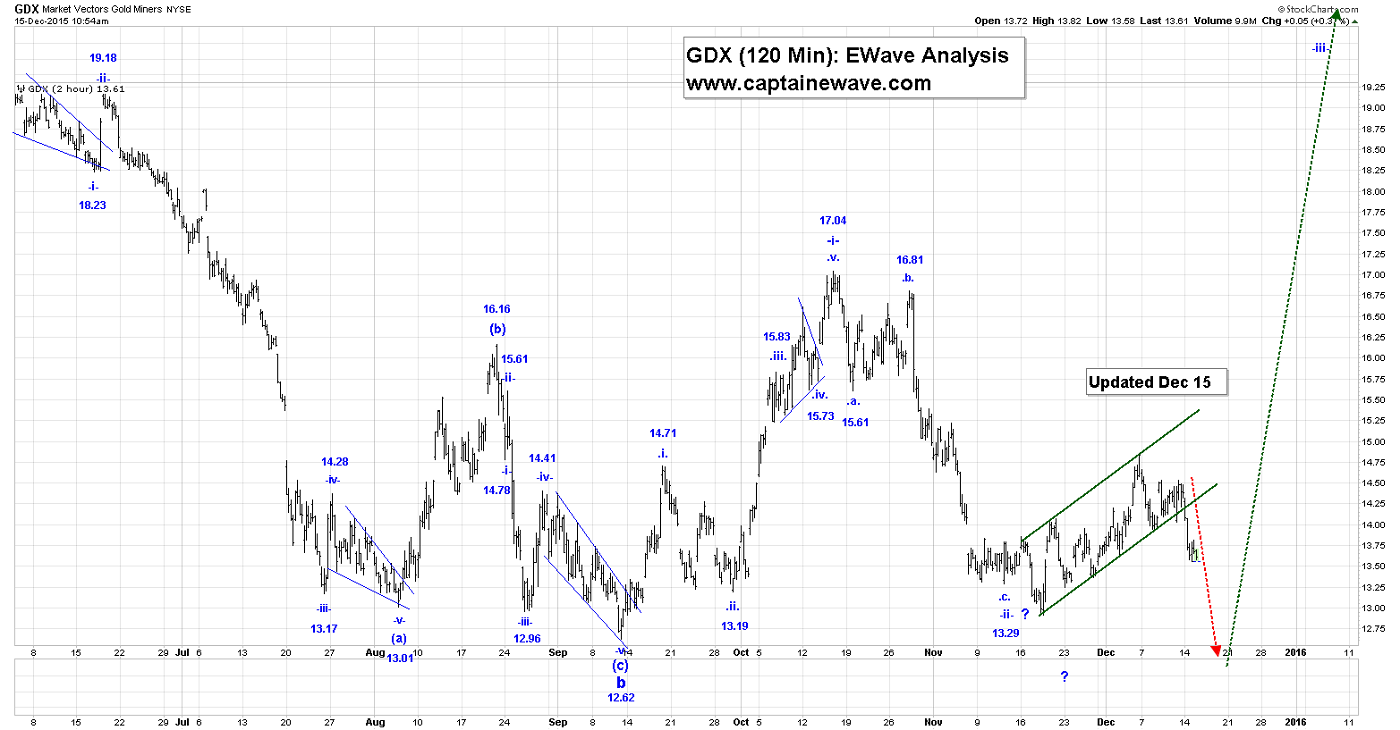
Unfortunately, we still assume that this market will be heading back to the 12.62 low at least one more time.
If crude oil is putting in a major low, which we believe it is and have put serious money on the line betting that it is, gold and golds should soon follow the crude market, to the upside!
We are long the GDX, ABX, KGC, NEM, CRJ, and TSX:XGD with no stops!
Email: [email protected]
Website: www.captainewave.com
Risk: CAPTAINEWAVE.COM IS AN IMPERSONAL ADVISORY SERVICE. AND THEREFORE, NO CONSIDERATION CAN OR IS MADE TOWARD YOUR FINANCIAL CIRCUMSTANCES. ALL MATERIAL PRESENTED WITHIN CAPTAINEWAVE.COM IS NOT TO BE REGARDED AS INVESTMENT ADVICE, BUT FOR GENERAL INFORMATIONAL PURPOSES ONLY. TRADING STOCKS DOES INVOLVE RISK, SO CAUTION MUST ALWAYS BE UTILIZED. WE CANNOT GUARANTEE PROFITS OR FREEDOM FROM LOSS. YOU ASSUME THE ENTIRE COST AND RISK OF ANY TRADING YOU CHOOSE TO UNDERTAKE. YOU ALSO AGREE TO BEAR COMPLETE RESPONSIBILITY FOR YOUR INVESTMENT RESEARCH AND DECISIONS AND ACKNOWLEDGE THAT CAPTAINEWAVE.COM HAS NOT AND WILL NOT MAKE ANY SPECIFIC RECOMMENDATIONS OR GIVE ADVICE TO YOU OR ANY OF ITS CLIENTS UPON WHICH THEY SHOULD RELY. CAPTAINEWAVE.COM SUGGESTS THAT THE CLIENT/MEMBER TEST ALL INFORMATION AND TRADING METHODOLOGIES PROVIDED AT OUR SITE THROUGH PAPER TRADING OR SOME OTHER FORM OF TESTING. CAPTAINEWAVE.COM, ITS OWNERS, OR ITS REPRESENTATIVES ARE NOT REGISTERED AS SECURITIES BROKER-DEALERS OR INVESTMENT ADVISORS EITHER WITH THE U.S. SECURITIES AND EXCHANGE COMMISSION OR WITH ANY STATE SECURITIES REGULATORY AUTHORITY. WE RECOMMEND CONSULTING WITH A REGISTERED INVESTMENT ADVISOR, BROKER-DEALER, AND/OR FINANCIAL ADVISOR. IF YOU CHOOSE TO INVEST WITH OR WITHOUT SEEKING ADVICE FROM SUCH AN ADVISOR OR ENTITY, THEN ANY CONSEQUENCES RESULTING FROM YOUR INVESTMENTS ARE YOUR SOLE RESPONSIBILITY.
ALL INFORMATION POSTED IS BELIEVED TO COME FROM RELIABLE SOURCES. CAPTAINEWAVE.COM DOES NOT WARRANT THE ACCURACY, CORRECTNESS, OR COMPLETENESS OF INFORMATION AVAILABLE FROM ITS SERVICE AND THEREFORE WILL NOT BE LIABLE FOR ANY LOSS INCURRED. DUE TO THE ELECTRONIC NATURE OF THE INTERNET, THE CAPTAINEWAVE.COM WEBSITE, ITS E-MAIL & DISTRIBUTION SERVICES AND ANY OTHER SUCH "ALERTS" COULD FAIL AT ANY GIVEN TIME. CAPTAINEWAVE.COM WILL NOT BE RESPONSIBLE FOR UNAVAILABILITY OF USE OF ITS WEBSITE, NOR UNDELIVERED E-MAILS, OR "ALERTS" DUE TO INTERNET BANDWIDTH PROBLEMS, EQUIPMENT FAILURE, OR ACTS OF GOD. CAPTAINEWAVE.COM DOES NOT WARRANT THAT THE TRANSMISSION OF E-MAILS, OR ANY "ALERT" WILL BE UNINTERRUPTED OR ERROR-FREE. CAPTAINEWAVE.COM WILL NOT BE LIABLE FOR THE ACTS OR OMISSIONS OF ANY THIRD PARTY WITH REGARDS TO CAPTAINEWAVE.COM DELAY OR NON-DELIVERY OF THE CAPTAINEWAVE.COM NIGHTLY EMAILS OR "ALERTS". FURTHER, WE DO NOT RECEIVE ANY FORM OF PAYMENT OR OTHER COMPENSATION FOR PUBLISHING INFORMATION, NEWS, RESEARCH OR ANY OTHER MATERIAL CONCERNING ANY SECURITIES ON OUR SITE OR PUBLISH ANY INFORMATION ON OUR SITE THAT IS INTENDED TO AFFECT OR INFLUENCE THE VALUE OF SECURITIES.
THERE IS NO GUARANTEE PAST PERFORMANCE WILL BE INDICATIVE OF FUTURE RESULTS. NO ASSURANCE CAN BE GIVEN THAT THE RECOMMENDATIONS OF CAPTAINEWAVE.COM WILL BE PROFITABLE OR WILL NOT BE SUBJECT TO LOSSES. ALL CLIENTS SHOULD UNDERSTAND THAT THE RESULTS OF A PARTICULAR PERIOD WILL NOT NECESSARILY BE INDICATIVE OF RESULTS IN FUTURE PERIODS. THE RESULTS LISTED AT THIS WEBSITE ARE BASED ON HYPOTHETICAL TRADES. PLAINLY SPEAKING, THESE TRADES WERE NOT ACTUALLY EXECUTED. HYPOTHETICAL OR SIMULATED PERFORMANCE RESULTS HAVE CERTAIN INHERENT LIMITATIONS. UNLIKE AN ACTUAL PERFORMANCE RECORD, SIMULATED TRADES DO NOT REPRESENT ACTUAL TRADING. ALSO, SINCE THE TRADES HAVE NOT ACTUALLY BEEN EXECUTED, THE RESULTS MAY HAVE OVER OR UNDER COMPENSATED FOR THE IMPACT, IF ANY, OF CERTAIN MARKET FACTORS SUCH AS LACK OF LIQUIDITY. YOU MAY HAVE DONE BETTER OR WORSE THAN THE RESULTS PORTRAYED. NO REPRESENTATION IS BEING MADE THAT ANY ACCOUNT WILL OR IS LIKELY TO ACHIEVE PROFITS OR LOSSES SIMILAR TO THOSE SHOWN. NO INDEPENDENT PARTY HAS AUDITED THE HYPOTHETICAL PERFORMANCE CONTAINED AT THIS WEBSITE, NOR HAS ANY INDEPENDENT PARTY UNDERTAKEN TO CONFIRM THAT THEY REFLECT THE TRADING METHOD UNDER THE ASSUMPTIONS OR CONDITIONS SPECIFIED HEREAFTER. WHILE THE RESULTS PRESENTED AT THIS WEBSITE ARE BASED UPON CERTAIN ASSUMPTIONS BELIEVED TO REFLECT ACTUAL TRADING CONDITIONS, THESE ASSUMPTIONS MAY NOT INCLUDE ALL VARIABLES THAT WILL AFFECT, OR HAVE IN THE PAST AFFECTED, THE EXECUTION OF TRADES INDICATED BY CAPTAINEWAVE.COM. THE HYPOTHETICAL RESULTS ON THIS WEBSITE ARE BASED ON THE ASSUMPTION THAT THE CLIENT BUY AND SELLS THE POSITIONS AT THE OPEN PRICE OF THE STOCK. THE SIMULATION ASSUMES PURCHASE AND SALE PRICES BELIEVED TO BE ATTAINABLE. IN ACTUAL TRADING, PRICES RECEIVED MAY OR MAY NOT BE THE SAME AS THE ASSUMED ORDER PRICES.
share
share
share
share
share


