Technical Analysis Of The Markets


Current Position Of The Market
SPX: Long-term trend – The bull market is continuing with no sign of a major top in sight.
Intermediate trend – Soon coming to an end.
Analysis of the short-term trend is done on a daily basis with the help of hourly charts. It is an important adjunct to the analysis of daily and weekly charts which discusses the course of longer market trends.
Bullish Trend Continues
Market Overview
Another minor top was projected for this week, and the market complied once again. We’ll continue this price action until we can say “the intermediate top has arrived!” But that could still be a couple of weeks away and, in the meantime, more new all-time highs are still in store. In fact another new one should be just around the corner after we have another minor correction.
It has been an amazing performance for the stock market considering all that is going on in Washington DC. It would be interesting to speculate on how it will end, but this is not the purpose of this newsletter, so let’s confine ourselves to speculating on (not “in”) this irrationally exuberant market, and where it will take us! As far as we can tell, the end of the bull market is not in sight
Chart Analysis (These charts and subsequent ones courtesy of QCharts)
SPX Daily Chart:
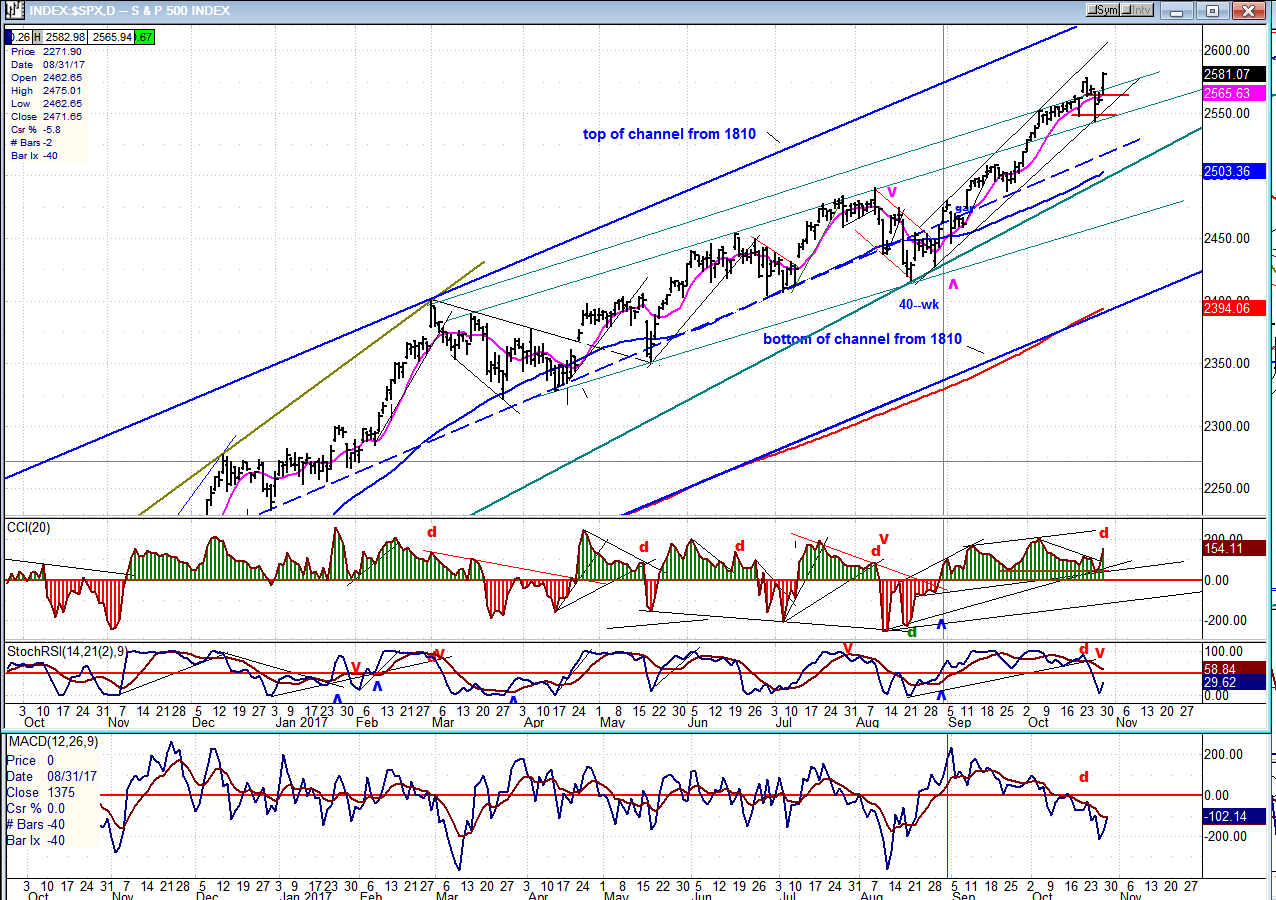
After briefly dipping below the (dashed) mid-channel line of the intermediate-term channel from 1810, SPX quickly recovered and moved above it again. I should mention that keeping prices in the top part of a channel and refusing to decline in the lower half is a sign of strength, just in case you have difficulty of arriving at that conclusion simply by looking at the price move itself! And, as mentioned above, the bulls are still very much in charge since the index just made another all-time high, but the indicators are beginning to tell us that this will not last too much longer. Not only are we showing negative divergence in the CCI, but the two lower indicators have gone negative and have not been able to get back on the positive side of the zero line in this last advance. This is a warning that a correction is just around the corner and that the risk factor is rapidly increasing. But it’s not time to panic, yet! We should still have another short-term correction – a little larger than the last one – and then make another new high. This is when swing traders should pay close attention. Longer-term investors may choose to ride out the 100/150 point-correction that lies immediately ahead and wait for the next market top after that. Just as short-term retracements become increasingly deeper as we approach an intermediate term top, so it is for longer-term ones and the next important correction after the one which is almost upon us should smart even more.
As did the last one, the next minor correction should come out of the steep channel, and we’ll have to draw another trend line at a lesser angle. And when that next one breaks and price drops below the dashed line one more time, we will probably be on our way to the bottom of the larger channel, this time.
SPX Hourly Chart:
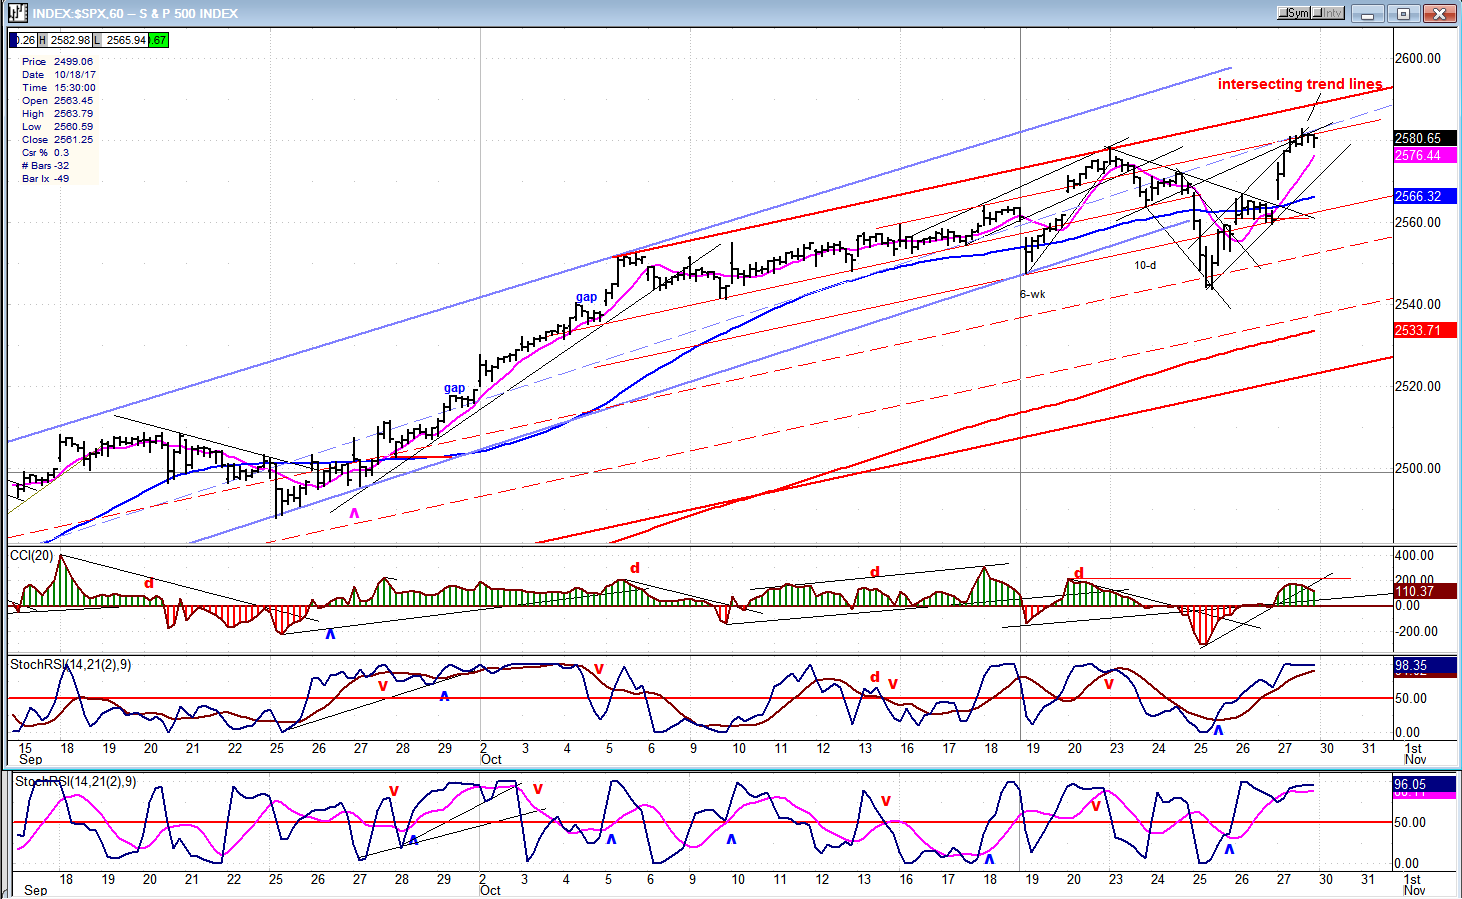
On its hourly chart, SPX shows that it ran into five intersecting trend lines on Friday, and that is causing the resistance level which corresponds to a phase projection which should form the top of the current phase and bring about a pull-back before we complete the move from 2544. These trend lines are not drawn at random. They are the parallels of established trend lines of various degrees that have already proven their value. If you begin to experiment with parallel trend lines drawn from another high or low, you will find that they usually do provide support and resistance points for future price moves.
In addition to finding resistance at the 2580-82 level, you can see that the indicators are beginning to round over, which is another sign that we have probably arrived at a near-term top. If my analysis is correct, the index should pull back for a day or two, before completing the move from 2544.
On Friday, SPX was boosted by a big hiccup in tech stocks which resulted from good earnings reports. As an example, Amazon was up over a hundred points, with Google, Microsoft and the semis all participating. This caused a big move in SPX while the DJIA was much more subdued.
An Overview Of Some Important Indexes (Daily Charts)
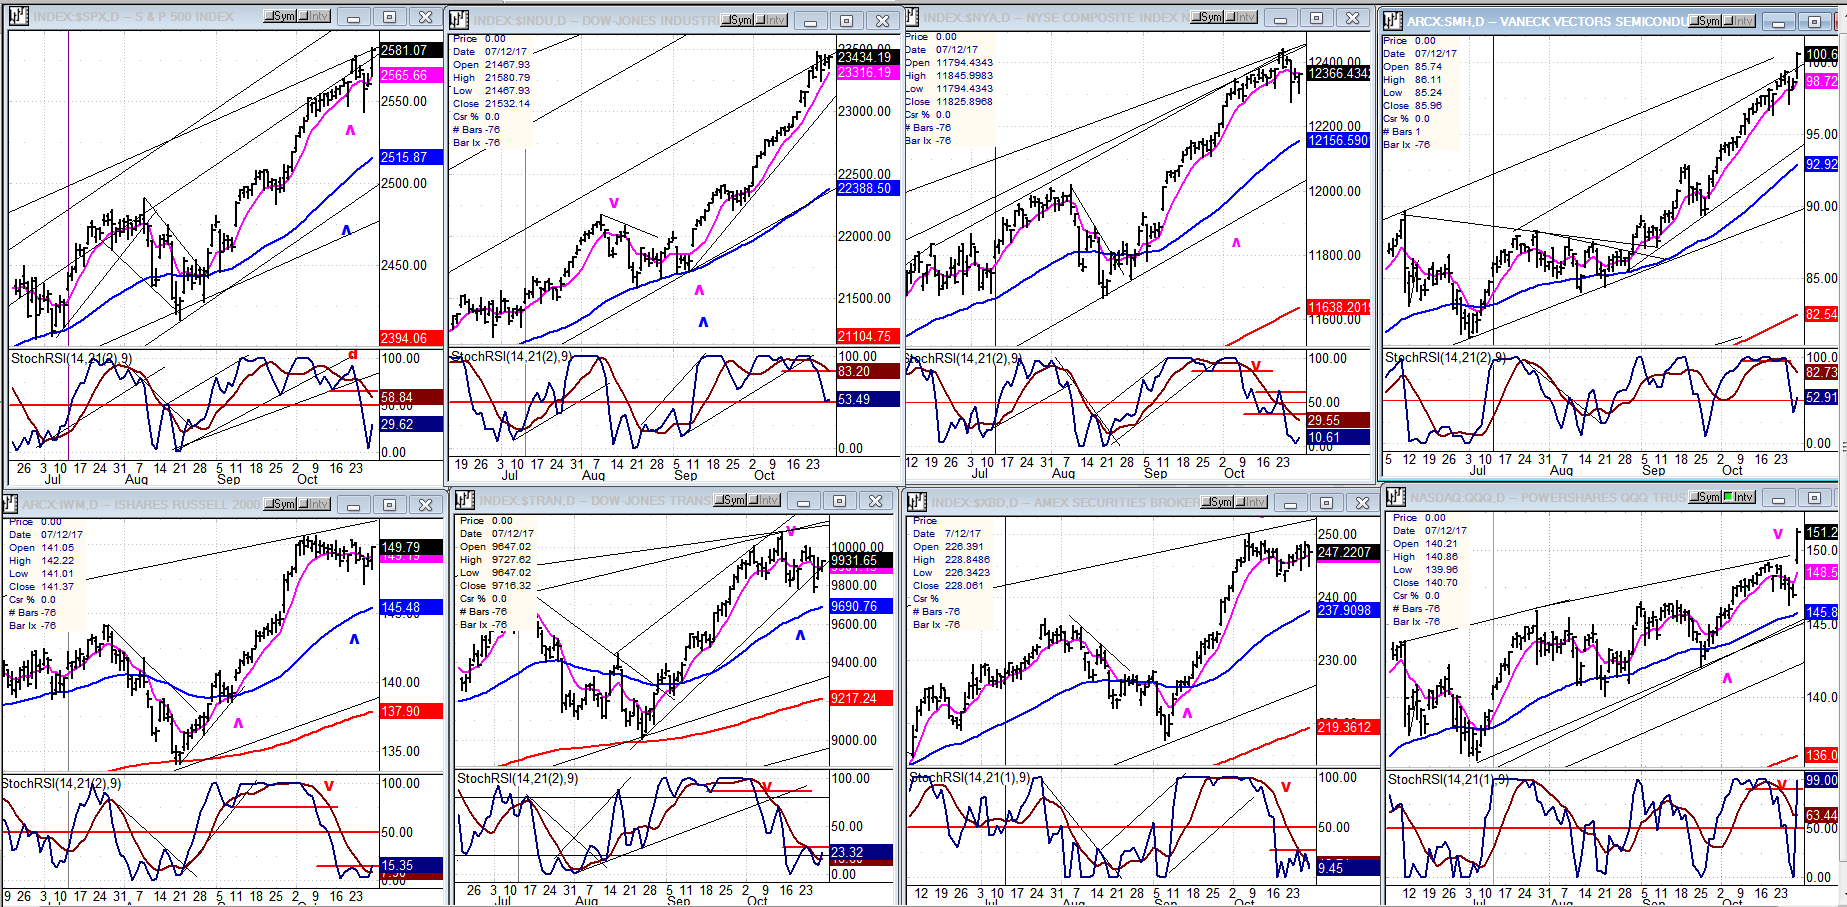
No significant change this week with continued consolidation in IWM and TRAN (bottom 1 and 2) in spite of the tech surge which gave QQQ (#4, bottom) a big boost!
UUP (Dollar ETF)
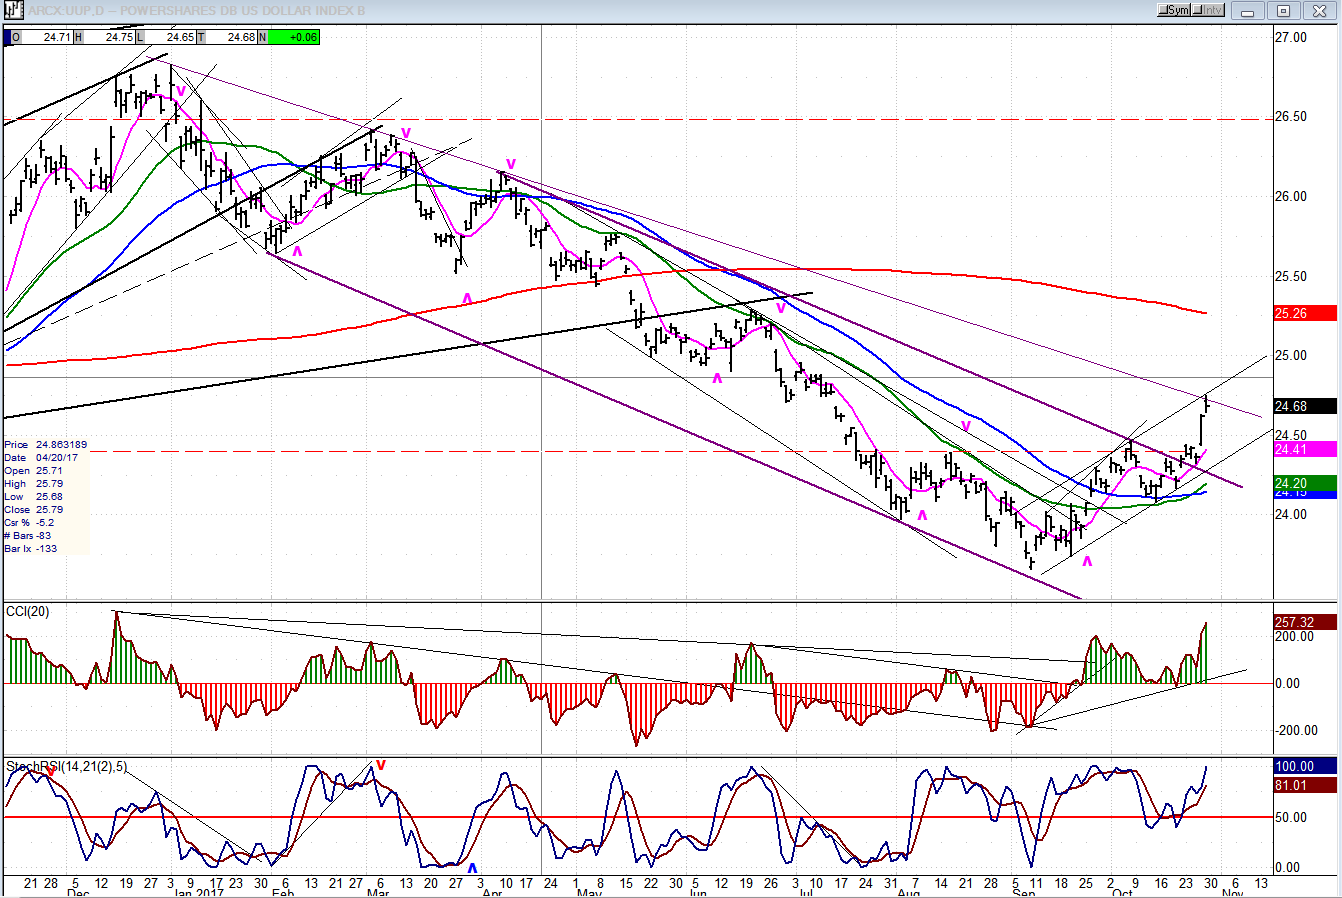
The dollar has ended its correction and started a new uptrend which moved sharply higher after clearing the top line of its corrective channel. It should have established enough momentum to carry it up to its 233-MA, which would amount to about a 50% retracement of its declining phase.
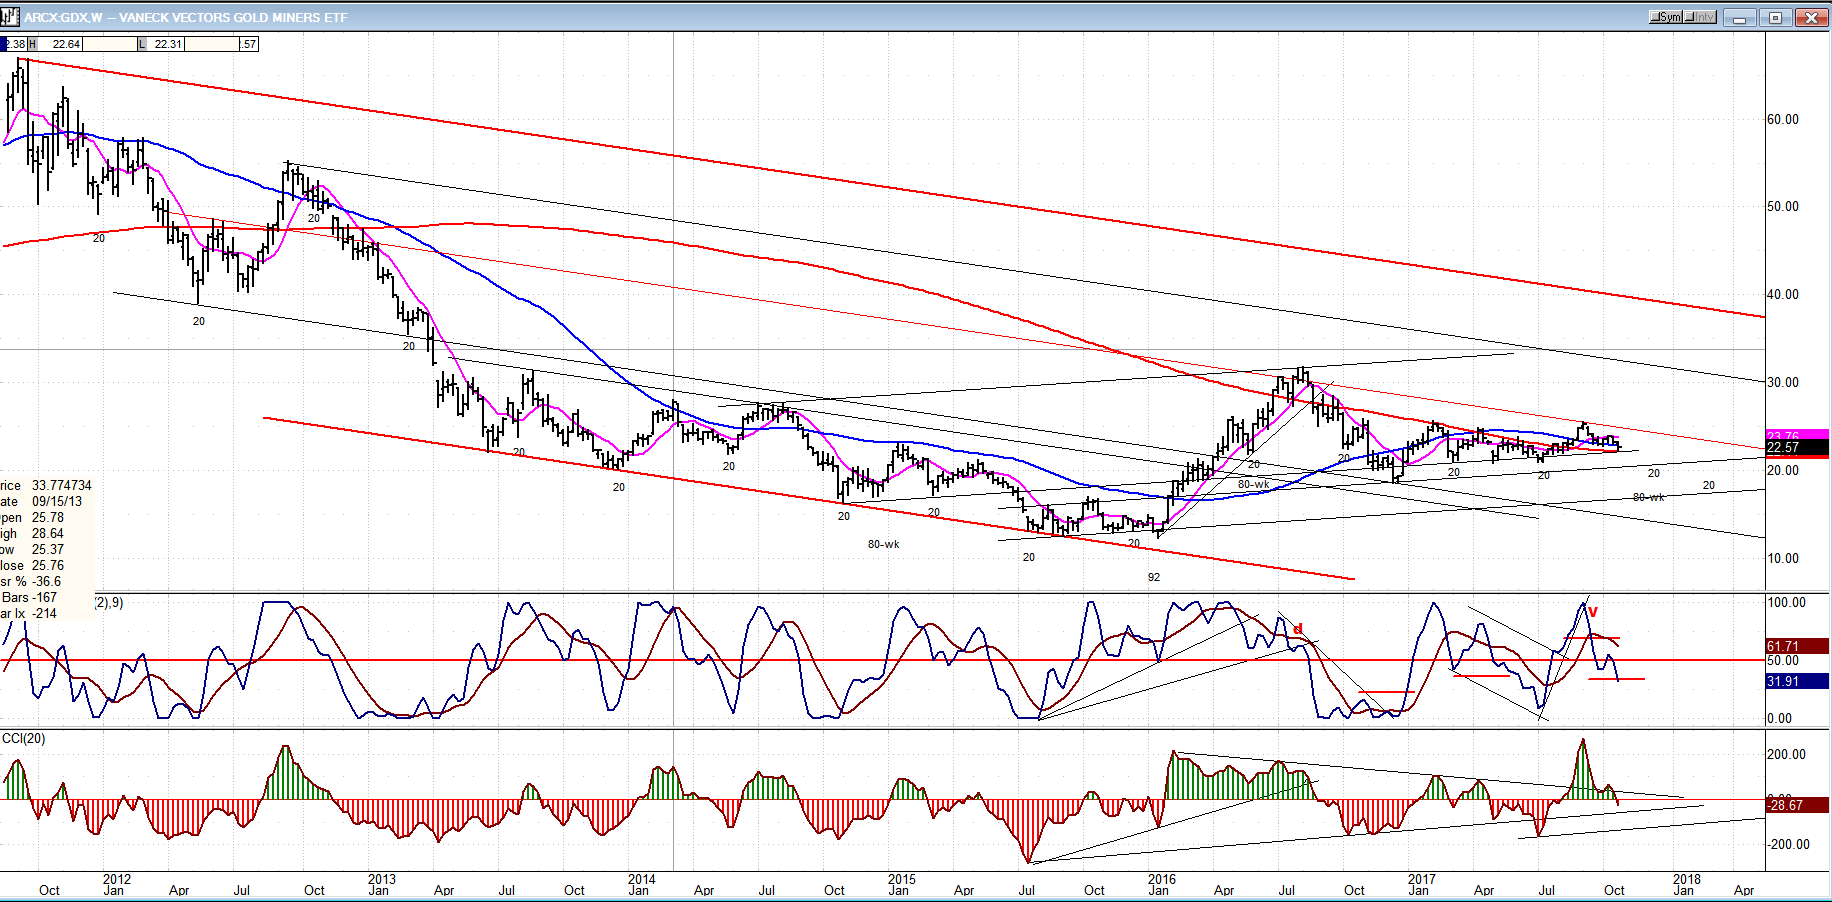
GDX (ETF For Gold)
A weekly chart of GDX clearly shows that the index is still in the lower portion of a long-term corrective channel. This means the notion that gold is ready to soar once again is definitely too optimistic, although higher prices should be seen next year. Continued corrective action over the near-term should extend to the first part of December and the low of the 52-wk cycle.
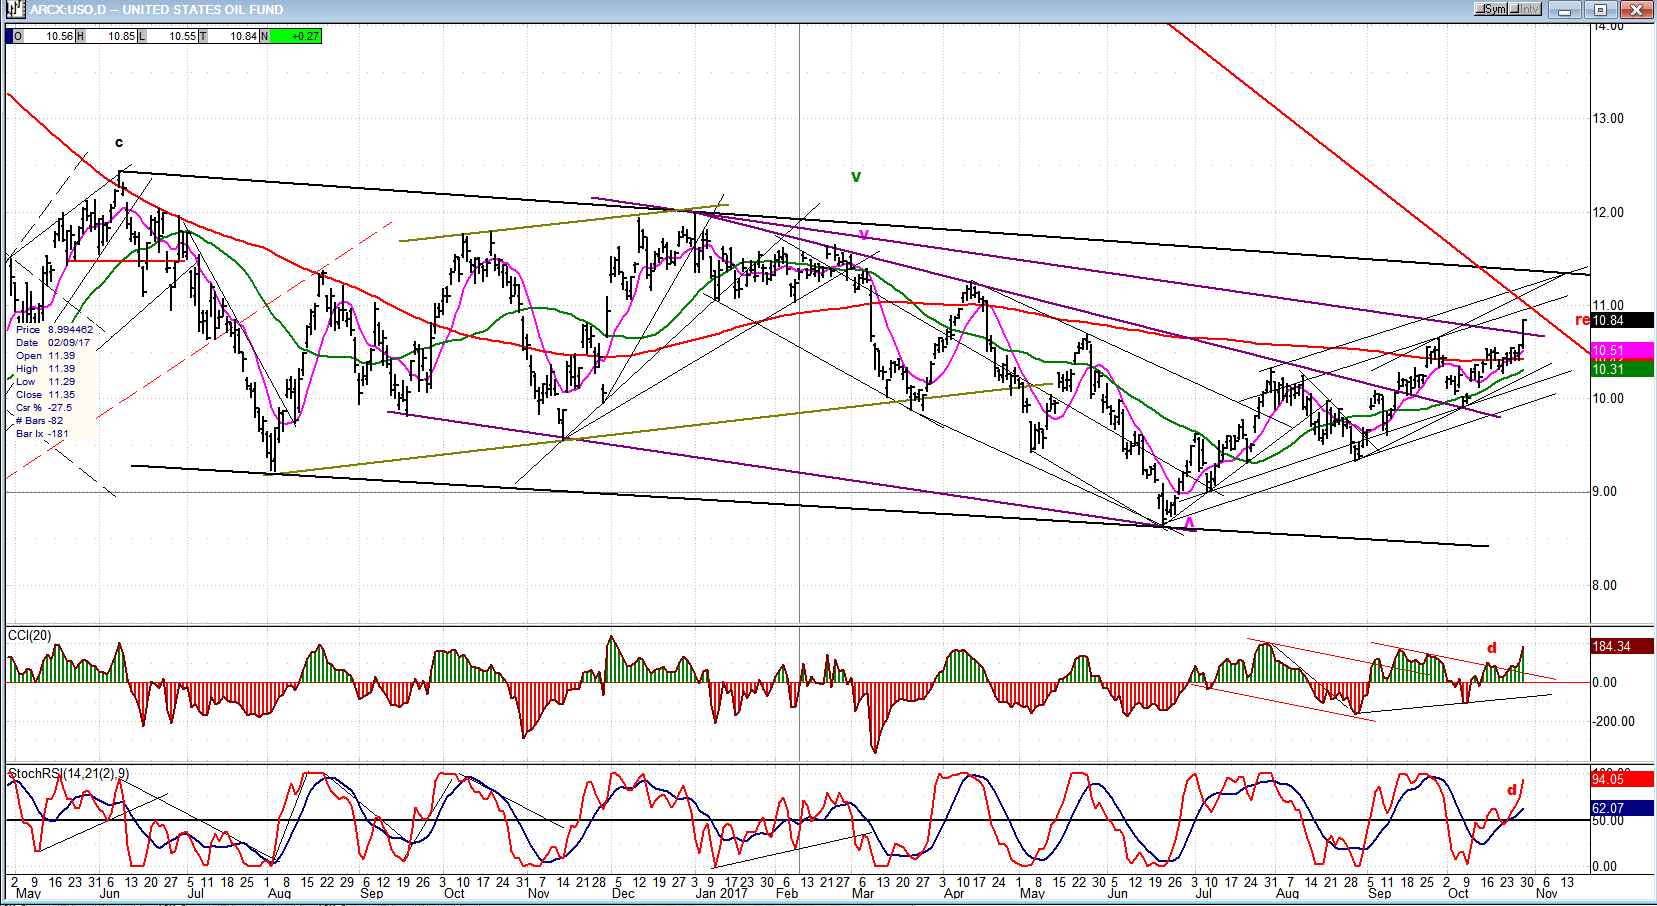
USO (United States Oil Fund)
USO continues to move higher and has now cleared another intermediate term channel line. However, it is quickly reaching a strong resistance level which consists of the (red) top line of its long-term corrective channel, and just above that, the top of its eighteen month basing formation. It is not likely that this resistance will be overcome anytime soon, but if it is, it would suggest that USO may have started another long-term uptrend.
Summary
SPX is quickly drawing closer to the end of its rally from 1810 where a price reversal could start a correction that would last into early next year.
*********
FREE TRIAL SUBSCRIPTON
Market Turning Points is an uncommonly dependable, reasonably priced service providing intra-day market updates, explanations, and commentary, plus detailed weekend reports. It is ideally suited to traders, but it can also be valuable to longer-term holders since price projections are provided using Point & Figure analysis along with best-time estimates obtained from cycle analysis.
For a FREE 4-week trial, Send an email to: [email protected]
For further subscription options, payment plans, and for general information, I encourage you to visit my website at www.marketurningpoints.com.
The above comments about the financial markets are based purely on what I consider to be sound technical analysis principles. They represent my own opinion and are not meant to be construed as trading or investment advice, but are offered as an analytical point of view which might be of interest to those who follow stock market cycles and technical analysis.

When Andre Gratian was a stock broker years ago, a friend introduced him to technical analysis of the market. Consequently, it is not an exaggeration to say that Andre fell in love with this approach! Ever since then, it has become an increasingly important part of his professional life. Gratian has studied the works of Wyckoff, Edwards & Magee, Edward J. Dewey (cycles) and many others. However, one of my most profitable undertaking has probably been to study Point & Figure charting, which he finds invaluable in analyzing stocks and indices. If he were restricted to one methodology, this is the one that he would choose. This well-rounded background has given him what he feels to be a special insight into the stock market, facilitating the recognition of meaningful patterns and the ‘turning points’ in all trends, whether they be short or long term. Andre feels very comfortable discussing the stock market and passing on meaningful information to others. His subscribers include individuals and money managers throughout the world. Moreover, his Newsletters are currently published on several financial sites, here and abroad.


