Technical Analysis Of The Markets


Current Position of the Market
SPX: Long-term trend – The bull market is continuing with a top expected in the low 3000s.
Intermediate trend – A short-intermediate term top is re-forming at a higher level!.
Analysis of the short-term trend is done on a daily basis with the help of hourly charts. It is an important adjunct to the analysis of daily and weekly charts which discusses the course of longer market trends.
Near An Intermediate Top?
Market Overview
“What was thought to have been a distribution pattern turned out to be a re-accumulation phase which has given us a pretty good idea of how far this move will carry …” Newsletter of 01/07
Because of the unrelenting climb of the stock market, I went back to check the congestion pattern which formed just above the 1810 level which suggests that the bull market has farther to go; but when broken down into phases, there is a phase count pointing to an important top in this general area. This is also confirmed by the re-accumulation pattern which materialized at the 2685 level.
We have entered the potential target range that is suggested, with the price action of the past couple of weeks rising exponentially. The little congestion area which formed late Friday may be one of the last stepping stones to the maximum count derived from the 2685 pattern.
Bar charts do not show clearly the amount of congestion which forms at consolidation levels, but Point & Figure charts do, and by some mysterious coincidence, the count always seems to closely match the Fibonacci calculations determining the length of EWT waves. It could have been construed that the wave which has been under way from the 2000 level would end at 2695, but market action quickly suggested that another extension of that wave had formed which had the potential of reaching the current price range in the SPX. However, in doing so, it has been stretched to the limit, another reason to believe that we are reaching an area from which an important correction -- which could be sharp -- should start. Another possibility is that the momentum will subside gradually and form a series of near-term lows and highs thereby building a distribution top for a few weeks before starting a correction of at least one hundred points into the May time frame.
Also, Eric Hadik’s INSIDE Track Intra-month Update predicts a 10M cycle inversion for Jan/Feb which will result in a peak in this time frame.
Chart Analysis (These charts and subsequent ones courtesy of QCharts)
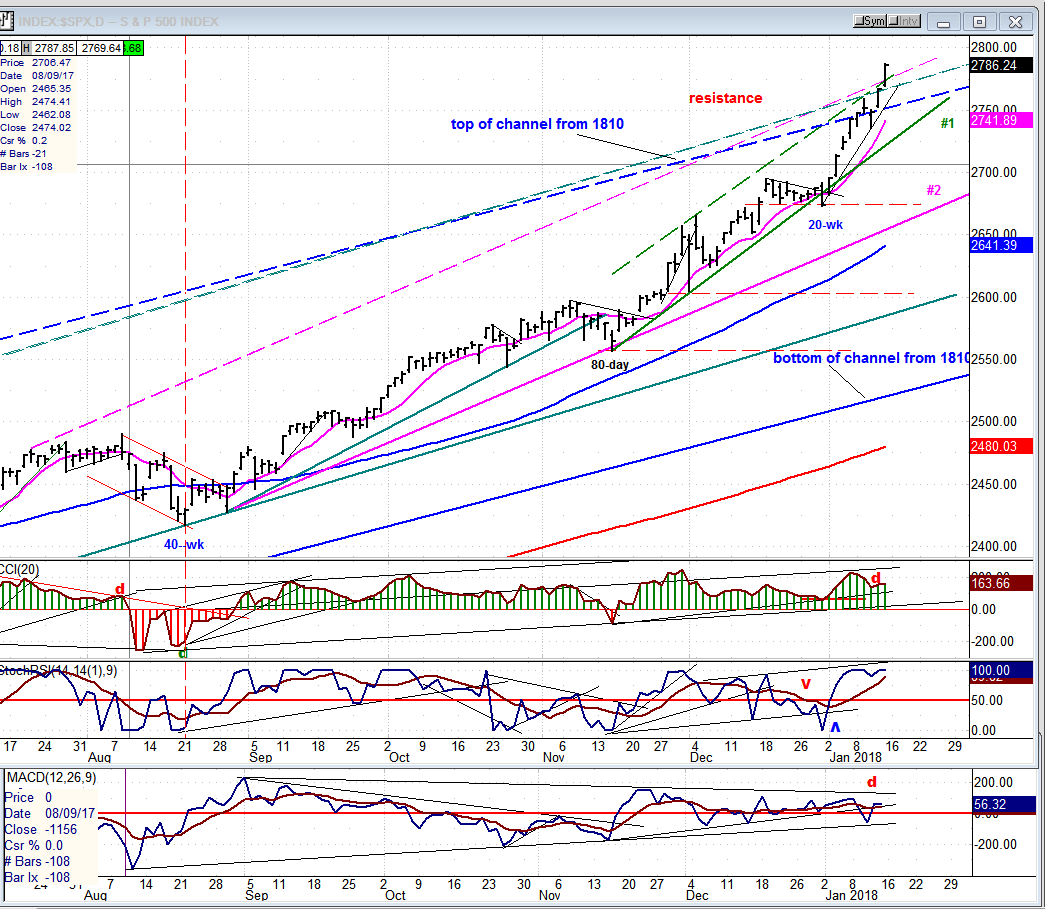
SPX Daily Chart
The title of last week’s letter was: “A Little Euphoria”. This action did not abate during the past few days (in spite of a brief correction), but actually increased, giving the daily chart an exponential look into Friday’s close. While it is not easy to predict when such a move will end -- until it has -- we do have a count (price) as well as a cycle (time) projection suggesting that we are essentially there! If correct, a top should begin to manifest itself over the near future.
It is interesting that the A/D pattern of selling into the high volume opening gap was again apparent on Friday, as it took the A/D index down to 36 by 1:30. Although it recovered to 262 by the close, it’s obvious that this is a poor breadth showing for a 19-point day. I believe that it indicates that professionals, which have large positions, are liquidating into market strength.
The advance has now taken the index beyond the top line of all the channels discussed last week, an area where it should have found resistance. History suggests that this type of action is short-lived, normally ending in a sharp reversal. Is this what’s in store for next week? We shall see! We should also note that during the 370-point move since August ’16, the index has only had two normal 20-point corrections, and a 50-point news-induced panic which only lasted a couple of hours.
I had suggested earlier that the rally would end when trend line #1 was broken. It was only breached slightly at the end of December by a truncated 20-wk cycle low. There is now an even steeper trend line for the January portion of the rally which will have to be broken first.
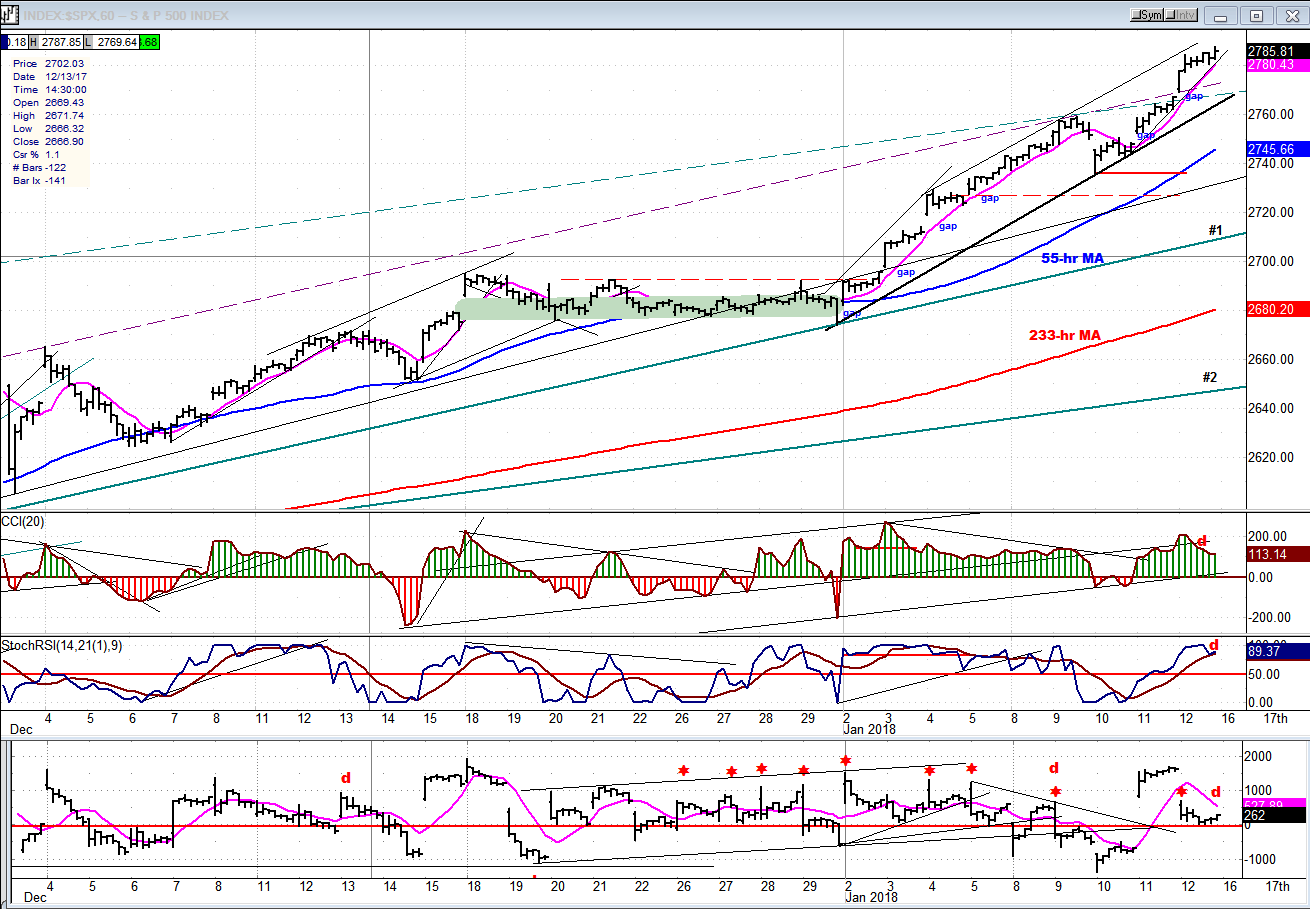
SPX Hourly Chart:
The hourly chart shows the index action since that 2-hour panic of 50 points The flat segment highlighted in green represents the last re-accumulation pattern from which I drew the confirming count of a little over one hundred points on the P&F chart, which has already taken us to where we are. There are six open gaps since the 2676 low, and many more if we start counting from the August low. This is another reason why this price action is not sustainable. But we have a more reliable price/time completion suggested for the rally which was discussed earlier.
A couple of minor cycles due next week could bring a minor correction as a preview to the final high. This is also what the negative divergence which appeared on the oscillators by the end of the day is suggesting. The lowest one is the A/D differential. The selling which took place in the first hour is marked with a red asterisk.
The thin uptrend line is the former “trend line #1” which was only violated at the end of December. I have redrawn it lower to take into consideration the year-end low of 2675. But the first trend line to give way, should be the short, thin one created last week. It blends with the (pink) 9-hr MA which, as you can see, has done a good job of tracking prices over the near-term.
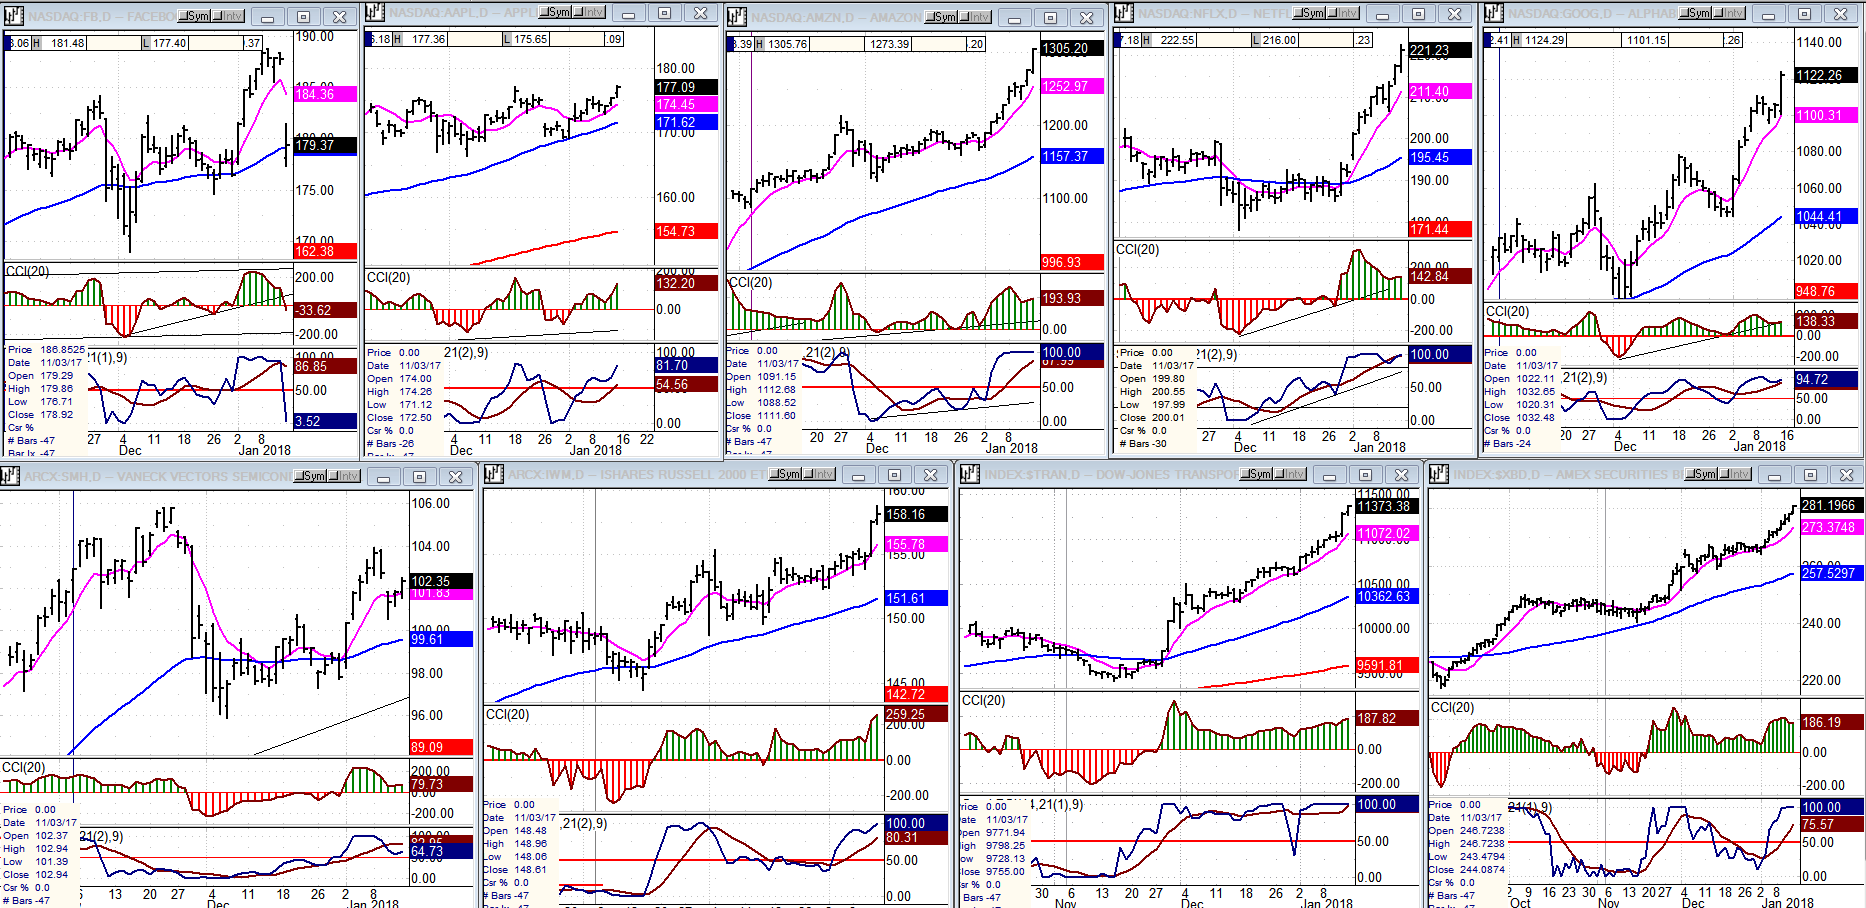
An Overview Of Some Important Indexes (Daily Charts)
In the FAANGs last week, Facebook corrected on Friday and Apple only reached its former high while the others continued to show strength. In the lower tier, semiconductors appear to have topped, but the other three are still strong. We’ll have to see more corrective patterns starting before a top becomes apparent.
UUP (Dollar ETF)
UUP renewed its decline, threatening to make new lows. No sign of strength there!
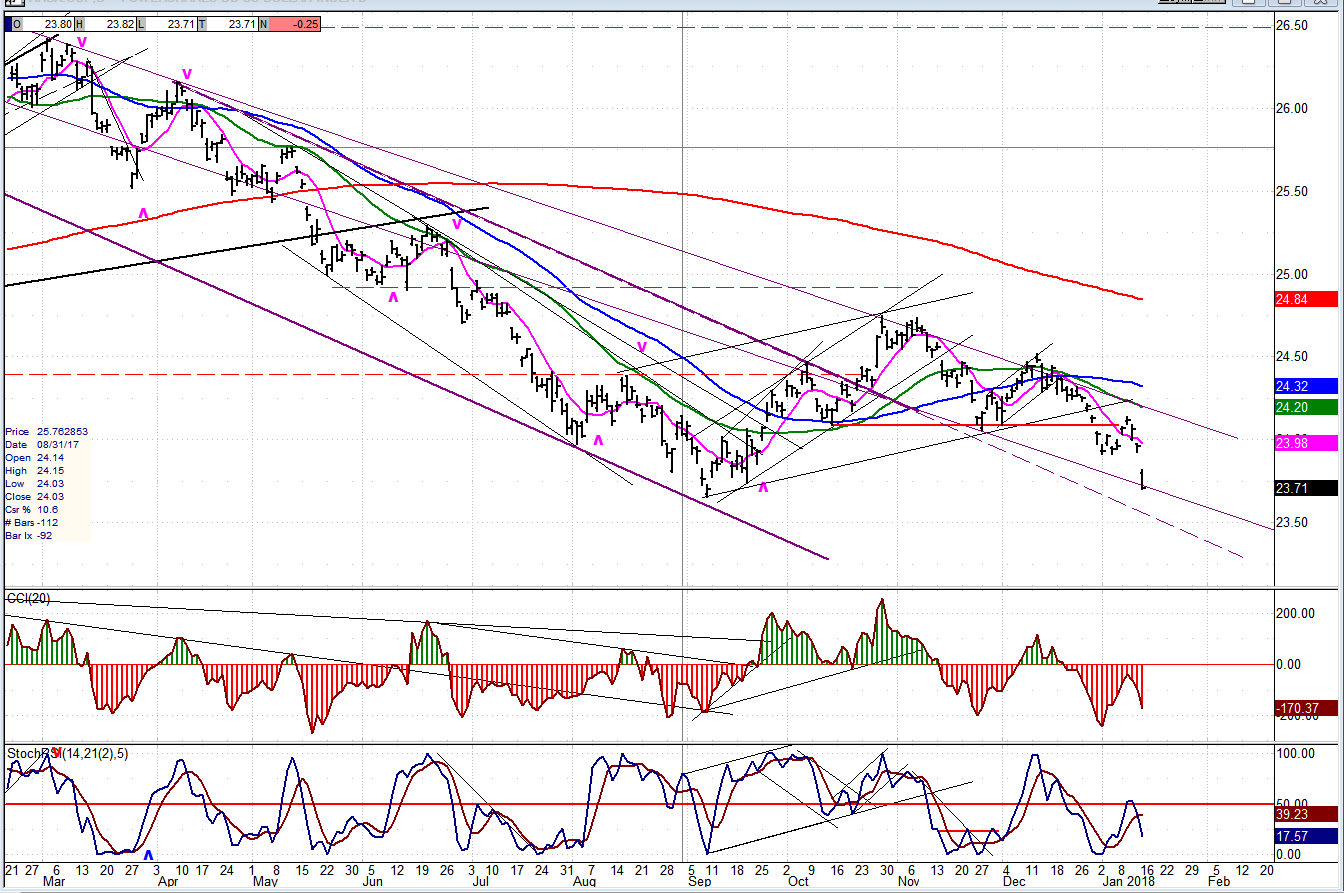
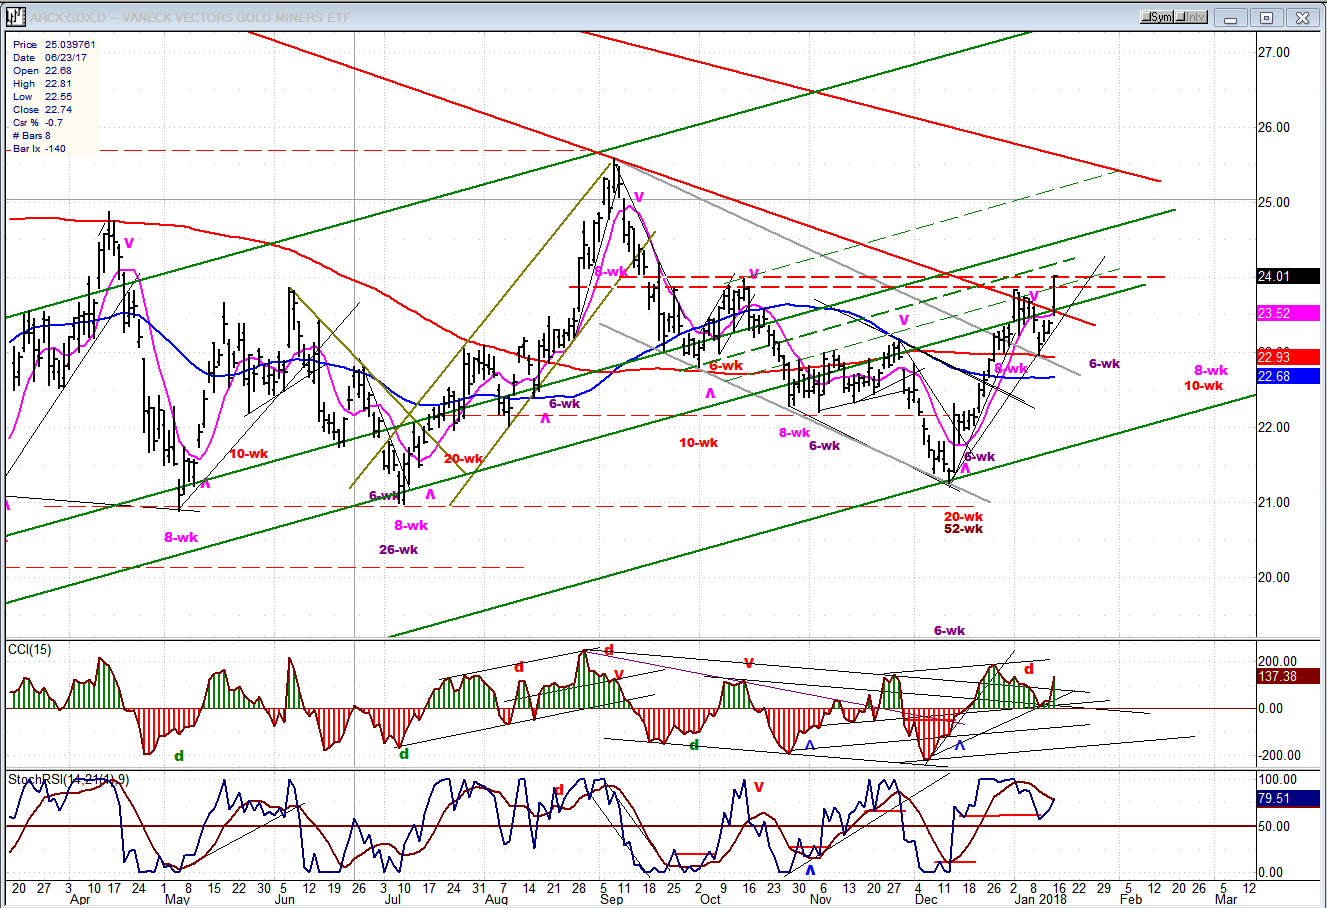
GDX (Gold Miners ETF)
GDX is overcoming the resistance band, but the move from about 21 may soon end. This last advance looks like a wave 5 which should have a limited push higher, with 24.50 a possibility. Afterward, a correction should develop which could continue into the 8/10-wk cycles bottoming in late February.
USO (United States Oil Fund)
USO has reached its 12.50-13.00 basic projection, but coud push a little higher before starting to correct. This also looks like a wave 5 which should soon complete.

Summary
SPX is ostensibly approaching a time-price projection; but it could hesitate reaching the final high before having an intermediate reversal, even though it is in sight, unless the move ends in a buying climax which would bring about a sharp correction near-term, before a period of distribution begins.
A couple of minor cycles are due next week.
*********
FREE TRIAL SUBSCRIPTON
With a trial subscription, you will have access to the same information that is given to paid subscribers, but for a limited time period. I think you will find that knowing how far a move can carry is one of the most useful benefits of this service, whether you are a trader or an investor -- especially when this price target is confirmed by reliable indicators which give advance warning of a market top or bottom. Furthermore, cycle analysis adds the all- important time element to the above price projections.
For a FREE 4-week trial, further subscription options, payment plans, and for general information, I encourage you to visit my website at www.marketurningpoints.com.
The above comments about the financial markets are based purely on what I consider to be sound technical analysis principles. They represent my own opinion and are not meant to be construed as trading or investment advice, but are offered as an analytical point of view which might be of interest to those who follow stock market cycles and technical analysis.

When Andre Gratian was a stock broker years ago, a friend introduced him to technical analysis of the market. Consequently, it is not an exaggeration to say that Andre fell in love with this approach! Ever since then, it has become an increasingly important part of his professional life. Gratian has studied the works of Wyckoff, Edwards & Magee, Edward J. Dewey (cycles) and many others. However, one of my most profitable undertaking has probably been to study Point & Figure charting, which he finds invaluable in analyzing stocks and indices. If he were restricted to one methodology, this is the one that he would choose. This well-rounded background has given him what he feels to be a special insight into the stock market, facilitating the recognition of meaningful patterns and the ‘turning points’ in all trends, whether they be short or long term. Andre feels very comfortable discussing the stock market and passing on meaningful information to others. His subscribers include individuals and money managers throughout the world. Moreover, his Newsletters are currently published on several financial sites, here and abroad.


